
Abstract
The aim of this study was to evaluate the structure and measurement invariance of the religious identity, religious practice, and religious beliefs across cultures in six world regions (Asia, non-Western Europe, North America, Oceania, South America, and Western Europe) and across Western, Educated, Industrialized, Rich, and Democratic regions (WEIRD) and non-WEIRD world regions. Confirmatory factory analysis examined whether the hypothesized measurement model fits the data; several multi-group confirmatory factor analyses were performed to examine measurement invariance through a progressive analytic strategy involving three invariance conditions of configural, metric, and scalar invariance. The results generally supported the adequate fit to the data of the three correlated factors model (religious identity-RII, religious practice-RPI, and religious beliefs—RBI); it was found to be full metric invariance for WEIRD regions (RII), North America (RII and RBI), Western Europe (RII) and Non-Western Europe (RII), and South America (RII and RBI). Finally, for RII, it was found to be full configural invariance in almost all regions, except North America and Oceania; for RPI, it was found to be full configural only in North America and Non-WEIRD regions; and for RBI, it was found to be full configural only in North America, Asia, and South America, being that women scored significantly higher than men in all three indices all over the world; finally, it was found to be configural, but not metric or scalar invariance across WEIRD and non-WEIRD world regions.
Introduction
Durkheim (1965) defined religion as a “. . . unified system of beliefs and practices relative to sacred things (. . .), things set apart and prohibited—beliefs and practices which unite into one moral community called a Church, all those who adhere to them” (p. 47). Religiosity includes a positive relationship with one or more religions; religion entails a set of doctrinal beliefs and behaviors that are shared by a community (Jensen, 2021). Individual religiosity is a multidimensional construct, but there is no general consensus on the number and meaning of these dimensions (Lemos et al., 2019), in spite of views on ultimate questions of meaning, purpose, and the sacred being, which are often central to personhood (Dollinger, 2001).
Religious identity is a discourse on boundaries, relatedness, and otherness and, at the same time, encompassment and inclusiveness; religious and identity together are a way of life related to the sacred (Werbner, 2009). For believers, religious identity includes a given understanding of the relationship between the human and the sacred worlds, created beings and God, and sacred and profane. It is also a matter of individual subjectivity (Werbner, 2009). In modern societies, with secularism and liberalism, individual religious identities may assume different nuances, from a collectively based to individual and from a primary or master role to a secondary one (Hammond, 1988). Secularization theory argues that modernization has been eroding religious identity and traditional values, through a progressive overlap of science (explaining) over religion (accepting mystery) (Liquin et al., 2020), despite the differences across distinct countries (Pfaff, 2007).
Religious practice is also a multidimensional construct (Hill et al., 2000). Religious practices, or religious activity, are the behaviors that religious people perform as a part of their religious conduct, including rites, rituals, and worship practices (Argyle, 2006). These religious practices are truly connected with culture (Fox, 2020). Religious beliefs are beliefs that motivate religious action, being natural outputs of human cognitive systems solving daily problems (Barrett & Lanman, 2008). These authors distinguish between two types of beliefs: reflective (conscious) and non-reflective or intuitive beliefs (not conscious). According to Szocik (2017), religious beliefs are an expression of evolutionary adaptation.
“The unceasing scientific discussions on secularization and globalization have increased the need for valid research instruments to measure and compare religiosity across individuals and countries” (Remizova et al., 2022, p. 2). In an attempt to find a religious matrix common to people and cultures from different locations, some authors developed cross-cultural studies. Remizova et al. (2022) found four unidimensional measurement models with approximate invariance and four overlapping groups of countries; they also found that indicators covering practices, importance of religion, and confidence in its institutions were more cross-nationally invariant than others. Also, Aditya et al. (2021) assessed the factorial structure of the four basic dimensions of religiousness among Muslim and Christian college students in Indonesia and found configural, metric, and scalar invariance.
Lemos et al. (2019) studied the dimensionality and factorial invariance of religiosity over 26 countries with a Christian heritage, based on the 1998 and 2008 rounds of the International Social Survey Programme (ISSP) Religion survey. The authors found three factors, common to Christian participants and religiously unaffiliated respondents, namely, “Beliefs in afterlife and miracles,” “Belief and importance of God,” and “Religious involvement.” Lemos et al. (2019) found metric—and scalar—invariance across gender, age, educational degree, and religious (un)affiliation; however, in the measurement invariance across the countries, the criteria for metric invariance were met for 23 countries, and partial scalar invariance was accepted for 14 countries only.
Also, Bechert (2018) identified dominant cross-national profiles of religiosity, although specific characteristics and profiles could be ordered on a single latent continuum from low to high levels of religiosity. Bechert (2018) considered it almost impossible to establish full invariance across countries with a comprehensive set of variables measuring religiosity; however, partial homogeneity could be achieved. Cohen et al. (2017) studied measurement invariance across US Protestants, Irish Catholics, and Turkish Muslims and across US Protestants, Catholics, and Muslims concerning Gorsuch and McPherson’s measure of intrinsic and extrinsic religiosity. The authors found that a five-item version of intrinsic religiosity was invariant across the US samples and predicted less warmth toward atheists and gay men/lesbians. Meuleman and Billiet (2011) found that “religious involvement” met the criteria for partial metric invariance for 25 countries, and partial scalar invariance for 21 out of 25 countries studied. Also, Meuleman (2011) found that large data sets may help to identify dimensions of religiosity and its differences between countries and cultures.
Several authors found differences in the religious phenomena according to social and economic characteristics (Solt et al., 2011; Sullins, 2006; Zheng et al., 2020); cultural characteristics (Cohen et al., 2016; Saroglou & Cohen, 2013); and personality and political factors (L. Lee, 2012; K. Lee et al., 2018). These authors found that a right-wing political orientation was negatively associated with honesty–humility and openness to experience and positively associated with religiosity, being that the strength of these associations varied across countries (the religiosity–politics correlations were stronger in more religious countries, whereas the personality–politics correlations were stronger in more developed countries).
Religiosity might be explained by the cognitive and emotional value that religious group membership provides, grounded in a belief system; consideration of religion’s dual function as a social identity and a belief system facilitates greater understanding of the variability across individuals and groups (Ysseldyk et al., 2010). According to Erikson (1968), religion provides a transcendent worldview that supports moral beliefs and behavioral norms in an ideological base, but “religious traditions also embody these ideological norms in a community of believers” (King, 2019, p. 198). So, religiosity can be seen as (religious) identity (Ysseldyk et al., 2010). Also, religiosity refers to people’s tendencies to commit to religious beliefs, principles, and activities (Ellis et al., 2019). This seems to suggest that the dimensions of religious identity, religious beliefs, and practices are the most relevant to the study of religion. It is important to explain what factorial invariance is and why it is used in this kind of study. Factorial invariance is a concept applied in the context of psychometric analysis (. . .) and postulates that the psychometric properties of a questionnaire, used either by multiple groups or by the same group over time, have to be identical to ensure an unbiased comparison of factor means. (Nolte & Elsworth, 2014, p. 2146)
That is, the instrument’s psychometric properties that are identified in factor analysis (confirmatory factor analysis (CFA)) have to be identical across groups (Meredith, 1993). When the validation process includes comparisons among groups on a construct (in this case, religious identity, religious practices and religious beliefs), it must be ensured that the assessment instrument is performing in the same way and that “the underlying construct has the same theoretical structure for each group” (Dimitrov, 2010, p. 121). In a cross-cultural research, it is mandatory to establish that the instruments used to measure constructs are the same across cultures before they are used to assess cross-cultural differences and similarities or to test any theory. To that end, a systematic process was conceived by Steenkamp and Baumgartner (1998), including a series of CFA and, at the same time, progressively increasing restrictive conditions in each step.
The continued use of the ISSP across cultural contexts encourages the need for stronger valid measures of religiosity. Besides, no study addresses religious identity, religious practice, and religious beliefs as autonomous and separate concepts, yet correlated, in different countries and, above all, in different regions of the world. To fill this gap, the aim of this study was to evaluate the structure and measurement invariance of the three indices across cultures in six world regions (Asia, non-Western Europe, North America, Oceania, South America, and Western Europe) and across Western, Educated, Industrialized, Rich, and Democratic regions (WEIRD) and non-WEIRD world regions. If most research about these issues are performed specially in WEIRD countries (Henrich et al., 2010; Rad et al., 2018), the comparison between societies might bring us important insight to understand these issues.
Method
The hypotheses under analysis are the three correlated factors model (religious identity, religious practice, and religious beliefs) would represent adequate fit to the data (H1); through the assessment of the single factor model of CFA, based on standard recommendations (Bentler, 1990; Flora & Flake, 2017); this structure would be invariant across men and women, with the latter scoring higher on all indices (H2); this structure would be invariant across WEIRD and non-WEIRD world regions (H3). These last two hypotheses were tested comparing the differences in approximate fit statistics between subsequent models.
Measures
The public database used in this study was retrieved from the International Social Survey Programme (ISSP): Religion IV—ISSP 2018. The ISSP is a cross-national collaboration program with the aim of conducting annual surveys on topics relevant to social sciences (Role of Government, Social Networks, Social Inequality, Family and Changing Gender Roles, Work Orientations, Religion, Environment, National Identity, Citizenship, Leisure Time and Sports, and Health and Health Care). Its members are from several world regions and cultures and its institutional members, each of them representing one nation, consist of academic organizations, universities, or survey agencies (ISSP Research Group, 2020). Statistical data on the composition of national populations in terms of gender, age, education, and employment rates allow assessing the representativity of the national samples. Participants should be aged 18 years and older (with a few exceptions) and the selection method is a probability sample (simple random, systematic random, stratified sample, and multistage sample). The modalities of data collection were face-to-face interview with or without computer-assisted (CAPI/CAMI) or with paper-and-pencil (PAPI); self-administered questionnaire: paper or web-based (CAWI) or computer-assisted (CASI), and telephone interview: computer-assisted (CATI).
The database used in this study includes several items related to religion (Table 1) as well as sociodemographic items (Table 2). Religious identity includes the following variables and response modalities: V20 Closest to respondent’s belief about God (1—I don’t believe in God, 2—don’t know whether there is a God and no way to find out, 3—don’t believe in a personal God, but in a Higher Power, 4—find myself believing in God sometimes, but not at others, 5—while I have doubts, I feel that I do believe in God, 6—I know God really exists and have no doubts about it); V21 Best describes beliefs about God (1—I don’t believe in God now and I never have, 2—I don’t believe in God now, but I used to, 3—I believe in God now, but I didn’t use to, 4—I believe in God now and I always have); V48 Respondent describes self as religious (1—extremely non-religious, 2—very non-religious, 3—somewhat non-religious, 4—neither religious nor non-religious, 5—somewhat religious, 6—very religious, 7—extremely religious); V49 Best describes respondent (1—I don’t follow a religion, I am not a spiritual person, 2—I don’t follow a religion, I am a spiritual person, 3—I follow a religion, I am not a spiritual person, 4—I follow a religion, I am a spiritual person). Religious practice included V43 How often respondent pray (from 1—never to 11—several times a day); V44 Take part in church activities (from 1—never to 9—several times a week); V45 Last 12 months: Read or listened to religious scripture outside of worship? (1—yes, 2—no); V47 Visit holy places (from 1—never to 5—about once a month or more); ATTEND Attendance of religious services (from 1—never, 8—several times a week or more often, including every day, several times a day). Finally, Religious beliefs included V22 Belief in life after death (1—no, definitely not, 4—yes, definitely); V23 Belief in heaven (1—no, definitely not, 4—yes, definitely); V24 Belief in hell (1—no, definitely not, 4—yes, definitely); V25 Belief in religious miracles (1—no, definitely not, 4—yes, definitely); and V27 God concerns Himself with human beings (from 1—strongly disagree to 5—strongly agree).
Religious variables.
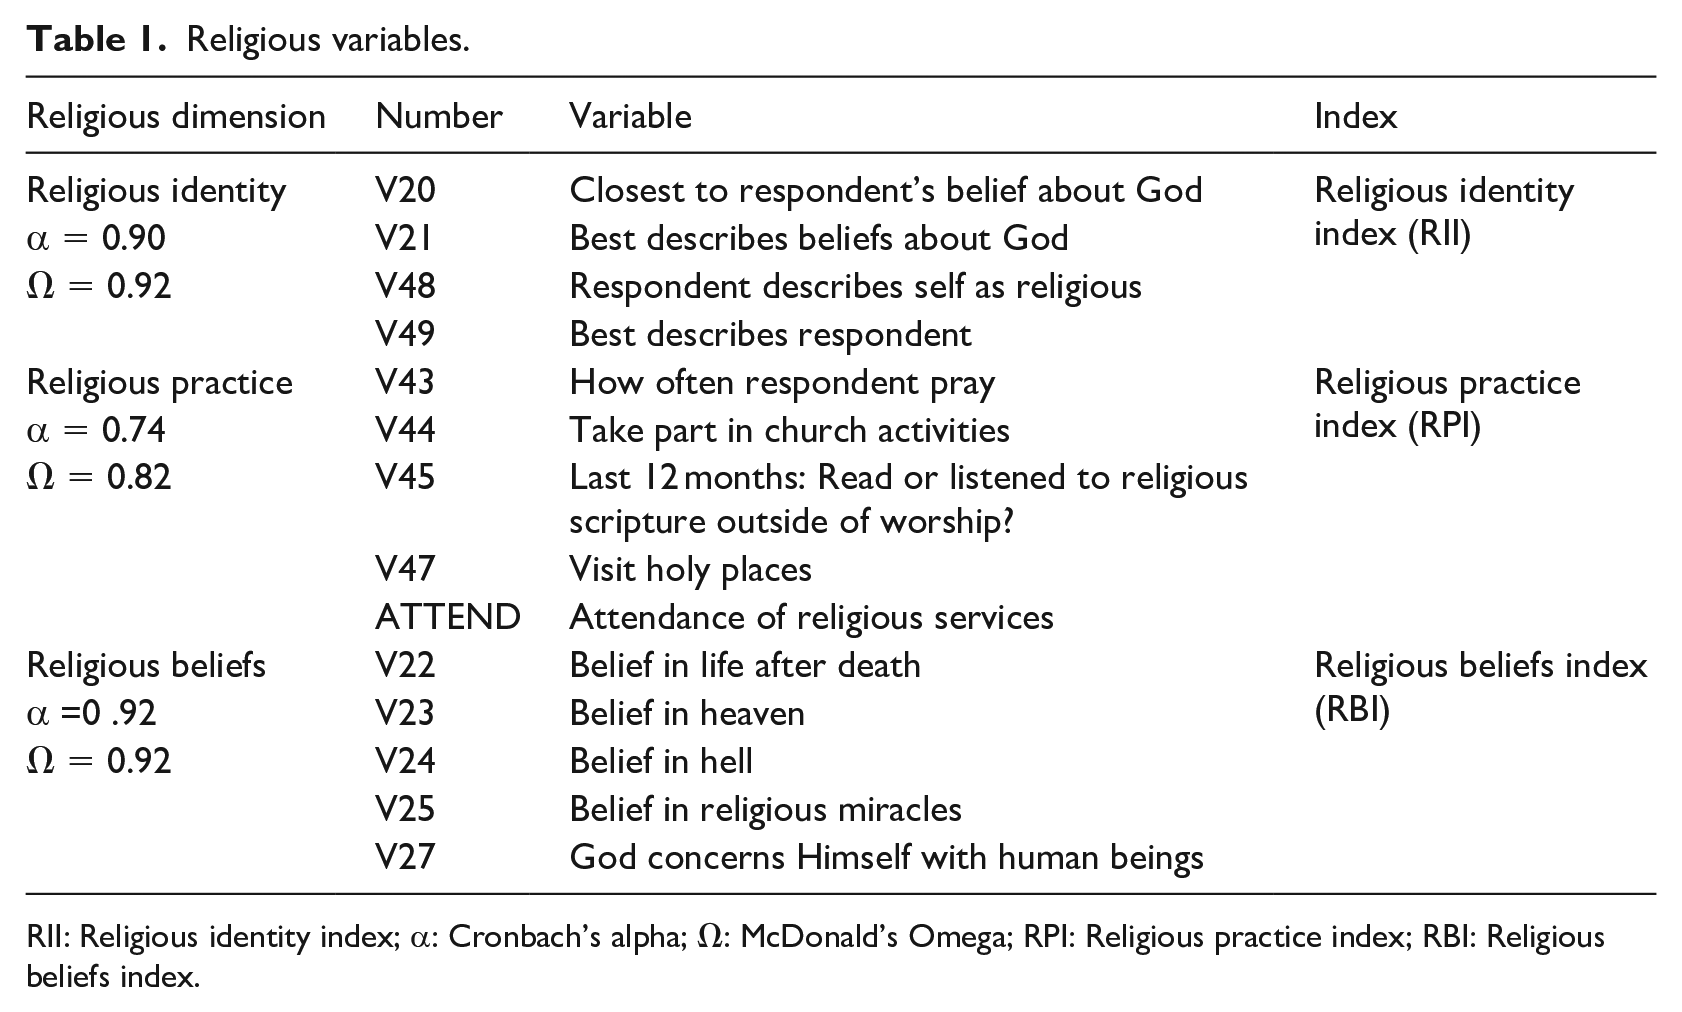
RII: Religious identity index; α: Cronbach’s alpha; Ω: McDonald’s Omega; RPI: Religious practice index; RBI: Religious beliefs index.
Sample in 27 countries and 6 regions.
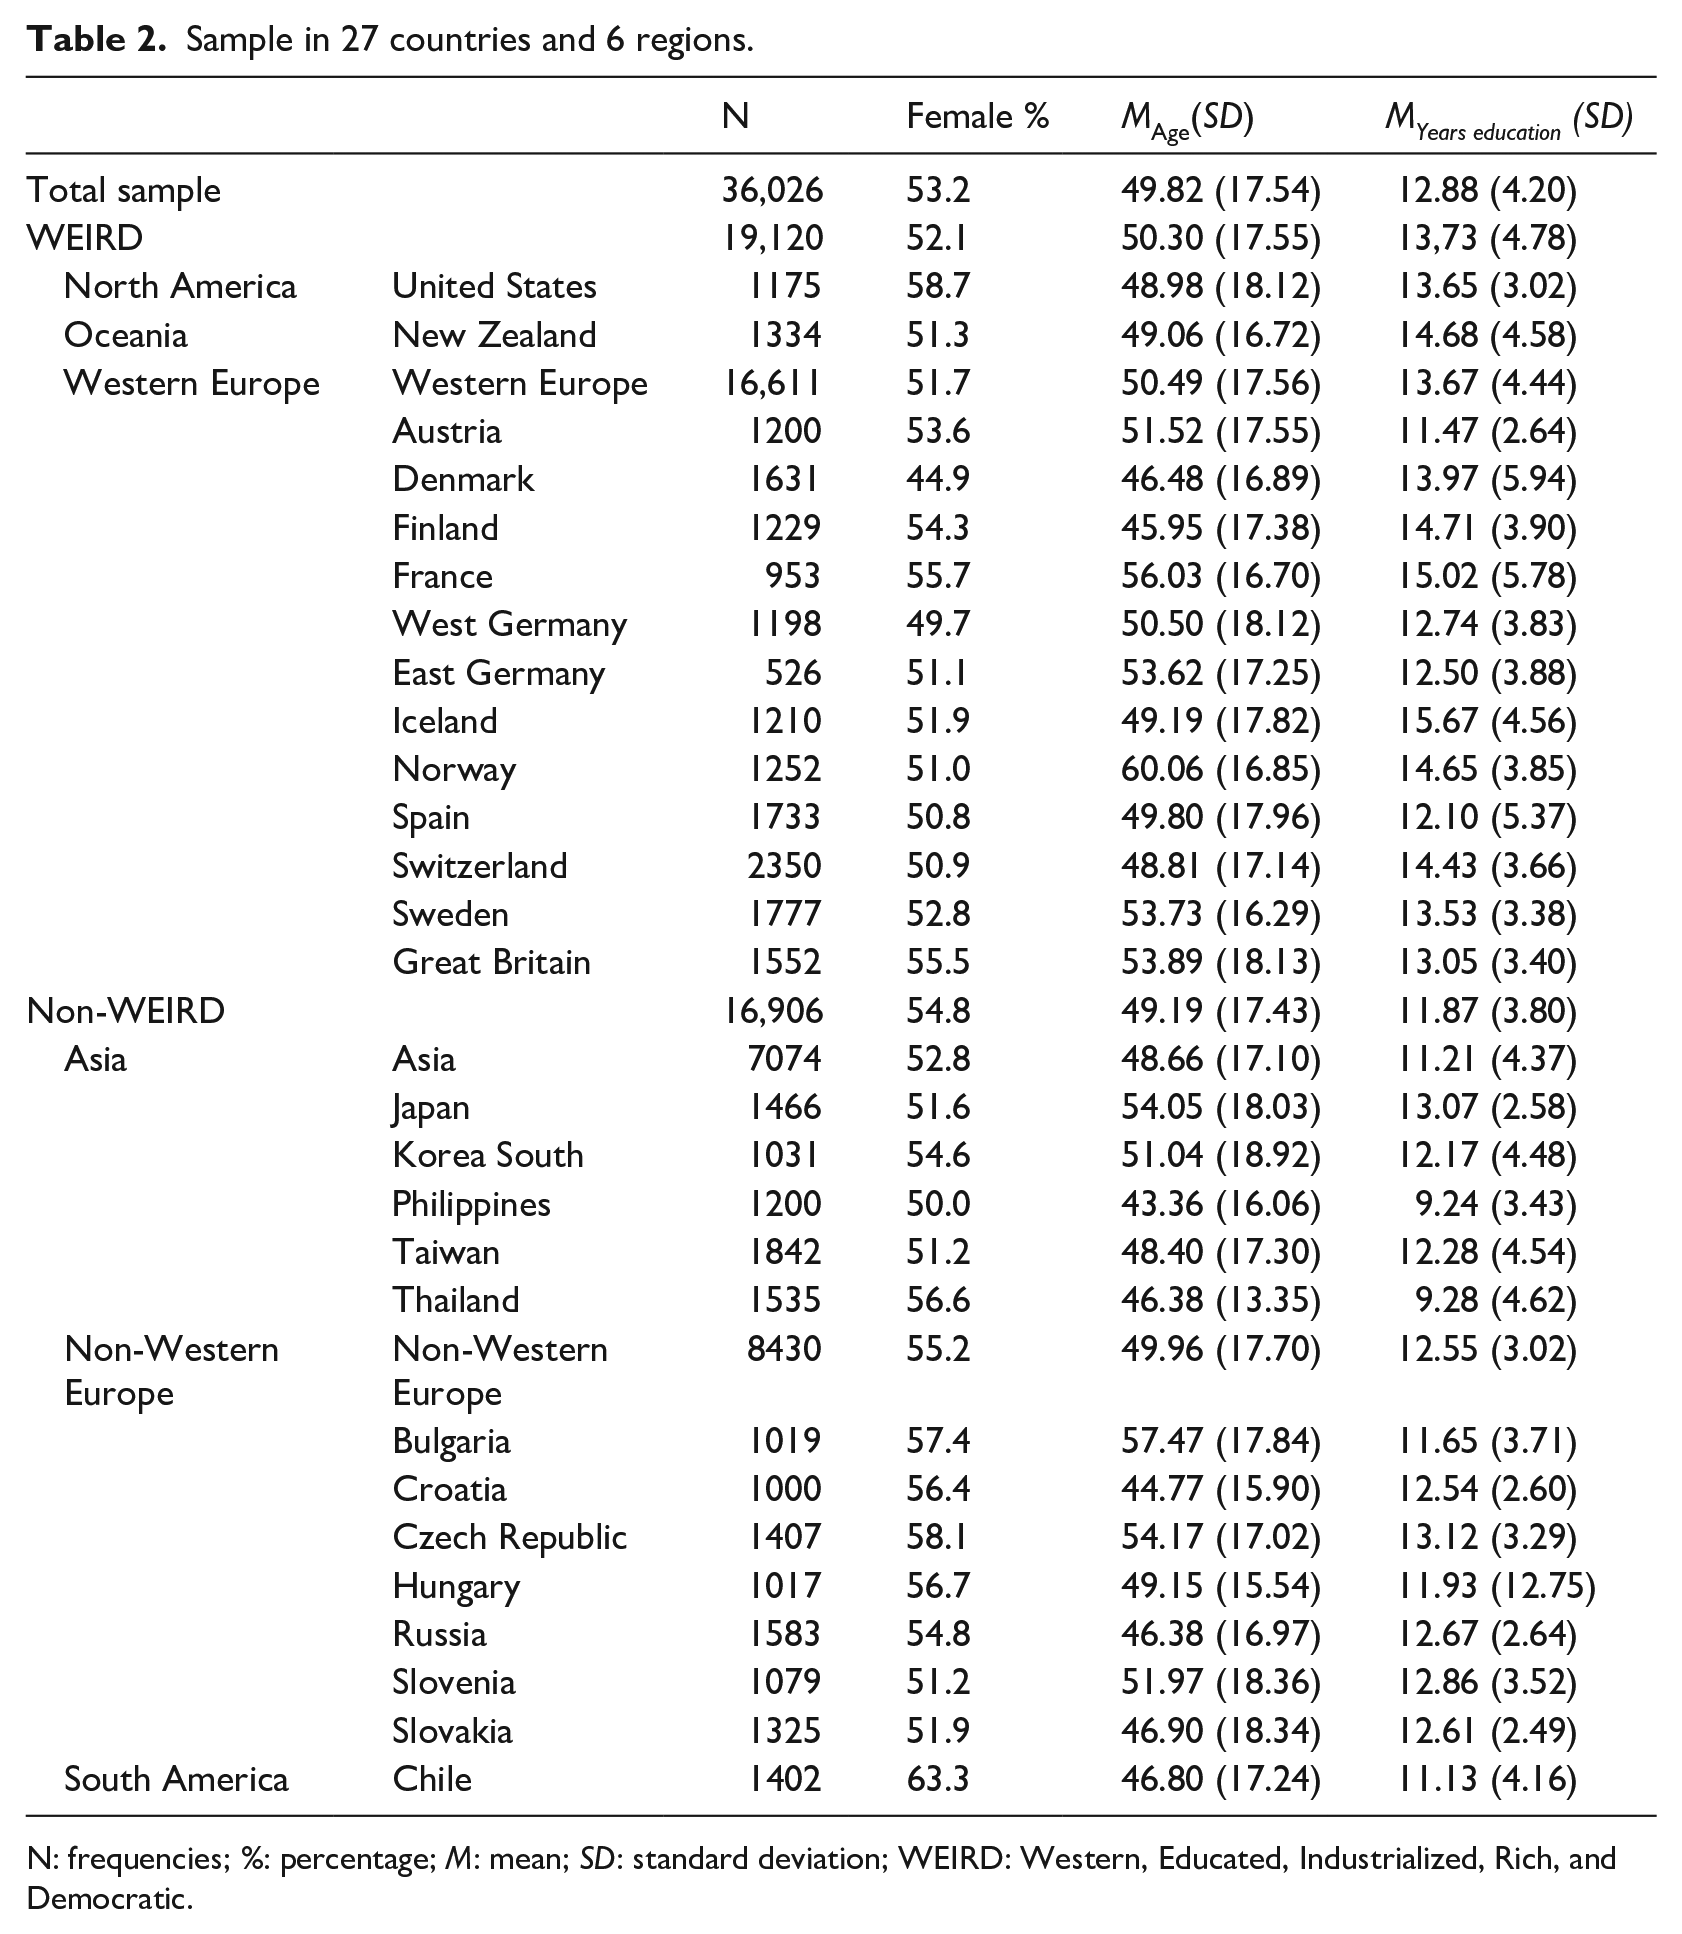
N: frequencies; %: percentage; M: mean; SD: standard deviation; WEIRD: Western, Educated, Industrialized, Rich, and Democratic.
Procedures
After selecting the dimensions to be studied (Table 1), the variables (items) that best fit the first ones were chosen. Then, the variables were recoded considering that a high score would always reflect greater religiosity and religious practice, as well as beliefs translating greater religiosity. After, bivariate correlations were established between the variables of each dimension, with those that related to each other above r = 0.300 being retained. Cronbach’s alpha value was calculated for each dimension, with the minimum acceptable value being 0.70 (Nunnally & Bernstein, 1994). Then, the variables were standardized so that it is possible to group them into indices.
Data analysis
CFA examines whether the hypothesized measurement model fits the data well; Bentler (1990) and Flora and Flake (2017) recommended the following standards: Comparative Fit Index (CFI) ⩾ .90, Tucker Lewis Index (TLI) ⩾ 0.90, the root mean square error of approximation (RMSEA) ⩽ 0.06, and p of Close Fit (PCLOSE) ⩾ 0.050) (Bentler, 1990; Flora and Flake, 2017). To examine measurement invariance, several multigroup CFA were performed (Kline, 2015), through a progressive analytic strategy involving three steps, corresponding to the three invariance conditions of configural, metric, and scalar invariance (Kline, 2015). Configural equivalence means that the factor structure is the same across groups in a multigroup CFA; the metric equivalence assumes that factor loadings are similar across groups; and scalar equivalence states that values/means are also equivalent across groups. Chen (2007) recommended that the values between configural and metric or between metric and scalar should not exceed 0.015 in RMSEA and 0.01 in CFI.
Results
Sample
The sample is mostly female, with an average age of 50 years and an average of education of 13 years. The WEIRD region is significantly older (t(33866, 062) = 5.922; p < 0.000; d = 0.064) and has more years of education (t(33830, 701) = 42.455; p < 0.000; d = 0.457) than the non-WEIRD region (Table 2).
The religious indices structure (H1)
The correlations between religious identity index and religious practice index (r = 0.724), between religious identity index and religious beliefs index (r = 0.785), and between religious practice index and religious beliefs index (r = 0.645) were all positive and statistically significant (p < 0.001).
Table 3 shows the model fit indices estimated through the single factor CFA and intercorrelations between the religious indices for the total sample and for WEIRD and non-WEIRD regions. Also, in Appendix 1, it is possible to find these results in each country, each world region, and WEIRD and non-WEIRD regions. Results generally supported the hypothesized structure. However, to reach acceptable fit indices in all regions some correlations between residuals have been entered until the model fitted the data well. Concerning religious identity index, in almost all countries and regions it has been added a correlation between the residuals of two items (V48 and V49). Relating religious practice index, in several countries and regions it has been added a correlation between the residuals of three items (V43 and V44; and V43 and V45). Regarding religious beliefs index, in almost all countries and regions it has been added a correlation between the residuals of three items (V22 and V27; and V25 and V27). There were few countries, concerning religious identity, in which it was not possible to find good indicators for a model that fitted the data (in gray in Table 2), namely, the United States, New Zealand, Philippines, Taiwan, Thailand, Czech Republic, and Russia. In Philippines, it was not found a good model fit concerning religious practice. H1 was mostly confirmed around the world.
Model fit indices of the three religious dimensions model in several world regions.
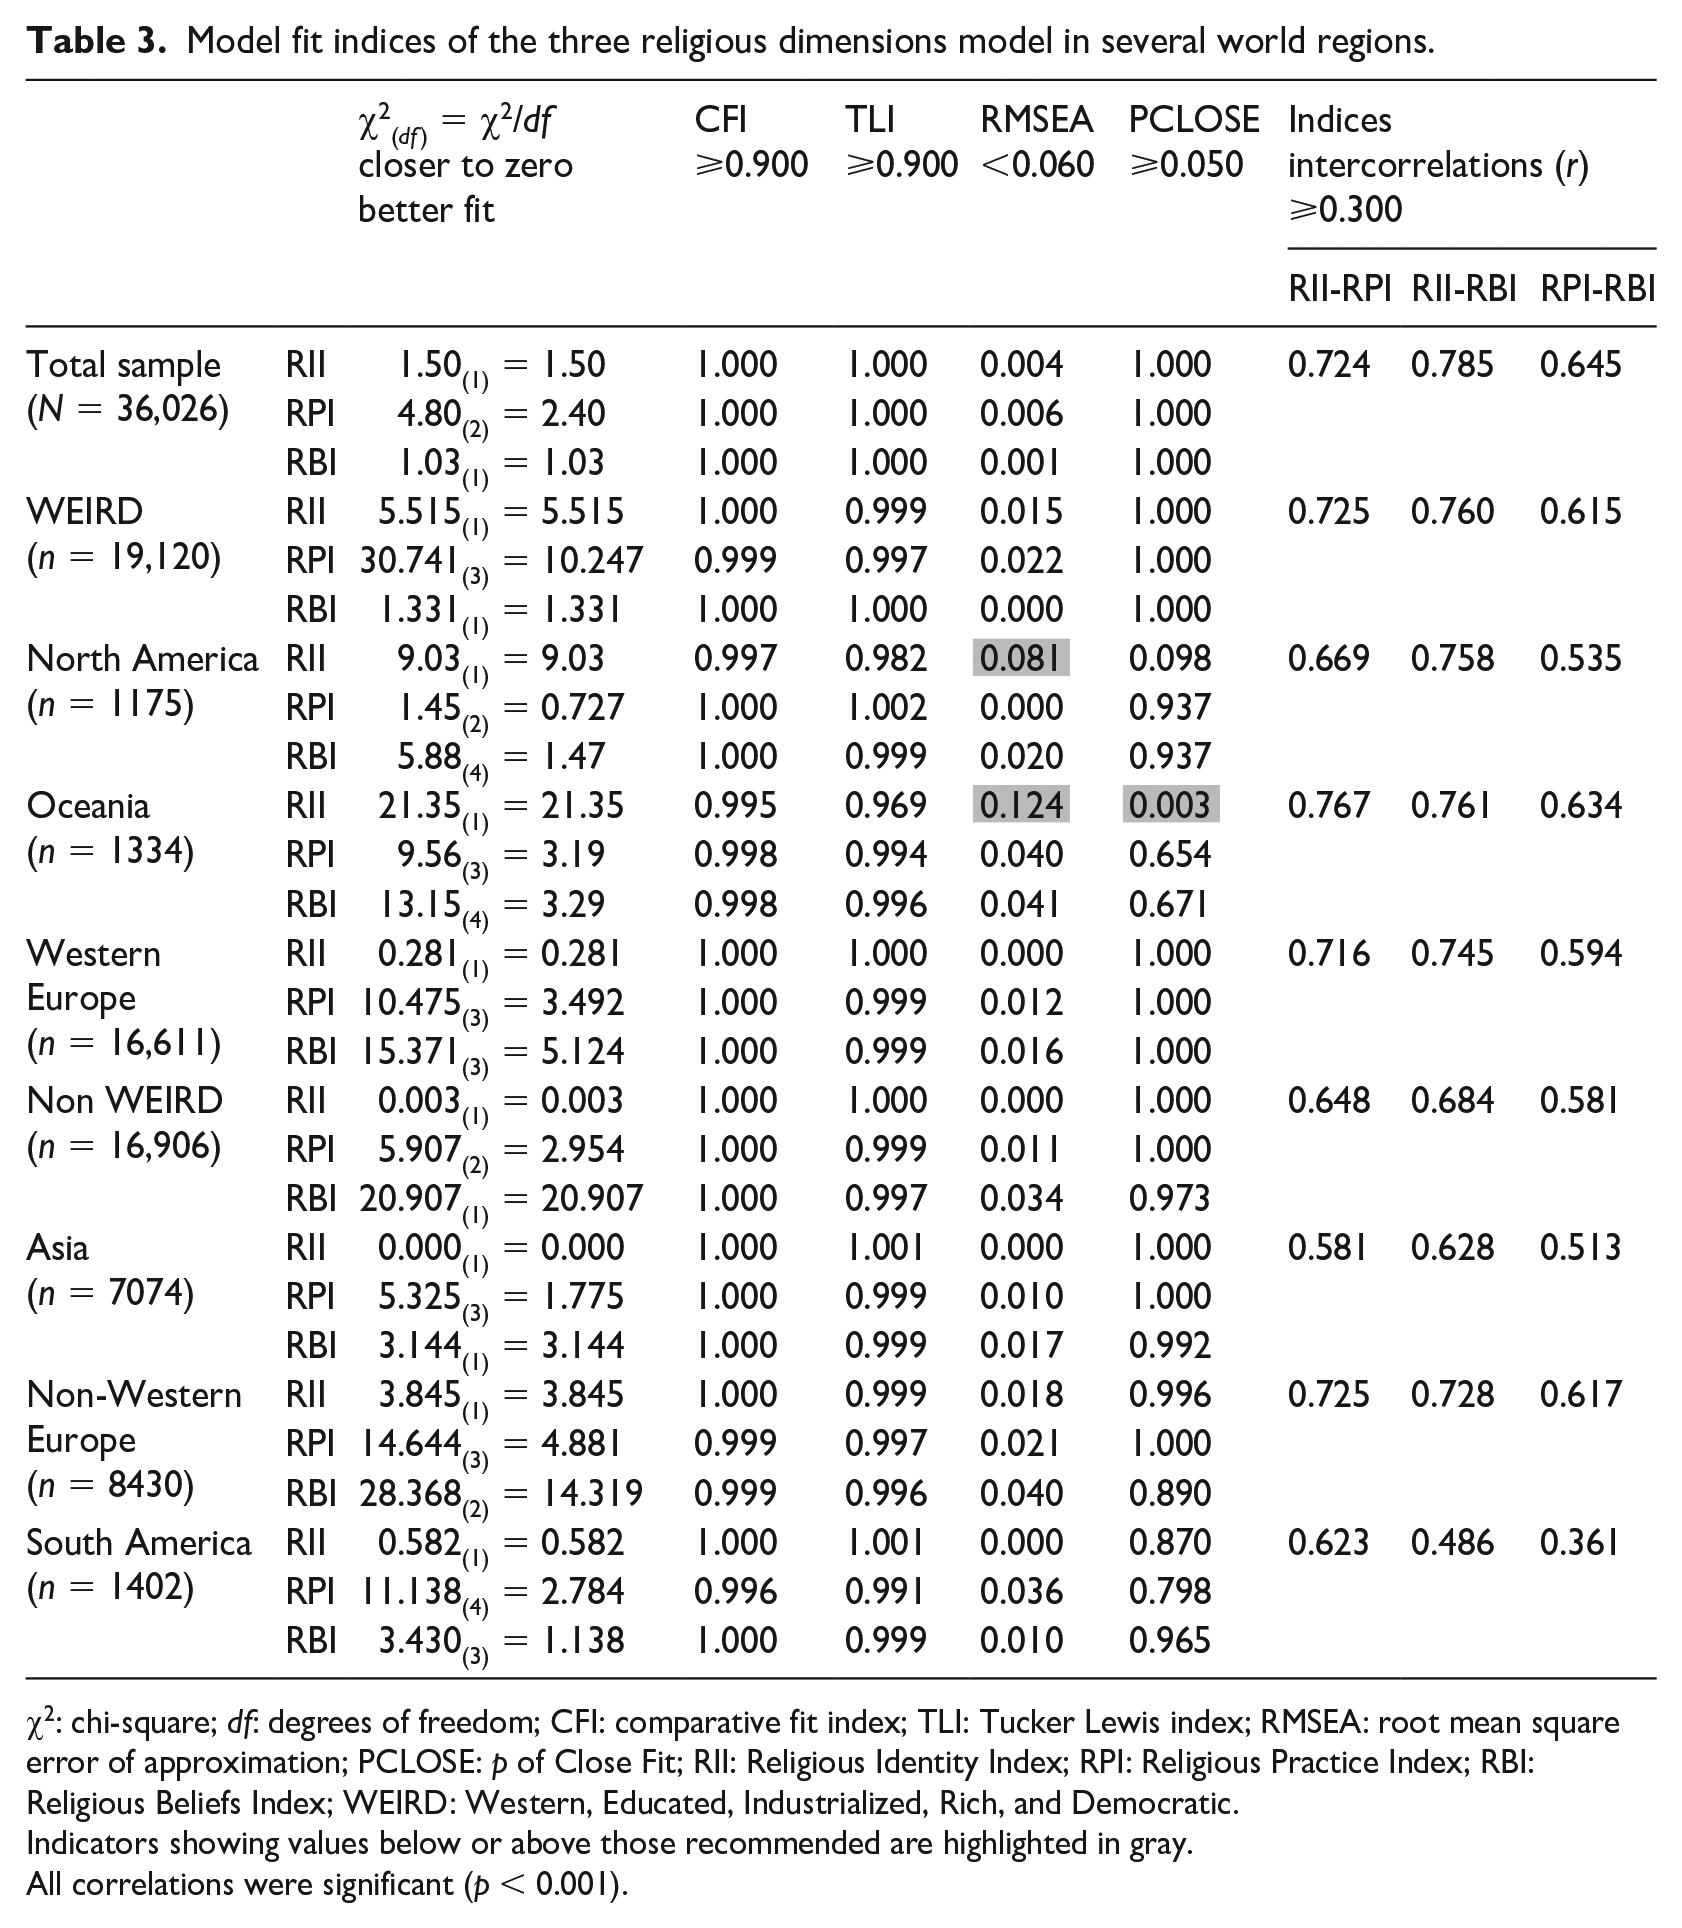
χ2: chi-square; df: degrees of freedom; CFI: comparative fit index; TLI: Tucker Lewis index; RMSEA: root mean square error of approximation; PCLOSE: p of Close Fit; RII: Religious Identity Index; RPI: Religious Practice Index; RBI: Religious Beliefs Index; WEIRD: Western, Educated, Industrialized, Rich, and Democratic.
Indicators showing values below or above those recommended are highlighted in gray.
All correlations were significant (p < 0.001).
Measurement invariance across gender (H2)
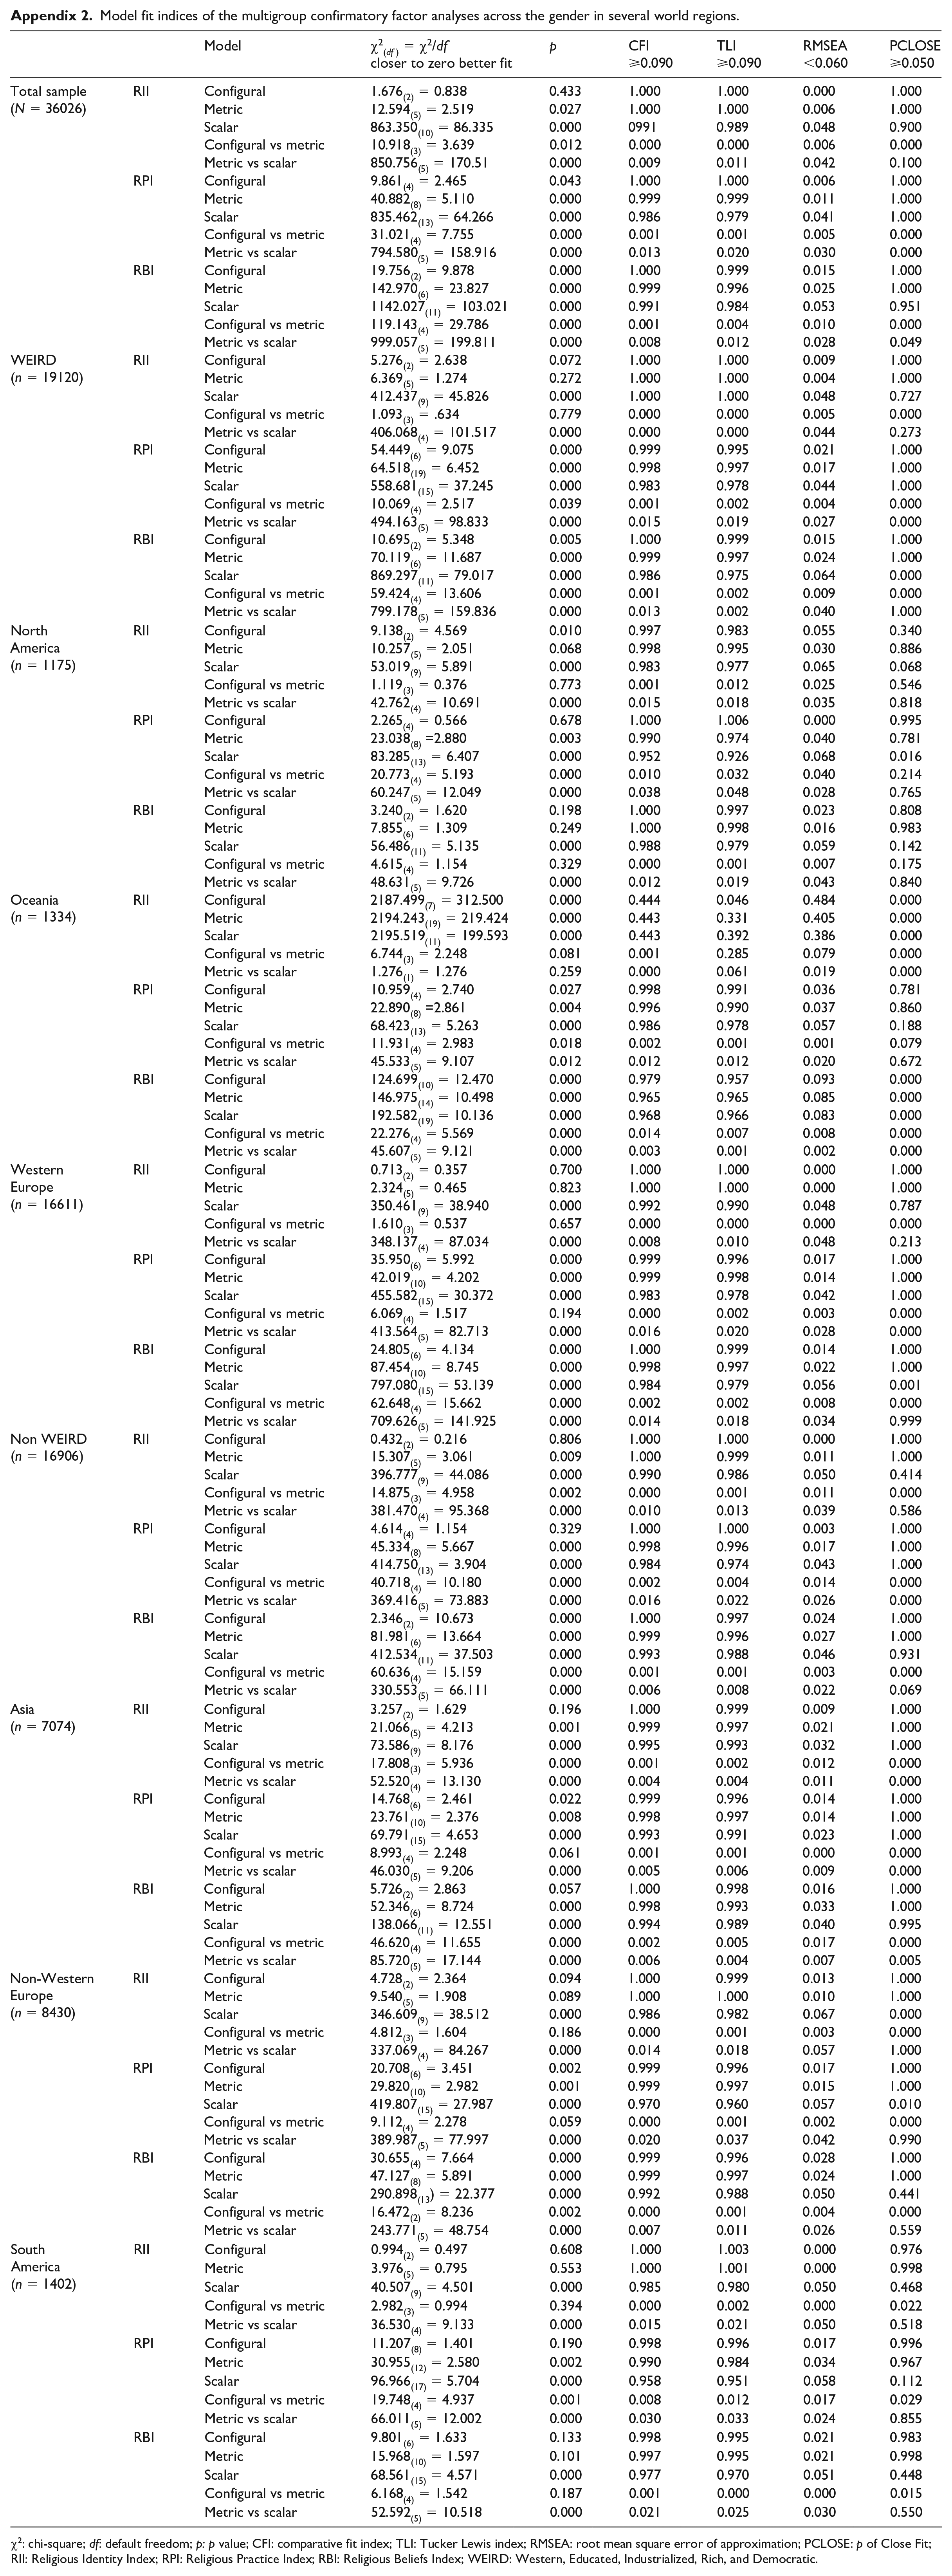
In Table 4, the results of the multigroup confirmatory factor analyses (MGCFA) across men and women in total sample and each of the analyzed regions are presented, as well as invariance measurement. In Appendix 2, it is possible to find these results in each country, each world region, and WEIRD and non-WEIRD regions. The correlations between residuals identified in the assessment of the basic model were maintained. In all the analyzed world regions, it was not found to be full scalar invariance in men and women. It was found to be full metric invariance for WEIRD regions (RII), North America (RII and RBI), Western Europe (RII) and Non-Western Europe (RII), and South America (RII and RBI). Finally, for RII, it was found to be full configural invariance in almost all regions, except North America and Oceania; for RPI, it was found to be full configural only in North America and Non-WEIRD regions; and for RBI, it was found to be full configural only in North America, Asia, and South America. In Table 5, the comparisons of latent means were presented. Women scored significantly higher than men on all three indices in the entire world. H2 was partially confirmed.
Model fit indices of the multigroup confirmatory factor analyses across the gender in total sample and in WEIRD and non-WEIRD regions.
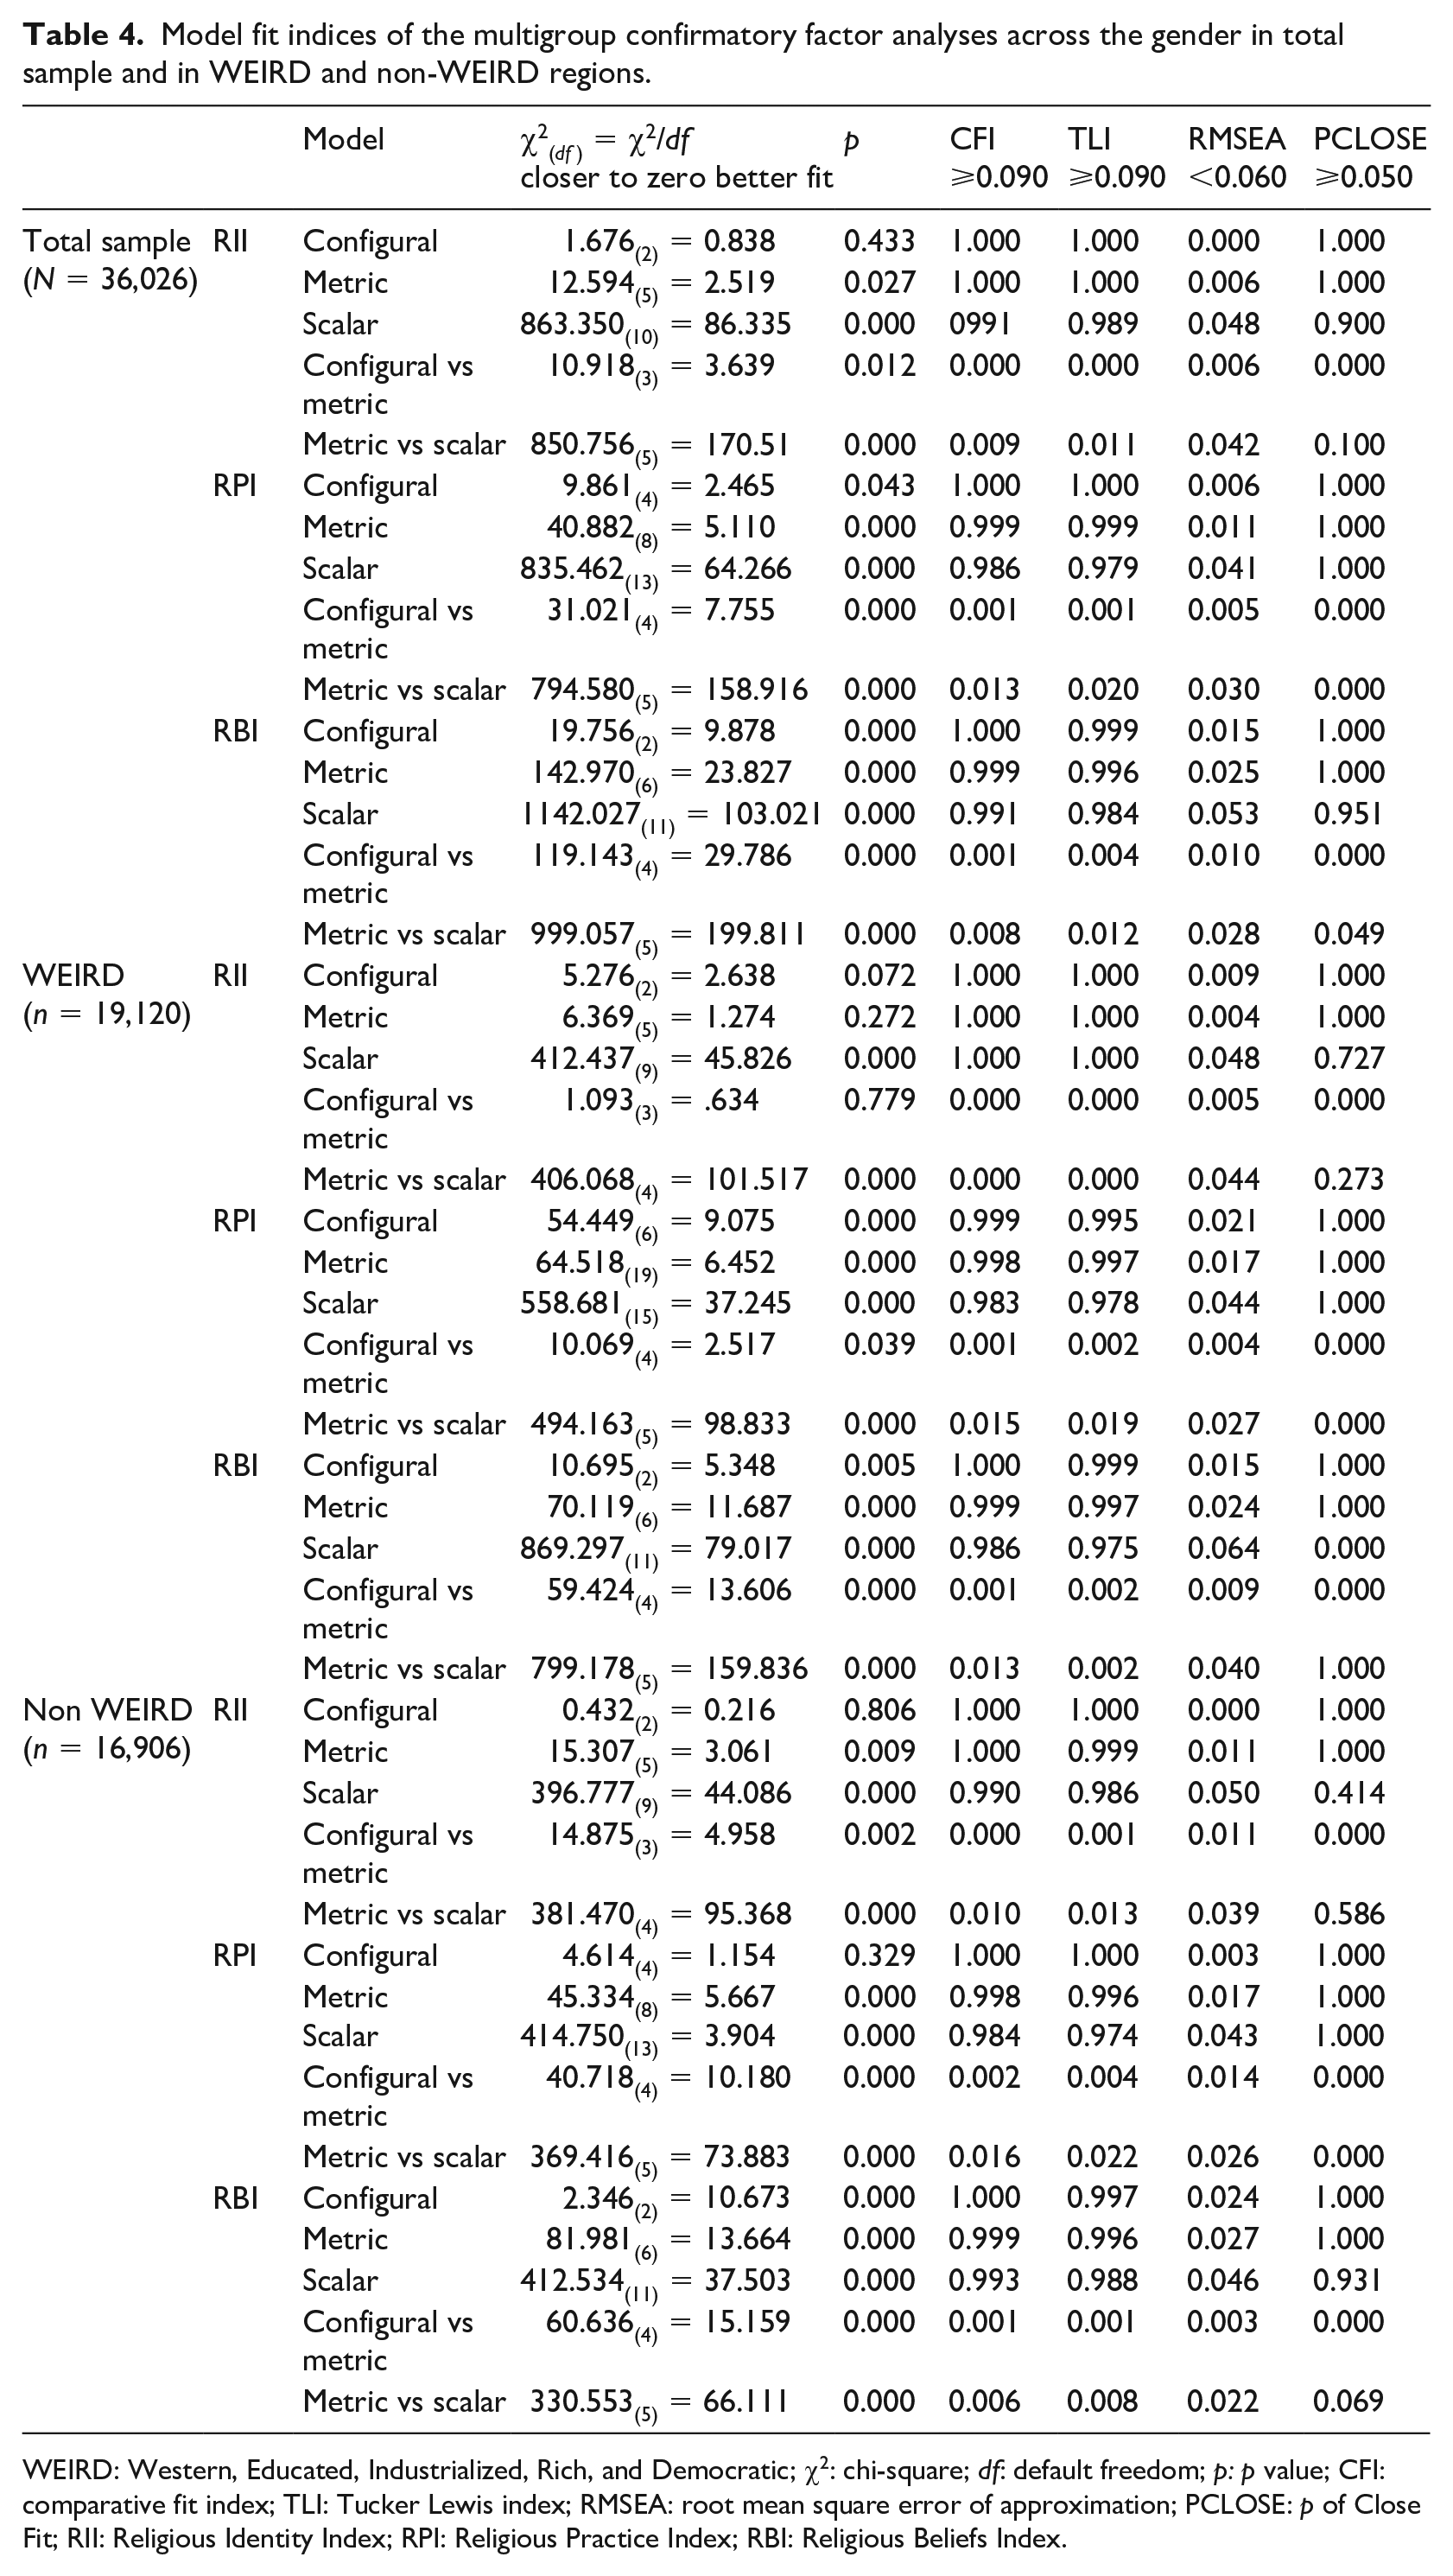
WEIRD: Western, Educated, Industrialized, Rich, and Democratic; χ2: chi-square; df: default freedom; p: p value; CFI: comparative fit index; TLI: Tucker Lewis index; RMSEA: root mean square error of approximation; PCLOSE: p of Close Fit; RII: Religious Identity Index; RPI: Religious Practice Index; RBI: Religious Beliefs Index.
Latent means comparison across the gender.
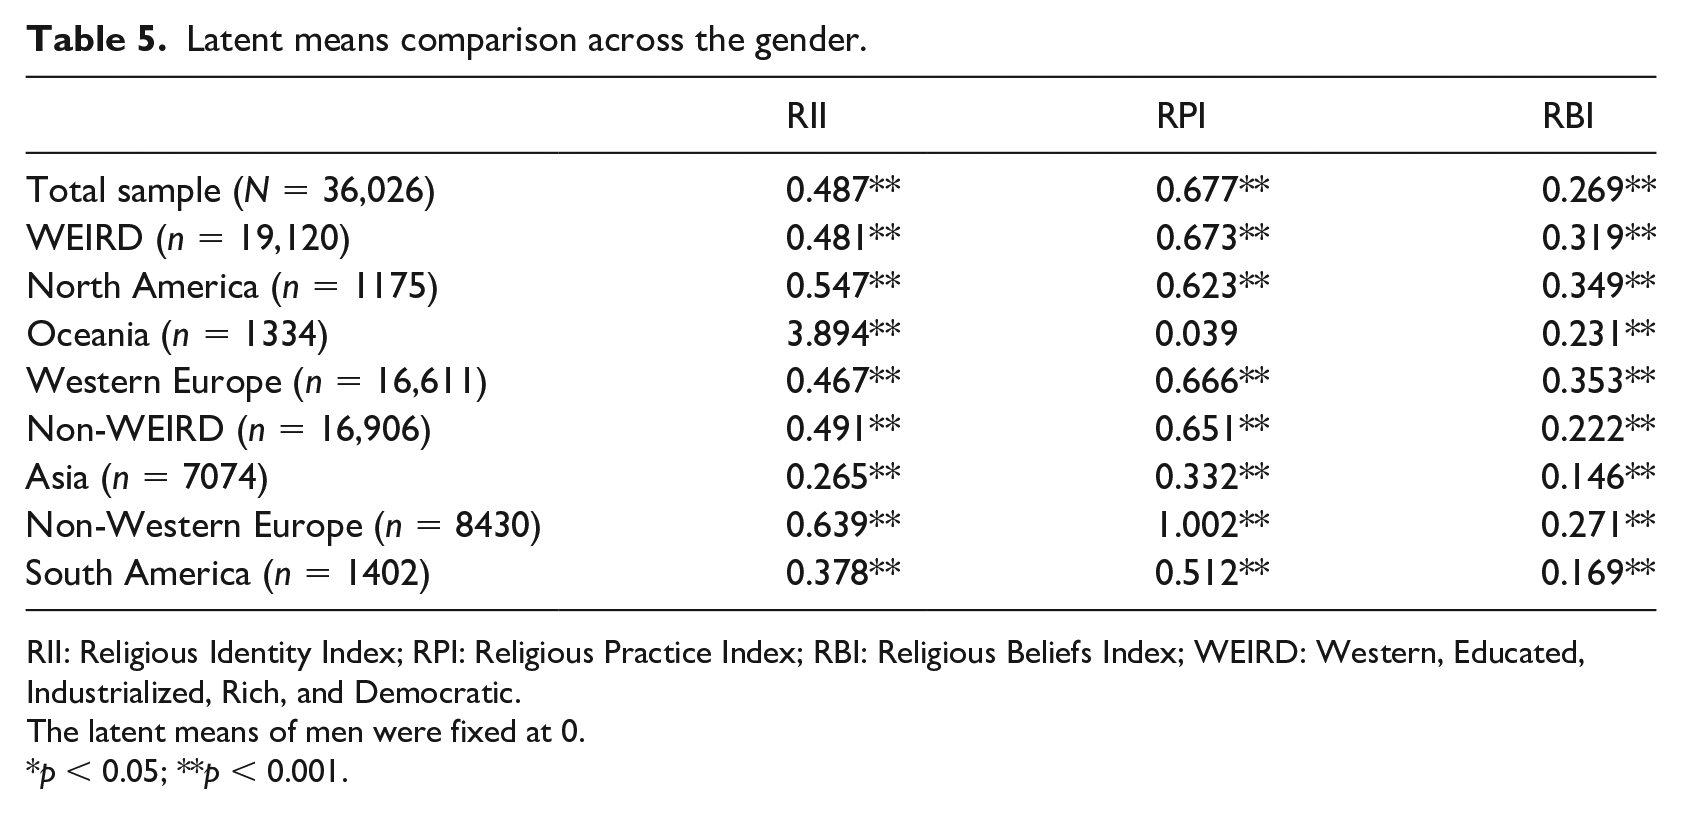
RII: Religious Identity Index; RPI: Religious Practice Index; RBI: Religious Beliefs Index; WEIRD: Western, Educated, Industrialized, Rich, and Democratic.
The latent means of men were fixed at 0.
p < 0.05; **p < 0.001.
Measurement invariance across WEIRD and non-WEIRD world regions (H3)
In Table 6, the results of the MGCFA across WEIRD and Non-WEIRD samples are presented. Overall, it was found to be configural, but not metric or scalar invariance. To identify which parameters were non-invariant in the scalar model, modification indices were scrutinized and one intercept at a time was freed. However, the metric or scalar invariance has never been achieved. The results supported partially H3.
Model fit indices of the multigroup confirmatory factor analyses across WEIRD and non-WEIRD world regions.
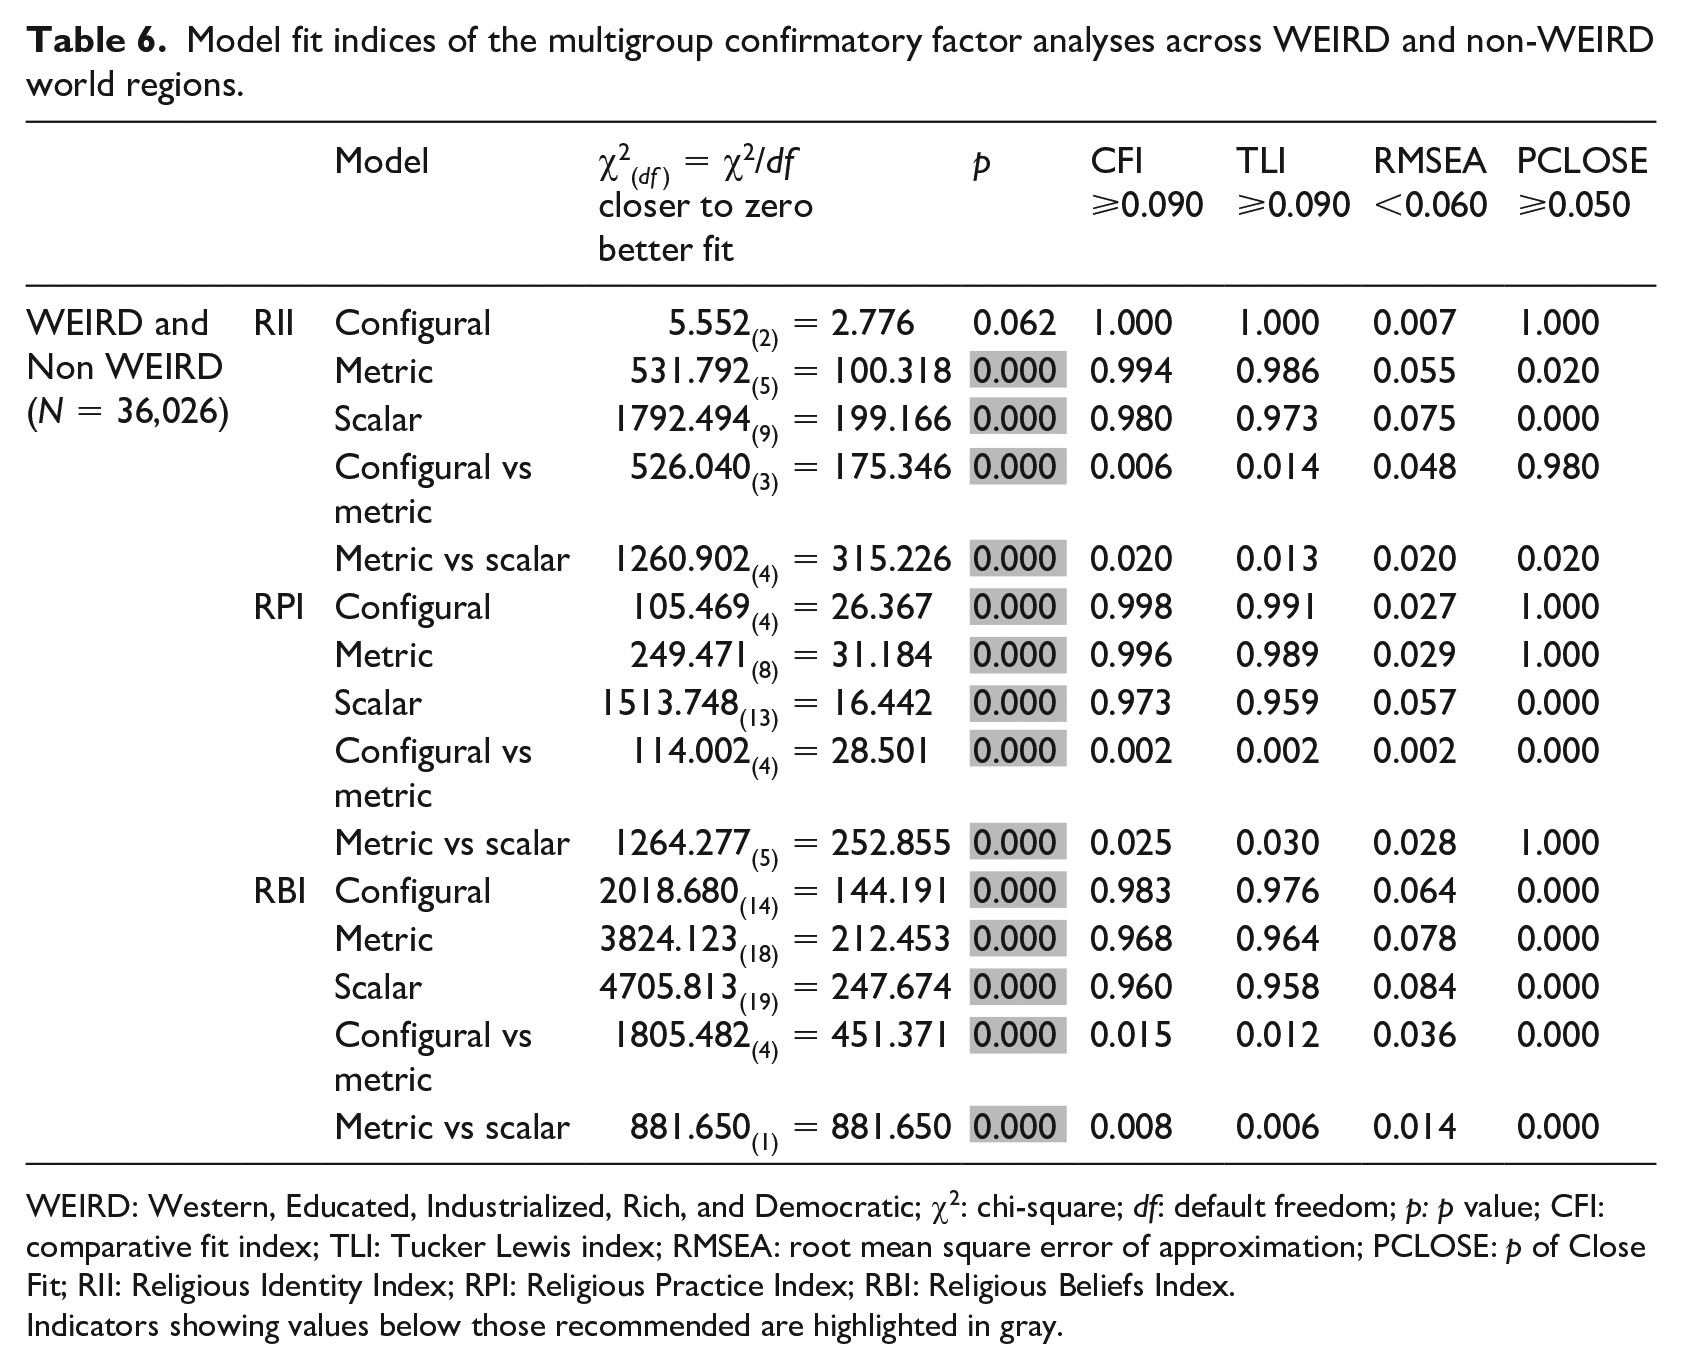
WEIRD: Western, Educated, Industrialized, Rich, and Democratic; χ2: chi-square; df: default freedom; p: p value; CFI: comparative fit index; TLI: Tucker Lewis index; RMSEA: root mean square error of approximation; PCLOSE: p of Close Fit; RII: Religious Identity Index; RPI: Religious Practice Index; RBI: Religious Beliefs Index.
Indicators showing values below those recommended are highlighted in gray.
Discussion
The aim of this study was to evaluate the structure and measurement invariance of religious identity, religious practice, and religious beliefs across cultures in six world regions (Asia, non-Western Europe, North America, Oceania, South America, and Western Europe) and across WEIRD and non-WEIRD world regions.
It has been hypothesized that the three indices would represent adequate fit to the data, through the assessment of a single factor model of CFA. This hypothesis was mostly confirmed around the world. The results generally supported the hypothesized structure However, in order to reach acceptable fit indices in all regions, some correlations between residuals have been entered until the model fitted the data well. These results seem to suggest the universality of the studied concepts. The explanation for this universality includes the fact that religions were an essential cultural element for primitive humans and the practice of imprinting them during early childhood was kept; so, religions became an important part of most civilizations (Musacchio, 2012). In this line, religion can be a bridge between cultures, promoting dialogue and not separation.
There were a few countries, concerning religious identity, in which it was not possible to find good indicators for a model that fitted the data, namely, the United States, New Zealand, Taiwan, Thailand, Czech Republic and Russia. The United States and New Zealand are English-speaking developed countries with strong cultural affinity (Buckingham, 2020; McDonald, 2017). The United States is a stable religious country (more than three-quarters of the population report being religious and 70% are Catholic and there are few fluctuations in these values) (Pew Research Center, 2022); however, the United States is composed of very different states, whether geographically, culturally, or socially, and this may help to understand the difficulty in confirming a universal model of religious identity. In New Zealand, most people that report to be religious are Christian; however, almost half of New Zealanders stated that they have no religion (Van Tongeren et al., 2021). Taiwan has a diversity of religious beliefs and practices, mainly pertaining to the ancient Chinese culture and religion; in spite of this, the Taiwanese people practice a combination of Buddhism and Taoism with a Confucian perspective (Chinese folk religion) (del Castillo et al., 2021). Thailand has one of the highest percentages of Buddhists in the world (95% of the population) (Jeamjitvibool et al., 2022). The Czech Republic is the country with the highest percentage of religiously unaffiliated people in the world; however, Czech nonbelievers are not complete atheists but religious skeptics who “fulfil their spirituality needs outside traditional religion” (Furstova et al., 2021, p. 288). Religion in Russian Federation is diverse, despite the dominance of the Orthodox religion; it includes Orthodox, Islam, Buddhism, atheism, own faith, Protestantism, Christianity (but not Orthodox, Catholic, or Protestant), Judaism, Eastern religions and spiritual practices, Pentecostalism, paganism, old believers, Catholicism, and so on (Bufetova et al., 2020). These diversities within these countries explain the difficulty in finding a common matrix with regard to religious identity. In Philippines, it was not found to be a good model fit concerning religious practice. Philippines is one of two Christian countries in Southeast Asia with mainly a Roman Catholic population being between two worlds: the Spanish Christianity (past) and the “merging of eastern and western religious mindsets running parallel with secular ideas” (Baring, 2018, p. 1) and this may explain the inconsistency of religious practice. In spite of this, H1 was mostly confirmed around the world, which is surprising, because the items are largely invariant across countries given that the faith traditions in these nations vary widely. In fact, religion is vastly different in Asia than in the West yet, the results suggest that, for the most part, the items are invariant (i.e. the underlying meaning of the items is the same). A possible explanation for these results is related to the way in which religion is personally experienced, regardless of context. For example, Ferran (2019) suggested that religious emotions are a form of religious experience. According to Ferran (2019), the religious character of the emotions is defined by their material objects (God, deities, etc.), by their values (the holy, the sacred, the divine, etc.), and by their unique qualitative character in the way they are felt. Another explanation for these invariant results across countries is related to the cultural context(s) of these analyses: the authors of the original items of the ISSP are from WEIRD countries, which may shape the questions they ask. In turn, this may explain why a greater model fit exists in WEIRD countries versus non-WEIRD countries, being the great example of this the case the Philippines one (discussed above).
It was hypothesized that this structure was invariant across men and women, with the latter scoring higher on all indices. Women scored significantly higher than men on all three indices in the entire world, but this hypothesis was partially confirmed because, in all the analyzed world regions, no full scalar invariance in men and women were found. It was found to be full metric invariance for WEIRD regions (RII), North America (RII and RBI), Western Europe (RII) and Non-Western Europe (RII), and South America (RII and RBI). Finally, for RII, it was found to be full configural invariance in almost all regions, except North America and Oceania; for RPI, it was found to be full configural invariance only in North America and Non-WEIRD regions; and for RBI, it was found to be full configural only in North America, Asia, and South America. These results are quite close to those stated by Dimitrova and del Carmen Domínguez Espinosa (2016) who found that gender comparisons showed that females score significantly higher on four religiousness dimensions than males; and Lemos et al. (2019) that found metric and scalar invariance across gender, age, educational degree, and religious (un)affiliation; however, in the measurement invariance across the countries, the criteria for metric invariance were met for 23 countries, and partial scalar invariance was accepted for 14 countries only. Also, Meuleman and Billiet (2011) found that religious involvement met the criteria for partial metric invariance for 25 countries, and partial scalar invariance for 21 out of 25 countries studied. These results are not in line with Kumar et al. (2021), who found strong invariance across gender concerning religiousness as a universal four-dimensional structure (believing, bonding, behaving, and belonging). Finally, Sullins (2006) stated that the female advantage in religiousness is not universal, which lies not in a search for universality, but in the acceptance of complexity.
It was also hypothesized that this structure was invariant across WEIRD and non-WEIRD world regions. This hypothesis was partially confirmed because it was found to be configural, but not metric or scalar invariance. These results can possibly be explained by the progressive, albeit asymmetric, secularization of the world (Hammond, 1988), by the progressive uselessness of religious belief as an expression of evolutionary adaptation (Szocik, 2017), by the progressive overlap of science over religion (Liquin et al., 2020), or by cultural, educational, social, and economic differences and their relationship with religion (Fox, 2020). In fact, Solt et al. (2011) stated that “greater inequality yields more religiosity by increasing the degree to which wealthy people are attracted to religion and have the power to shape the attitudes and beliefs of those with fewer means” (p. 447). Also, Zheng et al. (2020) found that people’s individual income and national gross domestic product have significant moderating effects on the relationship between religious practice and subjective wellbeing. Some disenchantment with religion, namely, with the institutions that represent it, as well as some criticism toward it, may also be at the origin of the search for new forms of spirituality (van Nieuwkerk, 2021).
Saroglou and Cohen (2013) examined how cultural factors (socioeconomic and sociocultural factors; cultural psychological differences in the cognitive, emotional, social, and moral domains; different theologies; and broad cultural dimensions such as collectivism versus individualism) shape religion and can explain interreligious differences. Also, Cohen et al. (2016) studied how religions and cultures affect each other, how diverse cultural groups are, and how confounded country and religious identities are, raising the question concerning the different meaning of religion in Western and Eastern religions. These differences could explain the difficulty in finding the invariance of religious identity, religious practice, and religious beliefs between different parts of the world.
In conclusion, and in line with Bechert (2018) and Meuleman and Billiet (2011), it is assumed that it is very difficult to establish full invariance across countries with a set of variables measuring religiosity; however, partial homogeneity could be achieved. These results may suggest that although social, economic, cultural, political, and individual issues may condition the way we live religion, there is much in common as to its relevance and essence. Probably, religion will be the only construct that we will study in the whole world in which we find this level of invariance, even if not total (Aditya et al., 2021; Lemos et al., 2019; Remizova et al., 2022). “(. . .) if universality is a process and not a given a fact, then we should talk about “universalizability” and not about “universality.” This term indicates the way in which the particularity of one’s position is not immediately viewed as universal or adhering to a universal dimension, but is, instead, prompted to realize itself in a universal way” (Fabris, 2016, p. 206). According to Ricoeur, the phenomenological question underlying the issue of diversity versus universality of religion, relates to the meaning of a religious phenomenon, more specifically, what meaning means (Dahl, 2019). Also, Winchester and Pagis (2021) proposed the concept somatic inversions, that are experiences in which “dimensions of human embodiment that usually remain in the tacit background of action and perception are brought to the experiential foreground of awareness” (p. 2) through practices such as fasting, prayer, meditation, pilgrimage, faith healing, self-flagellation, and so on; these experiences of inversion enable and encourage attributions of religious significance.
Despite these conclusions, this study includes some limitations that must be acknowledged. In a first moment, we have to consider that these self-report and cross-sectional data that do not allow us to track individuals during time are more susceptible to social desirability. Also, in some areas of the world included only one country was stated (e.g., North America included only the United States), limiting the comparison across WEIRD and non-WEIRD world regions.
Future studies
Future studies should contemplate broader samples, not in number but in differentiation, for example, samples of people belonging to different religions, not just monotheistic religions like Christianity, Islam, and Judaism, but also polytheistic religions as Hinduism and Neopaganism; this is, samples not just at country level (as the present study) but among groups with shared beliefs regardless of geographical boundaries. Future studies should also contemplate different moments in time, like longitudinal studies, that would allow us to understand the dynamics of religiosity and the direction in which changes take place, such as studies lasting 5 years, during which people were evaluated three times, in different age groups, to understand at what point in life someone is more likely to change their religious orientation or consolidate it. In order to obtain a holistic perspective of human development, also the inclusion of new indicators, as personality or mental health, could be important in future studies; it would be interesting to understand how subjective health perception and objective health contribute to reducing or consolidating religious commitment, as well as the personality characteristics that predict greater or lesser religiosity. Despite the logistical difficulties, future studies with qualitative or mixed methods, with participants representative of different regions of the world, would allow us to know more in detail these variables, something that quantitative studies cannot allow; research methods as focus groups (that provide more nuanced and natural feedback than individual interviews and are easier to organize than experiments or large-scale surveys) or naturalistic observation (researchers record the behaviors of the research subjects in real world settings) could allow a deeper understanding of the religious phenomenon. According to Nielsen (2015), “it will be difficult to learn causal knowledge about the effects of religion from experiments because there are serious ethical problems with setting the religiosity of subjects to levels that the subjects do not choose” (p. 1). However, Nielsen (2015) stated that experiments like measurement manipulations (experimental interventions to measure aspects of religiosity or characteristic of a religious person) will be more ethical than those like change manipulations (experimental interventions with an attempt to set some aspect of a subject’s religiosity to a level that it would otherwise not attain). Finally, future studies cannot ignore the development of the neuroscience of religion giving greater attention to the new tools and findings. It is worth highlighting the need to explore the neuro correlates of religiosity, not only at the individual level but also culturally. According to Klemm (2022), neuroscience provides no test for how the universe was created nor for the existence of a creator God, but it is a major source of medical and psychological interventions that improve the quality of life at individual and social levels. (p. 236)
Thus, the current findings change the way someone in any given country or tradition live their life.
Footnotes
Appendix
Model fit indices of the multigroup confirmatory factor analyses across the gender in several world regions.
| Model | χ2(df ) = χ2/df
|
p | CFI |
TLI |
RMSEA |
PCLOSE |
||
|---|---|---|---|---|---|---|---|---|
| Total sample (N = 36026) |
RII | Configural | 1.676(2) = 0.838 | 0.433 | 1.000 | 1.000 | 0.000 | 1.000 |
| Metric | 12.594(5) = 2.519 | 0.027 | 1.000 | 1.000 | 0.006 | 1.000 | ||
| Scalar | 863.350(10) = 86.335 | 0.000 | 0991 | 0.989 | 0.048 | 0.900 | ||
| Configural vs metric | 10.918(3) = 3.639 | 0.012 | 0.000 | 0.000 | 0.006 | 0.000 | ||
| Metric vs scalar | 850.756(5) = 170.51 | 0.000 | 0.009 | 0.011 | 0.042 | 0.100 | ||
| RPI | Configural | 9.861(4) = 2.465 | 0.043 | 1.000 | 1.000 | 0.006 | 1.000 | |
| Metric | 40.882(8) = 5.110 | 0.000 | 0.999 | 0.999 | 0.011 | 1.000 | ||
| Scalar | 835.462(13) = 64.266 | 0.000 | 0.986 | 0.979 | 0.041 | 1.000 | ||
| Configural vs metric | 31.021(4) = 7.755 | 0.000 | 0.001 | 0.001 | 0.005 | 0.000 | ||
| Metric vs scalar | 794.580(5) = 158.916 | 0.000 | 0.013 | 0.020 | 0.030 | 0.000 | ||
| RBI | Configural | 19.756(2) = 9.878 | 0.000 | 1.000 | 0.999 | 0.015 | 1.000 | |
| Metric | 142.970(6) = 23.827 | 0.000 | 0.999 | 0.996 | 0.025 | 1.000 | ||
| Scalar | 1142.027(11) = 103.021 | 0.000 | 0.991 | 0.984 | 0.053 | 0.951 | ||
| Configural vs metric | 119.143(4) = 29.786 | 0.000 | 0.001 | 0.004 | 0.010 | 0.000 | ||
| Metric vs scalar | 999.057(5) = 199.811 | 0.000 | 0.008 | 0.012 | 0.028 | 0.049 | ||
| WEIRD (n = 19120) |
RII | Configural | 5.276(2) = 2.638 | 0.072 | 1.000 | 1.000 | 0.009 | 1.000 |
| Metric | 6.369(5) = 1.274 | 0.272 | 1.000 | 1.000 | 0.004 | 1.000 | ||
| Scalar | 412.437(9) = 45.826 | 0.000 | 1.000 | 1.000 | 0.048 | 0.727 | ||
| Configural vs metric | 1.093(3) = .634 | 0.779 | 0.000 | 0.000 | 0.005 | 0.000 | ||
| Metric vs scalar | 406.068(4) = 101.517 | 0.000 | 0.000 | 0.000 | 0.044 | 0.273 | ||
| RPI | Configural | 54.449(6) = 9.075 | 0.000 | 0.999 | 0.995 | 0.021 | 1.000 | |
| Metric | 64.518(19) = 6.452 | 0.000 | 0.998 | 0.997 | 0.017 | 1.000 | ||
| Scalar | 558.681(15) = 37.245 | 0.000 | 0.983 | 0.978 | 0.044 | 1.000 | ||
| Configural vs metric | 10.069(4) = 2.517 | 0.039 | 0.001 | 0.002 | 0.004 | 0.000 | ||
| Metric vs scalar | 494.163(5) = 98.833 | 0.000 | 0.015 | 0.019 | 0.027 | 0.000 | ||
| RBI | Configural | 10.695(2) = 5.348 | 0.005 | 1.000 | 0.999 | 0.015 | 1.000 | |
| Metric | 70.119(6) = 11.687 | 0.000 | 0.999 | 0.997 | 0.024 | 1.000 | ||
| Scalar | 869.297(11) = 79.017 | 0.000 | 0.986 | 0.975 | 0.064 | 0.000 | ||
| Configural vs metric | 59.424(4) = 13.606 | 0.000 | 0.001 | 0.002 | 0.009 | 0.000 | ||
| Metric vs scalar | 799.178(5) = 159.836 | 0.000 | 0.013 | 0.002 | 0.040 | 1.000 | ||
| North America (n = 1175) |
RII | Configural | 9.138(2) = 4.569 | 0.010 | 0.997 | 0.983 | 0.055 | 0.340 |
| Metric | 10.257(5) = 2.051 | 0.068 | 0.998 | 0.995 | 0.030 | 0.886 | ||
| Scalar | 53.019(9) = 5.891 | 0.000 | 0.983 | 0.977 | 0.065 | 0.068 | ||
| Configural vs metric | 1.119(3) = 0.376 | 0.773 | 0.001 | 0.012 | 0.025 | 0.546 | ||
| Metric vs scalar | 42.762(4) = 10.691 | 0.000 | 0.015 | 0.018 | 0.035 | 0.818 | ||
| RPI | Configural | 2.265(4) = 0.566 | 0.678 | 1.000 | 1.006 | 0.000 | 0.995 | |
| Metric | 23.038(8) =2.880 | 0.003 | 0.990 | 0.974 | 0.040 | 0.781 | ||
| Scalar | 83.285(13) = 6.407 | 0.000 | 0.952 | 0.926 | 0.068 | 0.016 | ||
| Configural vs metric | 20.773(4) = 5.193 | 0.000 | 0.010 | 0.032 | 0.040 | 0.214 | ||
| Metric vs scalar | 60.247(5) = 12.049 | 0.000 | 0.038 | 0.048 | 0.028 | 0.765 | ||
| RBI | Configural | 3.240(2) = 1.620 | 0.198 | 1.000 | 0.997 | 0.023 | 0.808 | |
| Metric | 7.855(6) = 1.309 | 0.249 | 1.000 | 0.998 | 0.016 | 0.983 | ||
| Scalar | 56.486(11) = 5.135 | 0.000 | 0.988 | 0.979 | 0.059 | 0.142 | ||
| Configural vs metric | 4.615(4) = 1.154 | 0.329 | 0.000 | 0.001 | 0.007 | 0.175 | ||
| Metric vs scalar | 48.631(5) = 9.726 | 0.000 | 0.012 | 0.019 | 0.043 | 0.840 | ||
| Oceania (n = 1334) |
RII | Configural | 2187.499(7) = 312.500 | 0.000 | 0.444 | 0.046 | 0.484 | 0.000 |
| Metric | 2194.243(19) = 219.424 | 0.000 | 0.443 | 0.331 | 0.405 | 0.000 | ||
| Scalar | 2195.519(11) = 199.593 | 0.000 | 0.443 | 0.392 | 0.386 | 0.000 | ||
| Configural vs metric | 6.744(3) = 2.248 | 0.081 | 0.001 | 0.285 | 0.079 | 0.000 | ||
| Metric vs scalar | 1.276(1) = 1.276 | 0.259 | 0.000 | 0.061 | 0.019 | 0.000 | ||
| RPI | Configural | 10.959(4) = 2.740 | 0.027 | 0.998 | 0.991 | 0.036 | 0.781 | |
| Metric | 22.890(8) =2.861 | 0.004 | 0.996 | 0.990 | 0.037 | 0.860 | ||
| Scalar | 68.423(13) = 5.263 | 0.000 | 0.986 | 0.978 | 0.057 | 0.188 | ||
| Configural vs metric | 11.931(4) = 2.983 | 0.018 | 0.002 | 0.001 | 0.001 | 0.079 | ||
| Metric vs scalar | 45.533(5) = 9.107 | 0.012 | 0.012 | 0.012 | 0.020 | 0.672 | ||
| RBI | Configural | 124.699(10) = 12.470 | 0.000 | 0.979 | 0.957 | 0.093 | 0.000 | |
| Metric | 146.975(14) = 10.498 | 0.000 | 0.965 | 0.965 | 0.085 | 0.000 | ||
| Scalar | 192.582(19) = 10.136 | 0.000 | 0.968 | 0.966 | 0.083 | 0.000 | ||
| Configural vs metric | 22.276(4) = 5.569 | 0.000 | 0.014 | 0.007 | 0.008 | 0.000 | ||
| Metric vs scalar | 45.607(5) = 9.121 | 0.000 | 0.003 | 0.001 | 0.002 | 0.000 | ||
| Western Europe (n = 16611) |
RII | Configural | 0.713(2) = 0.357 | 0.700 | 1.000 | 1.000 | 0.000 | 1.000 |
| Metric | 2.324(5) = 0.465 | 0.823 | 1.000 | 1.000 | 0.000 | 1.000 | ||
| Scalar | 350.461(9) = 38.940 | 0.000 | 0.992 | 0.990 | 0.048 | 0.787 | ||
| Configural vs metric | 1.610(3) = 0.537 | 0.657 | 0.000 | 0.000 | 0.000 | 0.000 | ||
| Metric vs scalar | 348.137(4) = 87.034 | 0.000 | 0.008 | 0.010 | 0.048 | 0.213 | ||
| RPI | Configural | 35.950(6) = 5.992 | 0.000 | 0.999 | 0.996 | 0.017 | 1.000 | |
| Metric | 42.019(10) = 4.202 | 0.000 | 0.999 | 0.998 | 0.014 | 1.000 | ||
| Scalar | 455.582(15) = 30.372 | 0.000 | 0.983 | 0.978 | 0.042 | 1.000 | ||
| Configural vs metric | 6.069(4) = 1.517 | 0.194 | 0.000 | 0.002 | 0.003 | 0.000 | ||
| Metric vs scalar | 413.564(5) = 82.713 | 0.000 | 0.016 | 0.020 | 0.028 | 0.000 | ||
| RBI | Configural | 24.805(6) = 4.134 | 0.000 | 1.000 | 0.999 | 0.014 | 1.000 | |
| Metric | 87.454(10) = 8.745 | 0.000 | 0.998 | 0.997 | 0.022 | 1.000 | ||
| Scalar | 797.080(15) = 53.139 | 0.000 | 0.984 | 0.979 | 0.056 | 0.001 | ||
| Configural vs metric | 62.648(4) = 15.662 | 0.000 | 0.002 | 0.002 | 0.008 | 0.000 | ||
| Metric vs scalar | 709.626(5) = 141.925 | 0.000 | 0.014 | 0.018 | 0.034 | 0.999 | ||
| Non WEIRD (n = 16906) |
RII | Configural | 0.432(2) = 0.216 | 0.806 | 1.000 | 1.000 | 0.000 | 1.000 |
| Metric | 15.307(5) = 3.061 | 0.009 | 1.000 | 0.999 | 0.011 | 1.000 | ||
| Scalar | 396.777(9) = 44.086 | 0.000 | 0.990 | 0.986 | 0.050 | 0.414 | ||
| Configural vs metric | 14.875(3) = 4.958 | 0.002 | 0.000 | 0.001 | 0.011 | 0.000 | ||
| Metric vs scalar | 381.470(4) = 95.368 | 0.000 | 0.010 | 0.013 | 0.039 | 0.586 | ||
| RPI | Configural | 4.614(4) = 1.154 | 0.329 | 1.000 | 1.000 | 0.003 | 1.000 | |
| Metric | 45.334(8) = 5.667 | 0.000 | 0.998 | 0.996 | 0.017 | 1.000 | ||
| Scalar | 414.750(13) = 3.904 | 0.000 | 0.984 | 0.974 | 0.043 | 1.000 | ||
| Configural vs metric | 40.718(4) = 10.180 | 0.000 | 0.002 | 0.004 | 0.014 | 0.000 | ||
| Metric vs scalar | 369.416(5) = 73.883 | 0.000 | 0.016 | 0.022 | 0.026 | 0.000 | ||
| RBI | Configural | 2.346(2) = 10.673 | 0.000 | 1.000 | 0.997 | 0.024 | 1.000 | |
| Metric | 81.981(6) = 13.664 | 0.000 | 0.999 | 0.996 | 0.027 | 1.000 | ||
| Scalar | 412.534(11) = 37.503 | 0.000 | 0.993 | 0.988 | 0.046 | 0.931 | ||
| Configural vs metric | 60.636(4) = 15.159 | 0.000 | 0.001 | 0.001 | 0.003 | 0.000 | ||
| Metric vs scalar | 330.553(5) = 66.111 | 0.000 | 0.006 | 0.008 | 0.022 | 0.069 | ||
| Asia (n = 7074) |
RII | Configural | 3.257(2) = 1.629 | 0.196 | 1.000 | 0.999 | 0.009 | 1.000 |
| Metric | 21.066(5) = 4.213 | 0.001 | 0.999 | 0.997 | 0.021 | 1.000 | ||
| Scalar | 73.586(9) = 8.176 | 0.000 | 0.995 | 0.993 | 0.032 | 1.000 | ||
| Configural vs metric | 17.808(3) = 5.936 | 0.000 | 0.001 | 0.002 | 0.012 | 0.000 | ||
| Metric vs scalar | 52.520(4) = 13.130 | 0.000 | 0.004 | 0.004 | 0.011 | 0.000 | ||
| RPI | Configural | 14.768(6) = 2.461 | 0.022 | 0.999 | 0.996 | 0.014 | 1.000 | |
| Metric | 23.761(10) = 2.376 | 0.008 | 0.998 | 0.997 | 0.014 | 1.000 | ||
| Scalar | 69.791(15) = 4.653 | 0.000 | 0.993 | 0.991 | 0.023 | 1.000 | ||
| Configural vs metric | 8.993(4) = 2.248 | 0.061 | 0.001 | 0.001 | 0.000 | 0.000 | ||
| Metric vs scalar | 46.030(5) = 9.206 | 0.000 | 0.005 | 0.006 | 0.009 | 0.000 | ||
| RBI | Configural | 5.726(2) = 2.863 | 0.057 | 1.000 | 0.998 | 0.016 | 1.000 | |
| Metric | 52.346(6) = 8.724 | 0.000 | 0.998 | 0.993 | 0.033 | 1.000 | ||
| Scalar | 138.066(11) = 12.551 | 0.000 | 0.994 | 0.989 | 0.040 | 0.995 | ||
| Configural vs metric | 46.620(4) = 11.655 | 0.000 | 0.002 | 0.005 | 0.017 | 0.000 | ||
| Metric vs scalar | 85.720(5) = 17.144 | 0.000 | 0.006 | 0.004 | 0.007 | 0.005 | ||
| Non-Western Europe (n = 8430) |
RII | Configural | 4.728(2) = 2.364 | 0.094 | 1.000 | 0.999 | 0.013 | 1.000 |
| Metric | 9.540(5) = 1.908 | 0.089 | 1.000 | 1.000 | 0.010 | 1.000 | ||
| Scalar | 346.609(9) = 38.512 | 0.000 | 0.986 | 0.982 | 0.067 | 0.000 | ||
| Configural vs metric | 4.812(3) = 1.604 | 0.186 | 0.000 | 0.001 | 0.003 | 0.000 | ||
| Metric vs scalar | 337.069(4) = 84.267 | 0.000 | 0.014 | 0.018 | 0.057 | 1.000 | ||
| RPI | Configural | 20.708(6) = 3.451 | 0.002 | 0.999 | 0.996 | 0.017 | 1.000 | |
| Metric | 29.820(10) = 2.982 | 0.001 | 0.999 | 0.997 | 0.015 | 1.000 | ||
| Scalar | 419.807(15) = 27.987 | 0.000 | 0.970 | 0.960 | 0.057 | 0.010 | ||
| Configural vs metric | 9.112(4) = 2.278 | 0.059 | 0.000 | 0.001 | 0.002 | 0.000 | ||
| Metric vs scalar | 389.987(5) = 77.997 | 0.000 | 0.020 | 0.037 | 0.042 | 0.990 | ||
| RBI | Configural | 30.655(4) = 7.664 | 0.000 | 0.999 | 0.996 | 0.028 | 1.000 | |
| Metric | 47.127(8) = 5.891 | 0.000 | 0.999 | 0.997 | 0.024 | 1.000 | ||
| Scalar | 290.898(13) = 22.377 | 0.000 | 0.992 | 0.988 | 0.050 | 0.441 | ||
| Configural vs metric | 16.472(2) = 8.236 | 0.002 | 0.000 | 0.001 | 0.004 | 0.000 | ||
| Metric vs scalar | 243.771(5) = 48.754 | 0.000 | 0.007 | 0.011 | 0.026 | 0.559 | ||
| South America (n = 1402) |
RII | Configural | 0.994(2) = 0.497 | 0.608 | 1.000 | 1.003 | 0.000 | 0.976 |
| Metric | 3.976(5) = 0.795 | 0.553 | 1.000 | 1.001 | 0.000 | 0.998 | ||
| Scalar | 40.507(9) = 4.501 | 0.000 | 0.985 | 0.980 | 0.050 | 0.468 | ||
| Configural vs metric | 2.982(3) = 0.994 | 0.394 | 0.000 | 0.002 | 0.000 | 0.022 | ||
| Metric vs scalar | 36.530(4) = 9.133 | 0.000 | 0.015 | 0.021 | 0.050 | 0.518 | ||
| RPI | Configural | 11.207(8) = 1.401 | 0.190 | 0.998 | 0.996 | 0.017 | 0.996 | |
| Metric | 30.955(12) = 2.580 | 0.002 | 0.990 | 0.984 | 0.034 | 0.967 | ||
| Scalar | 96.966(17) = 5.704 | 0.000 | 0.958 | 0.951 | 0.058 | 0.112 | ||
| Configural vs metric | 19.748(4) = 4.937 | 0.001 | 0.008 | 0.012 | 0.017 | 0.029 | ||
| Metric vs scalar | 66.011(5) = 12.002 | 0.000 | 0.030 | 0.033 | 0.024 | 0.855 | ||
| RBI | Configural | 9.801(6) = 1.633 | 0.133 | 0.998 | 0.995 | 0.021 | 0.983 | |
| Metric | 15.968(10) = 1.597 | 0.101 | 0.997 | 0.995 | 0.021 | 0.998 | ||
| Scalar | 68.561(15) = 4.571 | 0.000 | 0.977 | 0.970 | 0.051 | 0.448 | ||
| Configural vs metric | 6.168(4) = 1.542 | 0.187 | 0.001 | 0.000 | 0.000 | 0.015 | ||
| Metric vs scalar | 52.592(5) = 10.518 | 0.000 | 0.021 | 0.025 | 0.030 | 0.550 |
χ2: chi-square; df: default freedom; p: p value; CFI: comparative fit index; TLI: Tucker Lewis index; RMSEA: root mean square error of approximation; PCLOSE: p of Close Fit; RII: Religious Identity Index; RPI: Religious Practice Index; RBI: Religious Beliefs Index; WEIRD: Western, Educated, Industrialized, Rich, and Democratic.
Funding
The author(s) disclosed receipt of the following financial support for the research, authorship, and/or publication of this article: This work has been supported by Centre for Philosophical and Humanistic Studies (UID/FIL/00683/2020).