
Abstract
This work aims to validate using a video-based blink detection system for detecting changes in cognitive load. Participants completed a cognitive task with increasing levels of difficulty. Blink rate was recorded via both our video-based system and a scientific-grade eye-tracker. Results showed no differences in the blink rates recorded by the two systems. However, while strong evidence was found that the blink rate recorded through the eye-tracker increased under greater cognitive task demand, no such pattern was observed for the output from the video-based system. Our findings show that the overall performance of the video-based system was comparable with that of the eye-tracker's, but its sensitivity in detecting changes in cognitive load was inferior to that of its counterpart's.
Introduction
Cognitive load is the demand for cognitive control imposed by a task (International Organization for Standardization, 2016). Maintaining optimal cognitive load is necessary for effective task performance. Conditions of nonoptimal load wherein the combined cognitive task demand is either too low (underload) or too high (overload) for the user are associated with performance declines and increased safety risks in safety-critical tasks . For example, completing activities like driving or product assembly under high cognitive load often leads to poorer task performance and a greater risk of collisions or work injuries (Biondi et al., 2023; Strayer et al., 2015). Likewise, cognitive underload resulting from, e.g., boredom, are associated with performance declines in tasks requiring prolonged attentive engagement (McWilliams & Ward, 2021).
Cognitive load is often assessed through measuring the human operator’s performance in secondary tasks. Simple stimulus detection tasks wherein the user is instructed to press a button in response to the presentation of an intermittent stimulus are common for assessing the load of the primary task at hand (e.g., International Organization for Standardization, 2016). Changes in cognitive load manifest through changes in detection performance, with greater load resulting in longer response times (Harbluk et al., 2013). Given their simplicity, researchers have adopted these assessment tasks in a variety of applied settings including driving and lie detection (Bird et al., 2019; Tillman et al., 2017). However, because they require the completion of a behavioral task demanding consistent attentional engagement, it is argued that they incur in an added cognitive cost (Biondi et al., 2020)
Oculomotor metrics are commonly used for cognitive load assessment. For example, blink rate which is the frequency of eye blinking is found to track fluctuations in cognitive load. Magliacano and colleagues (2020) had participants complete an oddball auditory task wherein they were instructed to actively count the number of auditory tones. With the task becoming more taxing, a spike in blink frequency was observed. Consistent patterns are also found outside laboratory settings. For example, in a recent study we had participants complete manufacturing tasks requiring repeated full-body motions in two conditions of low and high cognitive demand (Biondi et al., 2023). As the cognitive demand of the task increased, this resulted in a higher blink rate. Faure et al. (2016) found consistent patterns during simulated driving wherein, as the difficulty of the secondary cognitive task increased, this led to more frequent blinking. Though useful, these studies all used scientific-grade equipment which, even when portable, may reduce its adoption in everyday settings.
To tackle this issue, recent work has tested alternative, non-invasive ways for recording eye blinks that use ubiquitous, widely available camera technology. For example, Al-Gawwam and Benaissa (2018) estimated the aperture of the eyes via extracting users’ facial landmarks from a generic video. This information was then compared against a set threshold to determine the occurrence of eye blinks. Dewi, Chen, Jiang, et al. (2022) adopted a similar approach. In their work they applied the dlib algorithm (King, 2009)to generic video footage to estimate the aperture of each eye based on six facial landmarks: two for the upper eyelid, two for the lower eyelid, one for the medial canthus, and one for the lateral canthus. A threshold known as eye-aspect ratio was calculated so that a blink was detected every time the aperture of the eyes fell below the set threshold. In their follow-up work, Dewi, Chen, Chang, et al. (2022) used a similar camera-based approach for driver state detection. Facial landmarks were first extracted from a generic camera video and compared against the set threshold to determine eye blinks. Changes in blink rate were observed in conditions of underload. Although promising, these studies failed to validate the proposed system. The accuracy of the resulting blink rate was not tested against that of traditional methods of blink detection which, in turn, makes it difficult to gauge its reliability as an alternative means for cognitive load assessment.
Given these limitations, this study aims to:
Adopt a scientific-grade eye-tracker to test the accuracy of the alternative, generic video-based approach for eye blink detection. If the video-based approach is accurate, we expect the resulting blink rate not to be different from the one obtained using the scientific-grade eye-tracker.
Investigate the accuracy of the generic video-based approach in tracking changes in cognitive load. A higher blink rate is expected with greater cognitive task demand.
To achieve this, we have participants complete a cognitive task with increasing levels of difficulty. The generic video feed from a ubiquitous camera is processed using a threshold-based approach similar to that used in Dewi, Chen, Chang, et al. (2022)’s to estimate eye blinks. Its output is validated using the blink rate from a scientific-grade eye-tracker. Cognitive load is measured through tracking participants’ performance in a single stimulus detection task.
Methods
Participants
Twenty-five volunteers (18 men, 7 women) were recruited from the University of Windsor student population and received a $10 Amazon gift card in exchange for their participation. Their age ranged between 18 and 32 years old (M = 23, SD = 5.3). They all had normal or corrected-to-normal hearing and sight. The research complied with American Psychological Association Code of Ethics and was approved by the University of Windsor Research Ethics Board (#19–045).
Design
A design with two within-subject factors was considered. The first factor, blink detector, had 2 levels: webcam and eye-tracker. Eye blinks were computed using both a webcam-based system and a scientific-grade eye-tracker (more information in the equipment and procedure section). The second factor, cognitive task difficulty, was manipulated by having participants complete one of three versions of a cognitive task: easy, medium, hard, each producing increasing levels of cognitive task demand (more information in the equipment and procedure section). Dependent variables were: blink rate (in blinks per minute) measured via the webcam-based system and eye-tracker; response times in the single stimulus detection task (in seconds); self-reported load ratings.
Equipment and Procedure
Upon entering the laboratory environment, participants were instructed to complete the consent form and share their demographics information. After being provided with an overview of the study, the familiarization phase begun, which consisted in participants becoming acquainted with the experimental setup including the webcam, eye-tracker, the cognitive task, and the single stimulus detection task.
Camera
A generic webcam that is widely available at office supply stores and online retailers was used for this study. The NexiGo N660P (NexiGo Inc., USA) has a resolution of 1080 pixels and a sampling rate of 60 frames per second. During the familiarization and experimental phases, the webcam was placed on top of an AOC 27-inch screen with a resolution of 1,920 × 1,080 connected to a PC running Windows 10. Participants sat on a generic office chair at a distance of approximately 50 centimeters from the screen with the webcam directly pointed at their face. The video footage from the experimental phase was recorded and processed for eye blink detection after the study (see data processing and analysis). After having been seated, participants received instructions on the eye-tracker and calibration process.
Eye-tracker
A desktop- mounted Gazepoint GP3 eye- tracker (Gazepoint Inc., Vancouver, BC, Canada) with data collection frequency of 60 Hz was used. The eye- tracker has a graphical user interface which was used for the calibration process. During the calibration process, participants were instructed to fixate on a red circle which moved to occupy nine distinct positions on the screen. At the end of the calibration, participants were instructed on how to complete the cognitive task.
Cognitive task
The auditory version of the n-back task (Owen et al., 2005) was used as the cognitive task as it produces levels of cognitive load comparable to those experienced when performing everyday activities like listening to the radio or conversing on a cellphone. For this task, participants listen to a series of digits randomized between zero and nine and presented at intervals of 3 seconds. Their task is to repeat aloud one of the previously presented digit. In our study, we considered three levels of cognitive task difficulty: easy, medium, hard. In the easy condition, participants did not complete the task (control). In the medium condition, participants were instructed to repeat aloud the last digit that was presented to them. In the hard condition, participants were instructed to repeat aloud the third-to-last digit in the series. During the familiarization phase, participants received instructions on how to complete this task and were given all the time they required to practice it. After practicing this task, participants were instructed on how to complete the single stimulus detection task.
Single stimulus detection task
For this task, participants were presented with a red circle with a radius of 80 pixels that was located at the center of a black background of the same size of the screen. The stimulus was presented randomly every 3 to 5 seconds and required participants to detect it by pressing the spacebar on the keyboard as quickly as possible. This task was created using the Python’s Pygame library. Response times (in seconds) were recorded. Note that this task was modeled after the visual version of the ISO Detection Response Task (International Organization for Standardization, 2016), which is a standard protocol for measuring cognitive load. This was done to ensure the validity and accuracy of our methodology in assessing levels of participants’ cognitive load. During the familiarization phase, participants received instructions on how to complete this task and were given all the time they required to practice it. After the practice was over, the experimental phase begun.
Self-reported load
Participants were also familiarized with the scale for assessing the cognitive load of the task at hand. They were asked to rate on a scale from 0 (very low) to 100 (very high) the level of cognitive load experience during the experimental condition.
Experimental phase
During the experimental phase, participants completed three experimental conditions wherein the difficulty of the cognitive task was manipulated: easy, medium, hard. Each condition lasted 4 minutes. Participants completed the single stimulus detection task concurrently with the cognitive task. A video footage of the participant’s face was recorded throughout the experimental phase, and later processed for eye blink detection (see data processing section). Blink rate was also measured using the Gazepoint eye-tracker. The presentation of the three conditions was counterbalanced using a Latin square design. At the end of each condition, participants reported their subjective cognitive load ratings. The next condition commenced when participants felt ready to do so. When all three conditions were completed, participants were dismissed.
Data processing and analysis
Video-based eye blink calculation
The video-based eye blink calculation was conducted as follows. First, the video footage was processed using the dlib Python library (King, 2009). Sixty-eight facial landmarks were then computed (figure 1). Of these landmarks, the ones of interest were coordinates 37-42 which track the upper eyelid, lower eyelid, medial and lateral canthus for the right eye, and coordinates 43-48 which track the same for the left eye.
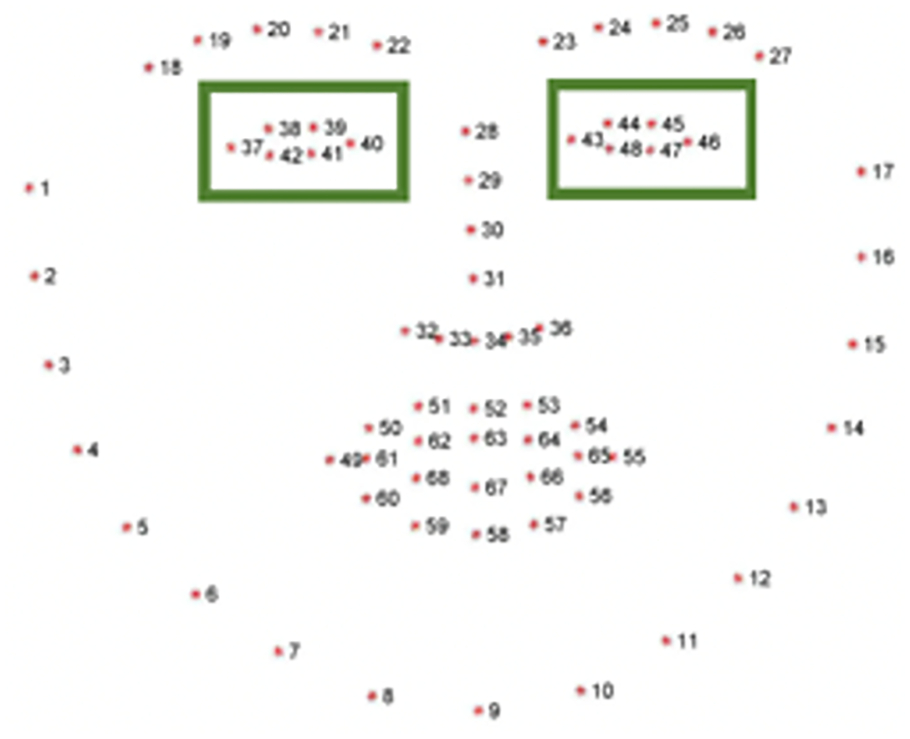
Sixty-eight facial landmarks detected through the dlib library. Landmarks of interest for the right and left eye are surrounded by green rectangles.
Eye-aspect ratio or EAR was then calculated as an estimate of eyelid aperture. EAR is a scalar value ranging from 0 to 1 so that the greater the EAR the greater the eyelid aperture. Each 4-minute video was split into forty-eight 5-second time windows. Considering that a normal blink rate is approximately 12 blinks per minute, the duration of each 5-second window was determined so at least one blink would fall within each window. Mean and standard deviation (SD) of EAR were calculated for each window. Within each window, a threshold of 2-SD below the mean was set. The duration of individual eye blinks approximates 250 milliseconds. With this in mind, considering the webcam’s sampling rate of 60Hz, a threshold of 15 consecutive frames was set for blink detection. This means that, to be classified as a blink, the recorded EAR must fall below the adaptive threshold (means -2-SD) for at least 15 consecutive frames, else it would be classified as a nonblink. This procedure was applied to all three experimental conditions so that blink rate (in number of blinks per minute) was computed for the easy, medium, and hard cognitive task conditions.
Eye-tracker eye-blink calculation
The Gazepoint eye-tracker output the number of eye blinks recorded in each condition for each participant. A research assistant visually inspected the output to ensure no artifacts were present. The output from the Gazepoint eye-tracker was used to compare the output of the video-based eye blink calculation.
Single stimulus detection task
Following the ISO DRT protocol (2016), response times shorter than 100 ms and longer than 2,500 ms were removed and no longer analyzed. Average response times (in milliseconds) were calculated in each of the three experimental conditions for each participant.
Self-reported load
Mental load self-reported ratings were processed for each participant and condition.
Statistical analysis
Our hypothesis for objective 1 is that there are no differences in the blink rates obtained using the video-based system and the scientific-grade eye-tracker. For this reason, considering the characteristics of the traditional null hypothesis statistical testing (NHST), using this approach would inflate the type 2 error, i.e., the likelihood of finding a false negative. This is because the likelihood of the null hypothesis H0 being accepted (and the alternative hypothesis H1 being rejected) is higher than that of it being rejected (and H1 being accepted). For this reason, a Bayesian analysis approach is preferred over NHST. Bayesian analyses set up two competing models, one in favor of H0 and one in favor of H1. The Bayes factor is then used to decide which model is more likely based on the evidence at hand (Dienes, 2014). Bayes factors between 3 and 10 or 1/3 and 1/10 represent moderate evidence in favor of the alternative or null hypothesis, respectively. Bayes factors between 10 and 30 or 1/10 and 1/30 represent strong evidence in favor of the alternative or null hypothesis, respectively. Bayes factors greater than 30 or less than 1/30 represent very strong evidence in favor of the alternative or null hypothesis, respectively. Bayes factors between 1/3 and 3 are interpreted as being weak evidence favoring neither hypothesis. Bayesian test equivalents of general linear tests were used to analyze data for objectives 1 and 2 (Quintana & Williams, 2018). Data processing and analyses were conducted in RStudio (Racine, 2012), and the BayesFactor library was adopted for conducting Bayesian analyses.
Results
Results are presented by objectives with objective 1 investigating the accuracy of the video-based system through comparing the resulting blink rate with that obtained using the eye-tracker, and objective 2 investigating the accuracy of the video-based system in detecting increasing levels of cognitive load.
Objective 1. Accuracy of the video-based blink detection system
Repeated-measure Bayesian analysis of variance models with blink rate as dependent measure, and participant ID as random factor were set up to test objective 1. A model with blink detector (2 levels: eye-tracker, video-based system) as the independent factor was set up to investigate whether blink rate differed across the two systems. A Bayes Factor of 0.18 was found indicating moderate evidence in support of the null hypothesis that blink rates obtained using the two systems were not different. A model with blink detector and cognitive task difficulty (3 levels: easy, medium, hard) was set up to investigate the interaction between the two factors. A Bayes Factor of 0.03 was found suggesting strong evidence in support of the null hypothesis that no interaction was present. Figure 2 shows blink rates across the two systems and three cognitive task difficulty conditions.
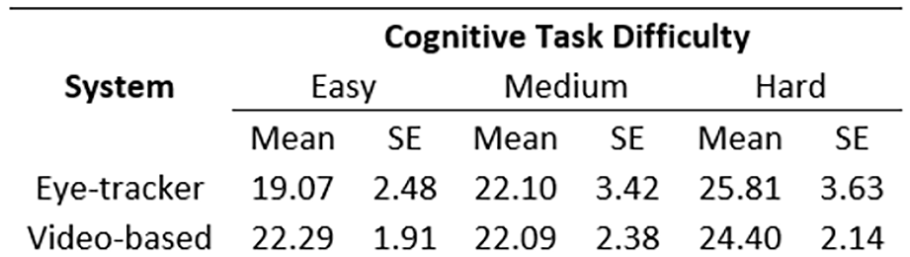
Mean blink rate (in number of blinks per minute) and standard error (SE) of blink rate by system (eye-tracker and video-based) in the three cognitive task difficulty conditions (easy, medium, hard).
Objective 2. Accuracy of the video-based blink detection system in detecting increasing levels of cognitive load
A repeated-measure Bayesian analysis of variance model was set up with participant ID as random factor, cognitive task demand (3 levels: easy, medium, hard) as the independent factor, and blink rate obtained through the video-based system as the dependent measure. A BF of 0.22 was found indicating moderate evidence against the hypothesis that blink rate recorded using the video-based system increased under conditions of greater cognitive task demand.
To ensure that the increasing level of difficulty of the cognitive task in fact induced greater cognitive load, separate repeated-measure Bayesian analysis of variance models were run with blink rate obtained through the eye-tracker as the dependent measure. A Bayes Factor of 40.65 revealed that, when recorded using the eye-tracker, blink rate in fact increased under conditions of greater cognitive task demand. Similar analyses run on response times in the single stimulus detection task and self-reported mental demand ratings both revealed consistent results showing very strong evidence that the increasing cognitive task demand increased both response times, BF = 1.15 x 10¹⁵, and self-reported ratings of mental demand, BF = 2.6 x 1084. Figure 3 shows response times and cognitive load ratings by condition.
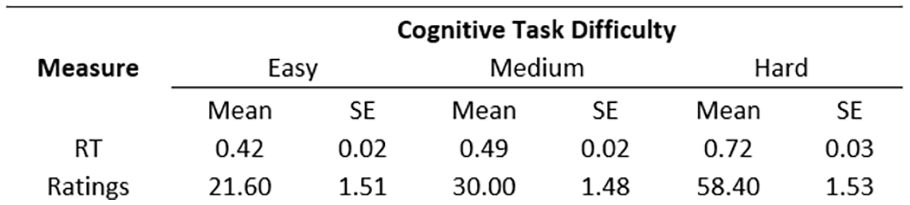
Response times (RT in seconds) and standard error (SE) of RT, self-reported cognitive load ratings and SE of ratings in the three cognitive task difficulty conditions (easy, medium, hard).
Discussion
Our first objective aimed to test the accuracy of the video-based blink detection system by comparing its resulting blink rate with that obtained using a scientific-grade eye-tracker. Bayesian analyses showed evidence that no differences were present between the two systems. On average, only a small discrepancy of 1.54 blinks per minute was observed between the two systems across the three experimental conditions. This is a key finding in that it shows the potential for video-based systems that use footage from ubiquitous cameras to serve as a feasible solution for tracking blink rate. Dewi, Chen et al. (2022) and Pandey and Muppalaneni (2021) attempted to validate similar video-based systems for tracking eye blinks but failed to do so as, in addition to only using short videos recorded on individual participants, their results were not validated using established ground-truth methodologies. Our findings add to the existing literature posing video-based systems as a plausible future alternative to scientific-grade eye-trackers.
Our second objective aimed to investigate using the video-based blink detection system to track changes in cognitive load. Analysis showed that, when the output from the video-based system was used, no differences in blink rate were observed under greater cognitive task demand. This despite the fact that, consistently with the current literature (e.g., Strayer et al., 2015; Harbluk et al. 2013), slower response times to the detection task, higher self-reported ratings and, more importantly, a higher blink rate obtained using the eye-tracker were observed as the cognitive task became more difficult. These results seemingly conflict with our findings for objective 1. We posit that, overall, while the output of our video-based system was consistent with that of a scientific-grade eye-tracker’s, its sensitivity in tracking changes in cognitive load was in fact lower than that of its counterpart’s. Note that a difference in blink rate of 2 blink/minute was noted between the easy and hard task conditions for the video-based system, compared to an increase in 6 blink/minute for its counterpart. We argue that this could be the result of the chosen approach for eye blink detection and that the system’s accuracy could be improved by further revising the characteristics of the adaptive threshold (e.g., the duration of the time window or how the threshold is calculated). It is also possible that the rise in cognitive task demand experienced in the hard condition was insufficient or the characteristics of the chosen task were inadequate to induce meaningful changes in the blink rate obtained through the video-based system. Our future research will address these issues.
Altogether, our findings show promise. Our study adds to the literature using less intrusive means for the assessment of oculomotor behaviors. While the vast majority of the research use scientific-grade eye-trackers for recording blink rate (e.g., Ramakrishnan et al., 2021), this methodology comes with severe limitations when employed outside traditional laboratory settings. For once, even when using more portable solutions, their associated costs (monetary, time, labor) limit its adoption in everyday settings (Funke et al., 2016). Our data pose video-based systems as a potential solution to this issue. However, we recognize that our system’s lack of sensitivity for tracking increasing cognitive load show that further research is required to validate this approach for cognitive load assessment. For example, while recent studies have advanced using camera-based systems for fatigue and distraction monitoring (Schwarz et al., 2019), their ability to detect fluctuations in the user state with the required level of accuracy is still untested.
Footnotes
Acknowledgements
We acknowledge the generous contribution from Atlas Copco Inc. and Mitacs. We also thank SSHRC, NSERC, and WE-SPARK Health Institute for their valuable support.