
Abstract
Research on posttraumatic growth has been marred by the ubiquity of retrospective perceived growth assessments that lack construct validity. However, one justification for assessing perceived growth is that such perceptions may be a catalyst for subsequent change. We examined this question using a measurement-burst design in a representative midlife sample who had experienced a major negative life event in the past year (Wave 1: N = 804). Participants completed three waves of retrospective measures of perceived growth (Posttraumatic Growth Inventory), current-standing measures of posttraumatic growth domains, and experience-sampling assessments of state manifestations of growth-relevant domains twice a day for 3 weeks (Nassessments = 32,099) over 6 months. In random-intercept cross-lagged panel models, perceived growth did not predict subsequent observed change in current standing or aggregated state assessments of growth. Overall, perceived growth does not appear to serve as a catalyst for positive change in the short term.
Keywords
In psychology, research on posttraumatic growth (PTG)—the study of positive psychological change as a result of major negative life experiences (Tedeschi & Calhoun, 2004)—has gained increasing attention since the mid 1990s. However, many PTG measures (e.g., the Posttraumatic Growth Inventory [PTGI]; Tedeschi & Calhoun, 1996) assess perceived growth retrospectively in the wake of negative life events. Owing to the limitations of these measures (e.g., Jayawickreme, Infurna, et al., 2021; Tennen & Affleck, 2009), researchers have increasingly highlighted the importance of prospective longitudinal designs that examine pre- to posttrauma changes in thoughts, feelings, and behaviors (Jayawickreme & Blackie, 2014). However, some PTG researchers have argued that perceived growth may have value in fostering subsequent observed change (i.e., have a self-fulfilling impact on promoting genuine change; Calhoun & Tedeschi, 2006; Park & Boals, 2021; Tedeschi et al., 2018). We tested this hypothesis with an innovative measurement-burst design and examined whether retrospective measures of perceived growth predicted short-term observed changes on both “current-standing” assessments of domains of growth and aggregated state manifestations of PTG-relevant thoughts, feelings, and behaviors in daily life using rigorous modeling techniques.
Validity and Utility of Retrospective Reports of Growth
Multiple studies suggest that retrospective measures of perceived growth such as the PTGI lack both construct and predictive validity (Jayawickreme & Blackie, 2014). Although it is reasonable to expect that retrospective measures of perceived PTG will reflect pre- to posttrauma changes in domains of growth typically assessed in PTG assessments (i.e., observed change), a number of prospective studies have shown that not to be the case. 1 Specifically, these studies have compared changes in current-standing assessments of PTG before and after participants experienced a negative life event and found that this observed change was only modestly related to retrospective assessments of perceived growth completed following the event (Corman et al., 2021; Frazier et al., 2009; Owenz & Fowers, 2019; Yanez et al., 2011). A recent meta-analysis suggested that these issues with the validity of retrospective measures of PTG may be explained by various cognitive biases (Gower et al., 2022).
Additionally, multiple studies have observed a positive relation between perceived PTG and distress. Perceived PTG has been found to predict greater subsequent posttraumatic stress in terrorism-affected populations (Zalta et al., 2017), as well as increased pre- to posttrauma distress in a prospective study with an undergraduate student sample (Frazier et al., 2009). Similarly, soldiers deployed to Iraq who perceived more PTG 5 months after deployment experienced more posttraumatic stress symptoms 15 months after deployment (Engelhard et al., 2015). Additionally, perceived growth in response to stress related to the COVID-19 pandemic did not predict subsequent increases in well-being (Park et al., 2022). Meta-analyses have found perceived growth and posttraumatic stress symptoms to be positively correlated among cancer patients in cross-sectional studies (Marziliano et al., 2020; Shand et al., 2015). Given that measures of perceived growth are ostensibly measuring positive life changes (e.g., better relationships, greater meaning in life), it is reasonable to assume that scores on such measures should be associated with less—rather than more—distress. Thus, perceived PTG might not have the positive utility assumed by many PTG researchers (Kemmerly et al., 2023).
Although retrospective measures of perceived PTG appear to be weakly related to observed pre- to posttrauma changes and not predictive of positive mental health outcomes, some theorists have argued that perceiving growth may nevertheless have a self-fulfilling effect on observed change over time (Calhoun & Tedeschi, 2006, p. 19; see also Park & Boals, 2021). For example, the Janus-Face model (Zoellner & Maercker, 2006) suggests that perceived growth has two sides: an illusory, maladaptive component and a constructive, functional component. According to this model, illusory PTG can eventually become functional under the right circumstances by acting as a “short-term adaptive palliative coping strategy” (p. 640).
Using Appropriate Methods to Examine the Functional Benefits of Perceived PTG
Given the challenges of measuring PTG, it is important to use multimethod approaches to examine this phenomenon (Frazier et al., 2014). Therefore, in addition to the current-standing measure of PTG used in past research (e.g., Frazier et al., 2009; Roepke et al., 2018), we assessed observed change through averaged state assessments of PTG-relevant domains (Blackie et al., 2017). Employing state-aggregated assessments to measure growth-relevant constructs is supported by current theories of personality dynamics (Jayawickreme et al., 2021). For example, whole-trait theory (Fleeson & Jayawickreme, 2021) posits that states represent specific manifestations of a person’s underlying disposition (see Jayawickreme & Blackie, 2014, for an application of this approach to PTG research).
Daily assessment methods such as experience-sampling methodology (ESM) involve sampling everyday growth-relevant thoughts, feelings, and behavior several times per day for a specific number of days (Conner et al., 2009). ESM is broadly accepted as a self-report behavioral measurement tool, with high ecological validity and attenuation of memory error and bias associated with retrospective assessments (Scollon et al., 2003). One key advantage of using ESM—relevant to the current study—is that it affords the examination of whether the broader beliefs and self-perceptions characteristic of PTG in fact translate into meaningful differences in daily life over time. Additionally, states may be less sensitive to biases associated with more global self-assessments (Horwitz et al., 2023). These strengths make aggregated state assessments a valuable additional indicator of observed change.
An additional novel feature is that the present study used random-intercept cross-lagged panel models (RI-CLPMs; Hamaker et al., 2015). The cross-lagged effects are of interest here because they capture the degree to which one construct (e.g., perceived PTG) predicts the other construct (e.g., observed changes in current standing measures) over time while controlling for prior levels of each variable as well as concurrent associations between the constructs (Orth et al., 2022). Specifically, the RI-CLPM includes a random-intercept factor that captures the stable between-person variance in the constructs across assessments (Hamaker et al., 2015; Orth et al., 2022). These models allowed us to examine reciprocal relations between perceived PTG and observed PTG across time while accounting for the stable between-person variance associated with each construct.
The Current Study
As noted above, we are not aware of any research that has assessed the validity of perceived growth measures such as the PTGI by examining whether they predict subsequent observed change. In the current study, we used multiple assessments of observed change to provide a stringent test of whether scores on perceived growth measures such as the PTGI predict subsequent observed change on domains of growth assessed by the PTGI. Specifically, we employed three distinct assessments in the present study. First, we assessed retrospective assessments of perceived growth using the PTGI (Tedeschi & Calhoun, 1996), which includes five domains (increased appreciation of life, more intimate social relationships, heightened personal strength, greater engagement with religious/spiritual questions, and the recognition of new life possibilities). Participants reported the extent to which they had experienced positive change as a result of a major negative life event (e.g., “I have a stronger religious faith”). The PTGI is the most widely used assessment of perceived growth (Boals et al., 2023).
We additionally assessed observed change in two ways. First, we assessed participants’ current levels on each of the five domains of PTG using a current-standing version of the PTGI (C-PTGI). This measure has been used in past research examining the extent to which perceived growth correlated with observed change from before to after an event (Frazier et al., 2009). As in Frazier and colleagues’ (2009) study, the items in the C-PTGI rephrased the original items from the PTGI to reflect the experiences of participants over the past 2 weeks (e.g., “I have had a strong religious faith”), as opposed to perceived change in response to adversity as assessed by the PTGI.
Second, we assessed momentary or “state” manifestations of thoughts, feelings, and behaviors associated with each of the five PTG domains using a measure specifically developed to assess PTG in daily life (S-PTG; Blackie et al., 2017). At multiple points during the day, participants reported the extent to which they were experiencing specific states associated with each of the five PTG domains (“I felt aware of my connection to my faith or spiritual beliefs”). The S-PTG items are listed in the supplementary materials at https://osf.io/78jdt/.
Building on past work examining the validity of the PTGI as both a measure of growth and predictor of mental health, the present study examined the predictive validity of the PTGI by examining whether scores on the PTGI predicted subsequent change in PTG-relevant domains (i.e., observed change) in a representative online sample over a 6-month period, thereby testing the claim that perceived growth may lead to subsequent positive changes. On the basis of the existing evidence suggesting the limited validity of measures of perceived growth, we predicted that we would not observe associations between perceived growth and observed change at subsequent time points using both current-standing and aggregated state assessments of PTG domains. Relations between observed change and subsequent perceived growth were also assessed, although they were not the focus of the current investigation.
Transparency and Openness
The present study was not preregistered. All data, syntax, and supplementary materials are available at https://osf.io/t3gja/. We report how we determined our sample size, all data exclusions, and all measures used in the study. Ethical approval was obtained from the Wake Forest University Institutional Review Board (IRB00023086).
Method
Participants and procedure
Participants were recruited online by the survey company Qualtrics. Inclusion criteria were that participants had to be at least 18 years old, had participated in research studies on Qualtrics panels for 2 years (as suggested by Qualtrics to ensure high-quality data for a longitudinal study), and reported experiencing a major negative life event in the past 12 months. Participants who met these criteria were recruited into the study. As recommended by Qualtrics, they were paid in line with reward incentives offered in market research panels at the time of data collection (December 2018–January 2020).
An overview of the study design is depicted in Supplementary Figure 1 at https://osf.io/78jdt/. At intake, participants complete a 45-min online survey that included questions about their reported major negative event, demographics, mental health, well-being, and personality. They received $3 for completing this survey. At each of the three subsequent waves (at 3, 6, and 9 months after intake), participants were sent online questionnaires that included measures of perceived growth as a result of the specific major negative event (which would have occurred between 3 and 15 months prior to the first wave) reported at intake, as well as their current-standing levels on PTG domains. Following each assessment, participants completed an experience-sampling assessment twice a day—once in the morning between 9 a.m. and 12 p.m. and once in the evening between 5 p.m. and 8 p.m.—for 21 days. Each assessment took approximately 2 to 3 min. Participants reported their current levels of state PTG over the past 30 min. Participants could complete a report up to 1 hr later than the scheduled time if needed but were instructed to report their PTG state manifestations during the requested 30-min period. Participants received $0.25 for each day they completed both surveys, as well as a $2.00 bonus if they completed all assessments at the end of each 21-day period. They also completed a set of additional questionnaires similar to those administered at intake at 12 months (the final wave) and received $6 for their time. The present study excludes the data collected at intake and the final wave and focuses on the three PTG measures (PTGI, current standing, state) collected at the three waves noted above. Participants also completed measures of personality and well-being at intake, as well as questions related to wise reasoning and intellectual humility at each of the ESM waves. These assessments are not relevant to the present investigation.
At intake, the initial sample consisted of 1,107 adults with a mean age of 52.2 years (SD = 11.17). The majority (75.2%) of participants identified as female; 84% identified their race as White, 10% as African American/Black, 3% as Asian, and 3% as “other.” However, 864 participants (78.32% of the intake sample) completed at least one focal measure in at least one wave. Table 1 provides detailed participant characteristics and attrition analyses of the total Wave 1 sample compared with intake. The mean age of participants in the final sample was significantly higher than the sample at intake. 2 Our sample size was determined by considerations discussed by Schönbrodt and Perugini (2013), who recommended a sample size of 250 to achieve stable estimates for correlations, as well as by Bickel (2007) concerning sample sizes in multilevel modeling 3 (see also Lafit et al., 2021, for similar considerations).
Sample Characteristics and Attrition Analysis for Final Study Sample
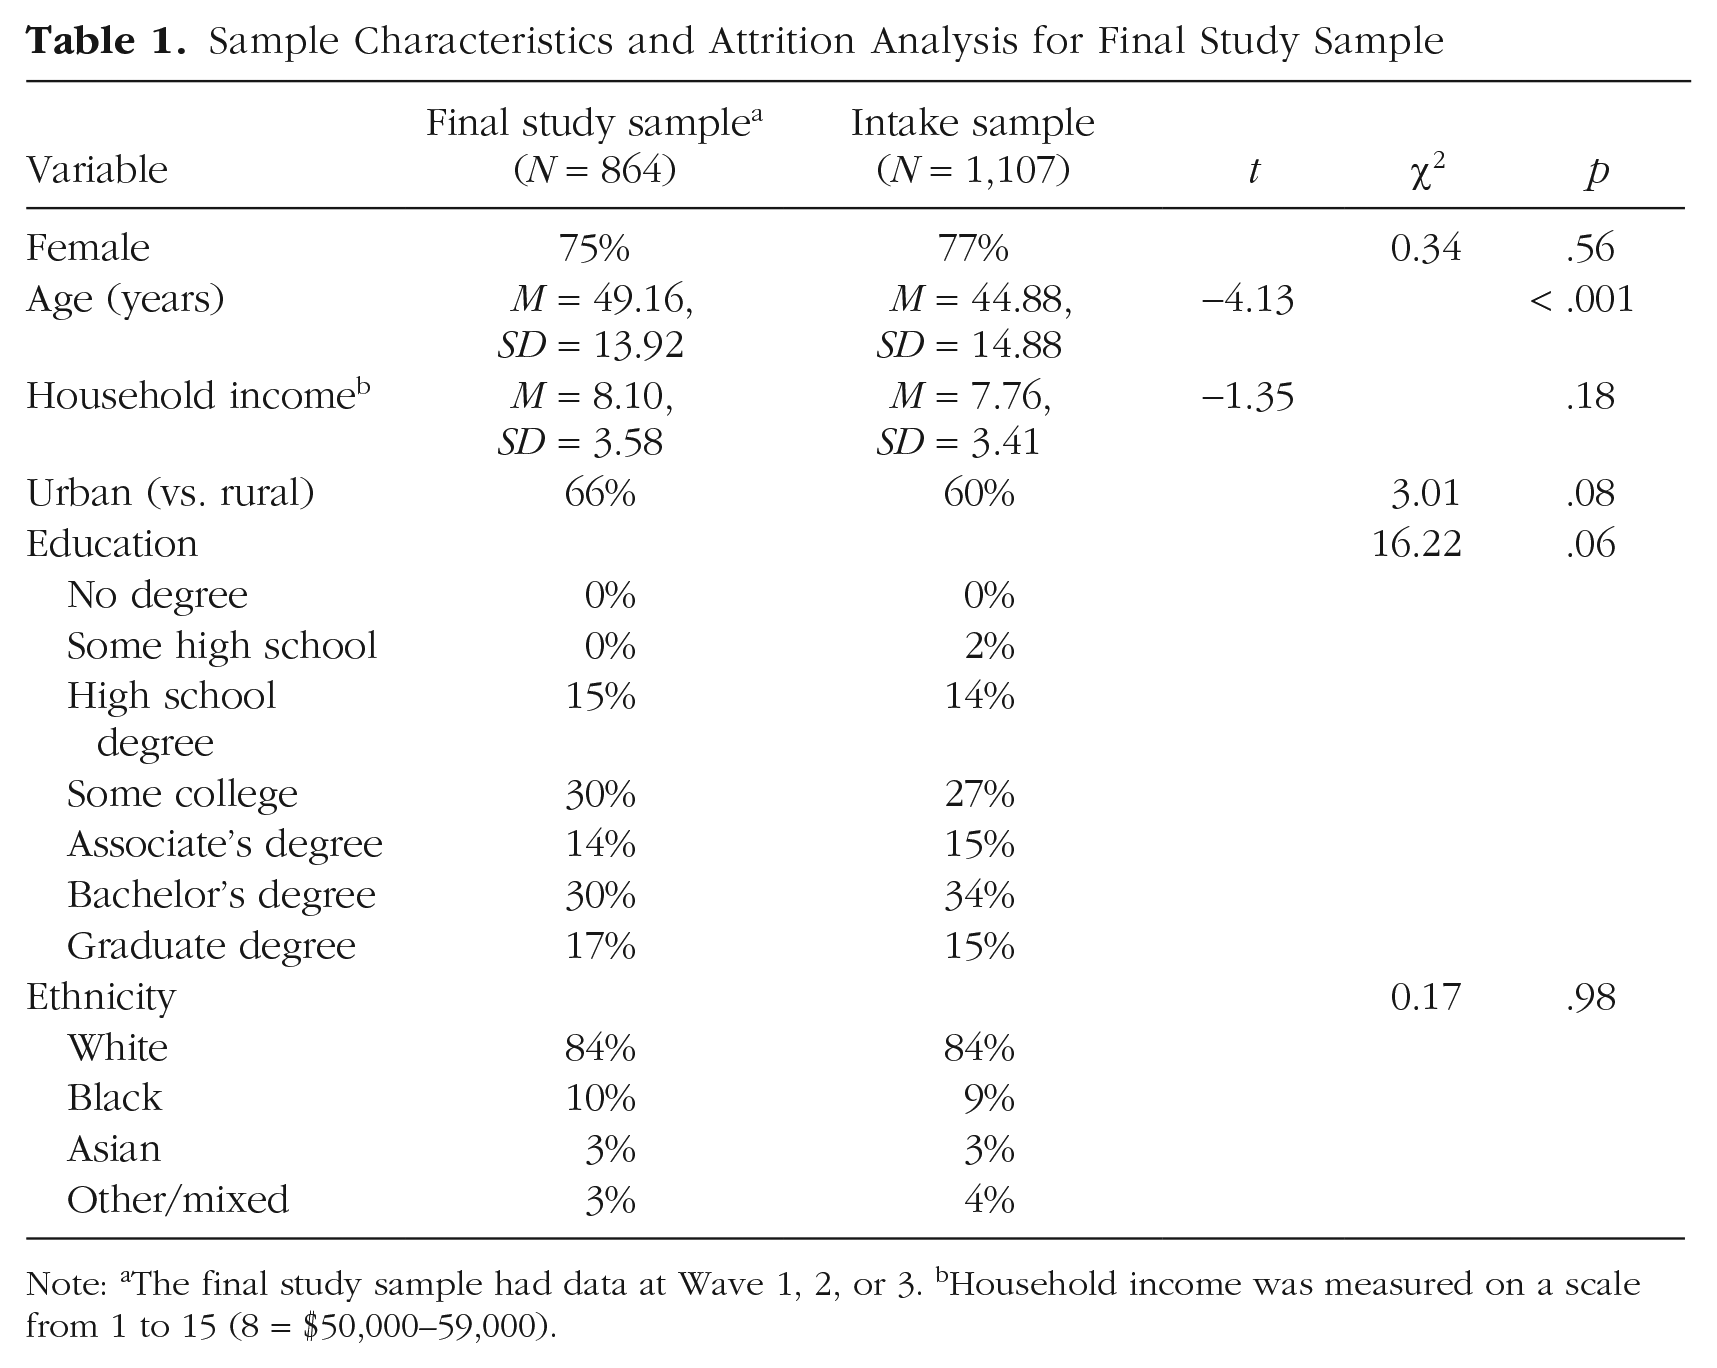
Note: aThe final study sample had data at Wave 1, 2, or 3. bHousehold income was measured on a scale from 1 to 15 (8 = $50,000–59,000).
Measures
Demographics (intake)
At intake, participants reported on their location by state, household income, relationship status, gender, race, education, and age.
Major negative life events (intake)
Major negative events were assessed using the Major Life Events Checklist (Lüdtke et al., 2011). Twenty-five items assessed the major negative life events that may have happened to the participant within the past 12 months. Participants were asked to mark either “yes” or “no” for each statement (e.g., “victim of physical violence (e.g., assault)” or “death of a close friend”). For each event endorsed, participants indicated how positive (“How good did this event make you feel?”) or negative (“How bad did this event make you feel?”) they felt about the event when it happened on a sliding scale from 0 (not good/bad at all) to 100 (extremely good/bad). The items and number of participants who experienced each life event at Wave 1 and how negatively they rated the event are reported in Table 2. Participants were further asked to identify the negative life event that was most impactful. This event was subsequently piped into each survey at subsequent waves, with participants reporting their levels of perceived growth in response to this event.
Number and Percentage of Wave 1 Participants Who Experienced Specific Negative Life Events 12 Months Prior to the Study
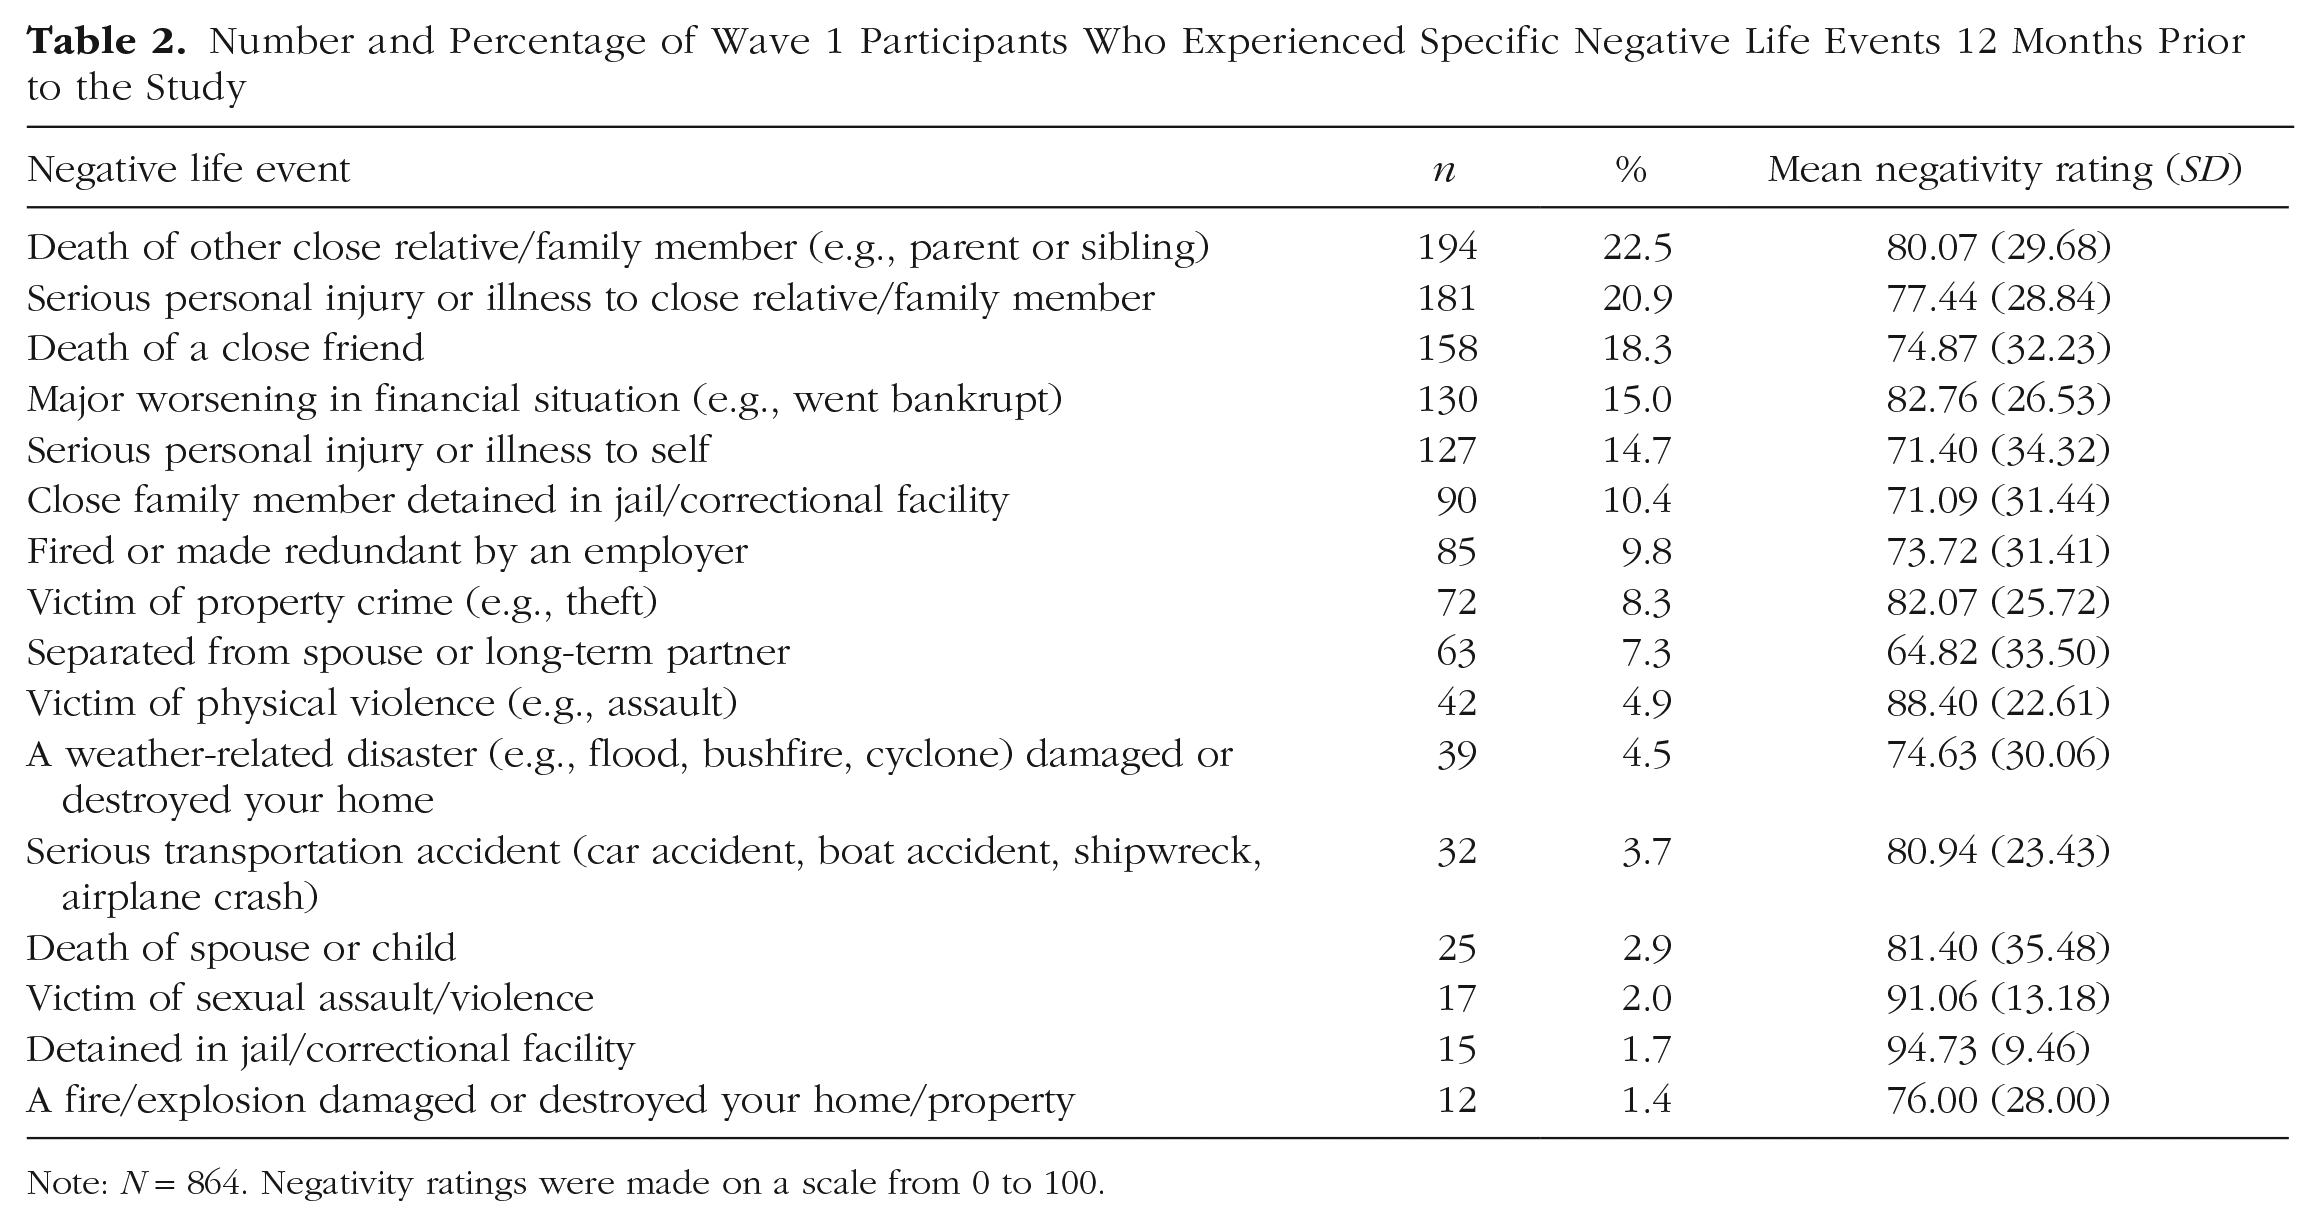
Note: N = 864. Negativity ratings were made on a scale from 0 to 100.
Perceived PTG (Waves 1, 2, and 3)
We assessed perceived growth using the 21-item PTGI (Tedeschi & Calhoun, 1996) at the beginning of each of the three waves. Participants were reminded of the most impactful event they reported at intake and were asked to report the extent to which they believed they changed in positive ways as a result of the event. Participants were asked to rate each statement on a scale from 0 (I did not experience this change as a result of my crisis) to 5 (I experienced this change to a very great degree as a result of my crisis). The αs for the full scale at each wave were greater than or equal to .97, and the αs for all five subscales at each wave were greater than or equal to .86.
Current-Standing PTG (Waves 1, 2, and 3)
To assess observed pre- to posttrauma changes, we used a current-standing version of the 21-item PTGI (C-PTGI; Frazier et al., 2009), which changes the language of the items from the original PTGI to reflect the participants’ experience over the past 2 weeks (rather than perceived change since the event). Participants were asked to rate each statement on a scale from 1 (Strongly Disagree) to 5 (Strongly Agree). The αs for the full scale at each wave were greater than or equal to .94, and the αs for all five subscales at each wave were greater than or equal to .79. Participants completed this measure at the beginning of each of the three waves.
State PTG (Waves 1, 2, and 3)
We assessed S-PTG with a 17-item measure assessing state manifestations corresponding to the five domains of growth assessed by the PTGI (Blackie et al., 2017; items are in the supplementary materials at https://osf.io/78jdt/). At each of the three waves, participants were asked to rate each statement on a scale from 1 (Strongly Disagree) to 7 (Strongly Agree) twice per day for 21 days. We took the average of the morning and evening S-PTG measures over the course of the 21 days to create an aggregated S-PTG score for each wave.
Participants provided up to 42 responses per wave; response rates were 36.5% for Wave 1 (Mresponses = 15.2), 43.6% for Wave 2 (Mresponses = 18.3), and 49.3% for Wave 3 (Mresponses = 20.7). Between-person reliability for the five subscales ranged from .81 to .99, whereas within-person reliability for the five subscales ranged from .70 to 90. These ωs were calculated following the procedure described by Viechtbauer (2017; see also Forkmann et al., 2018).
Analytic approach
We conducted analyses using Mplus (Version 8; Muthén & Muthén, 2017) using RI-CLPMs that accounted for both between- and within-person variance through the inclusion of the random intercept (Hamaker et al., 2015). This allows for trait-like individual differences to endure over time, instead of having each individual vary around the same mean over time. This is an appropriate statistical model to examine whether individual differences in PTG predicted change in C-PTG and S-PTG over time (Orth et al., 2021).
Given evidence that the PTGI may be best interpreted through a single total score (see Lee et al., 2010; Linley et al., 2007, and Osei-Bonsu et al., 2012, for evidence for a one-factor solution for the PTGI), we report results examining whether scores on the full PTGI predicted subsequent change in PTG-relevant domains (i.e., observed change). However, we also examined similar models for each of the five PTG domains.
Results
Preliminary analyses
Means, standard deviations, and sample size at each time point for PTG, C-PTG, and S-PTG are displayed in Supplementary Table 1 at https://osf.io/78jdt/. All focal variables were univariate normally distributed (no skewness or kurtosis), and quantile-quantile (Q-Q) plots suggested that, within and across waves, all focal variables were multivariate normally distributed. Correlations for PTG, C-PTG, and S-PTG at each time point are displayed in Table 3. There were no issues with multicollinearity within or across time.
Correlations Between C-PTG, S-PTG, PTG, and Demographic Variables Across Waves 1, 2, and 3
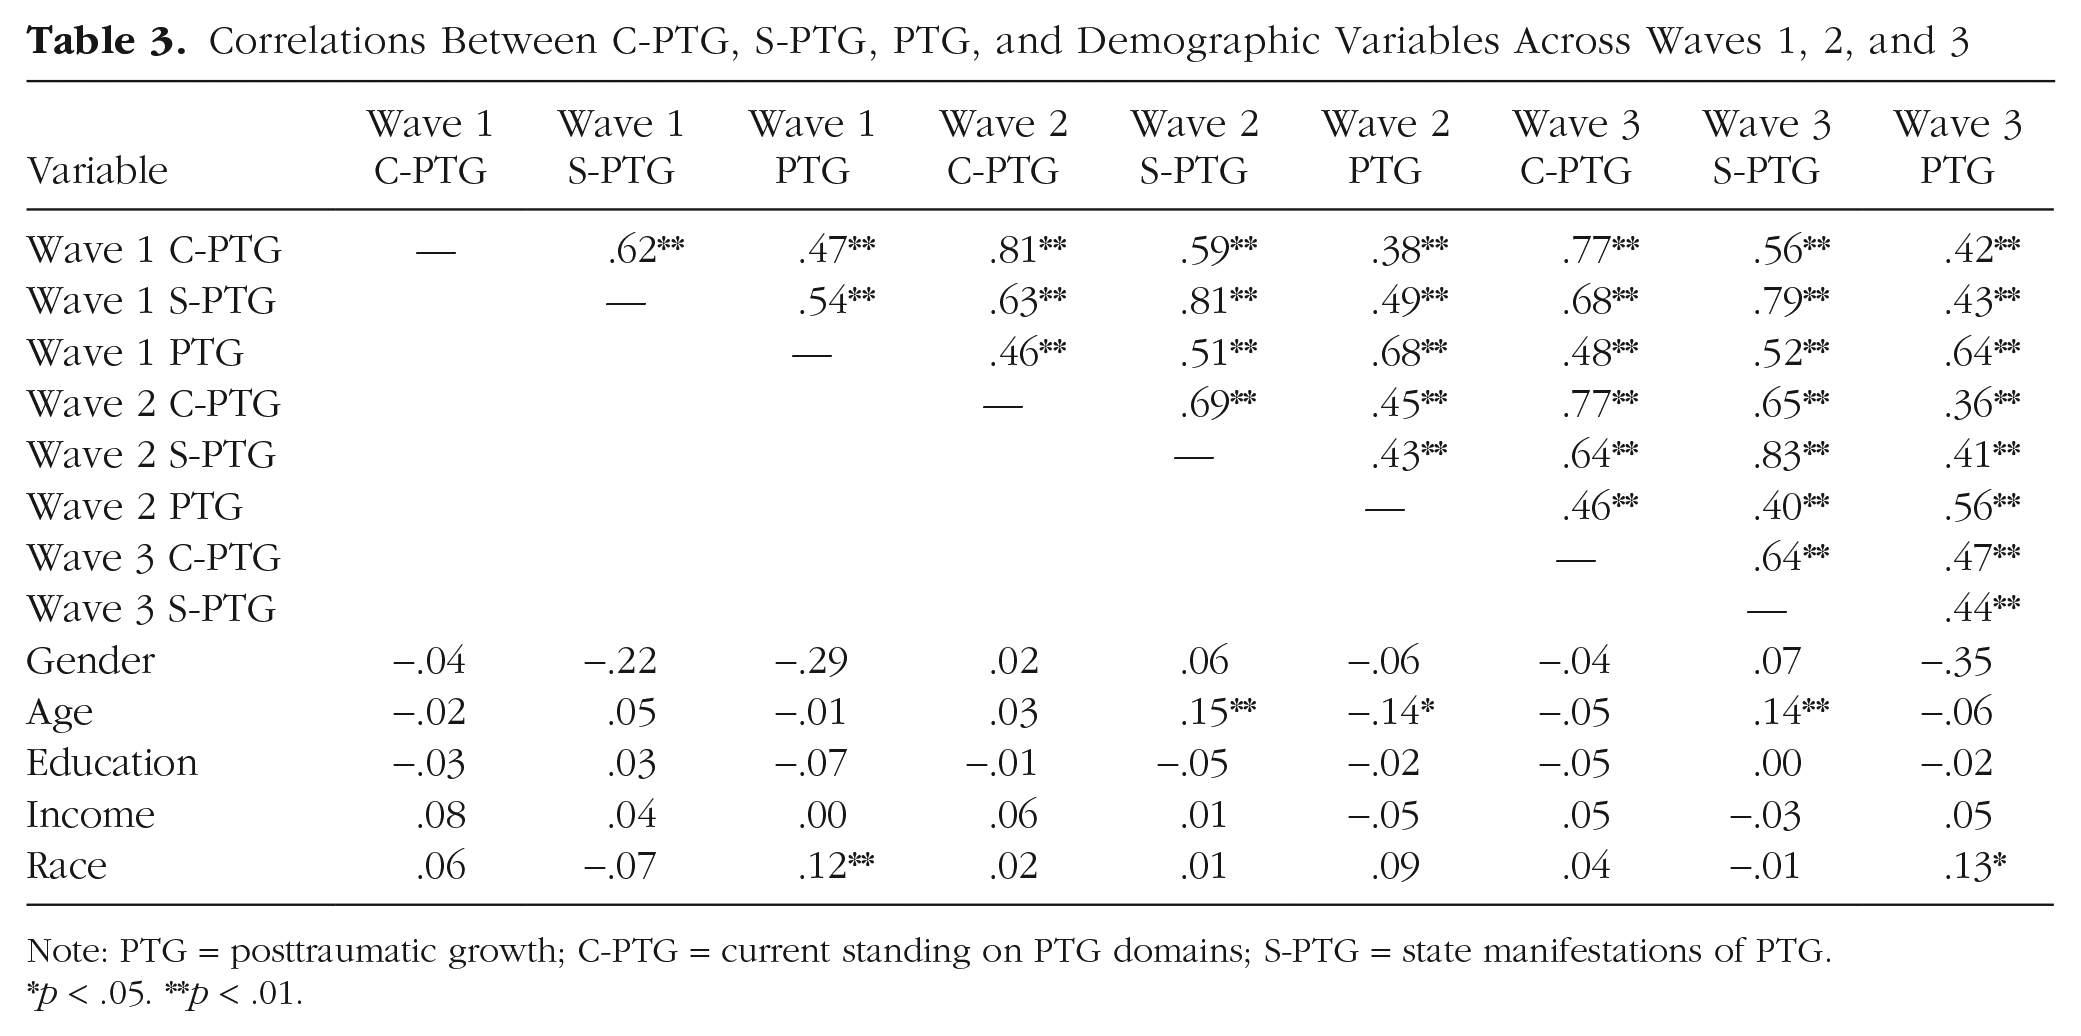
Note: PTG = posttraumatic growth; C-PTG = current standing on PTG domains; S-PTG = state manifestations of PTG.
p < .05. **p < .01.
Tests of hypotheses
Cross-lagged relations between PTG and C-PTG
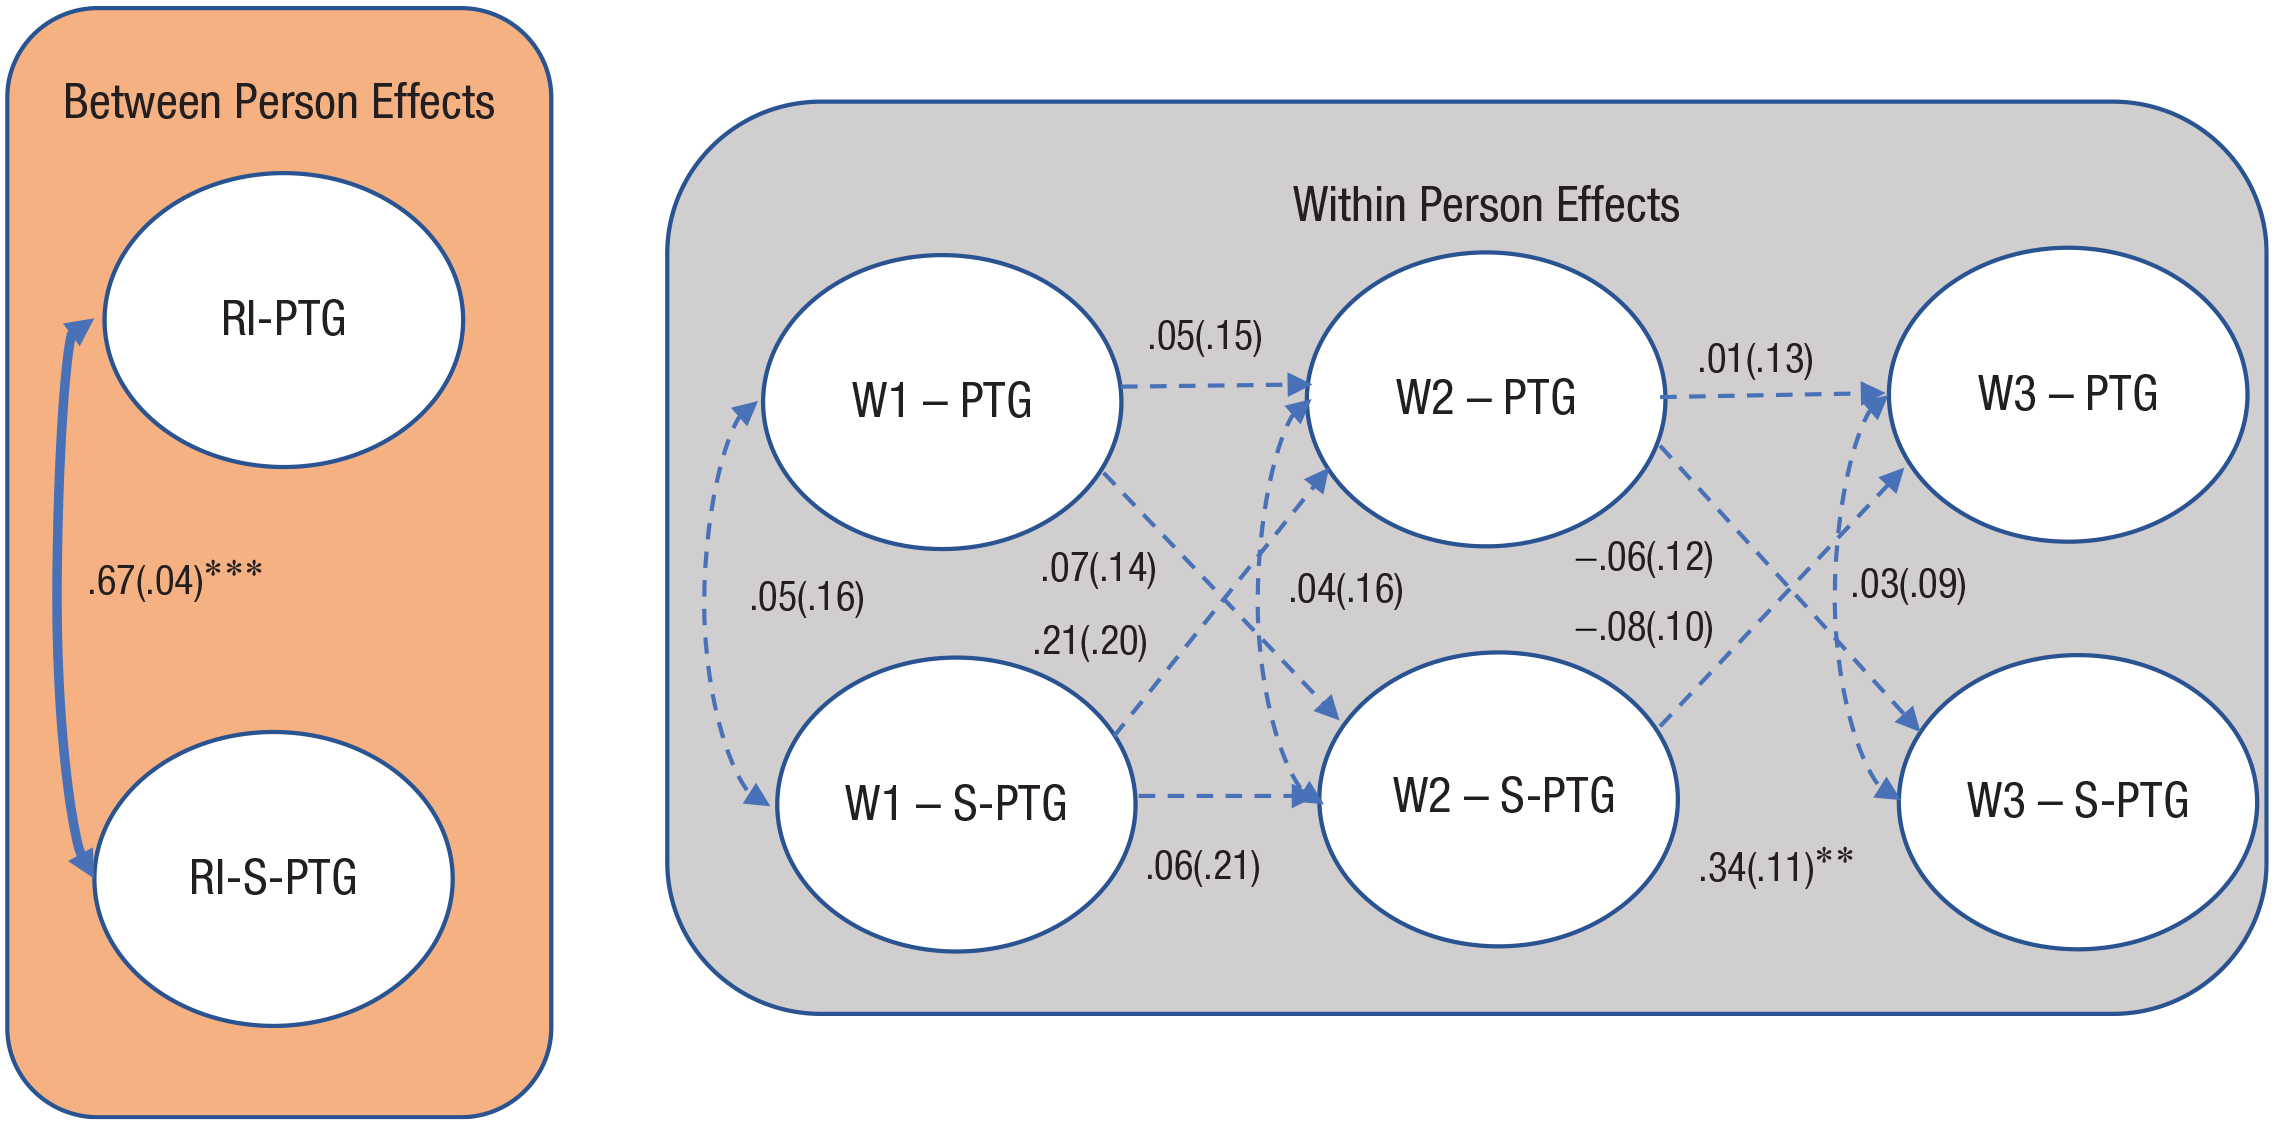
The RI-CLPM for the overall PTG and C-PTG models had excellent fit, χ2(1) = 0.46, p = .50; comparative fit index (CFI) = 1.00; Tucker-Lewis index (TLI) = 1.00; root-mean-square error of approximation (RMSEA) = 0.00 (90% confidence interval [CI] = [0.00, 0.89]; and standardized root-mean-square residual (SRMR) = 0.01. 4 Figure 1 illustrates the standardized stability and cross-lagged parameters estimated with the RI-CLPM, in addition to the between- and within-person correlations. All the within-person correlations were nonsignificant, with the exception of the within-person correlation between PTG and C-PTG at Wave 3 (r = .26, p < .01). Furthermore, no cross-lagged paths were significant between PTG and C-PTG. This suggested that there was no predictive relationship between PTG at one point and subsequent C-PTG, supporting our hypothesis.
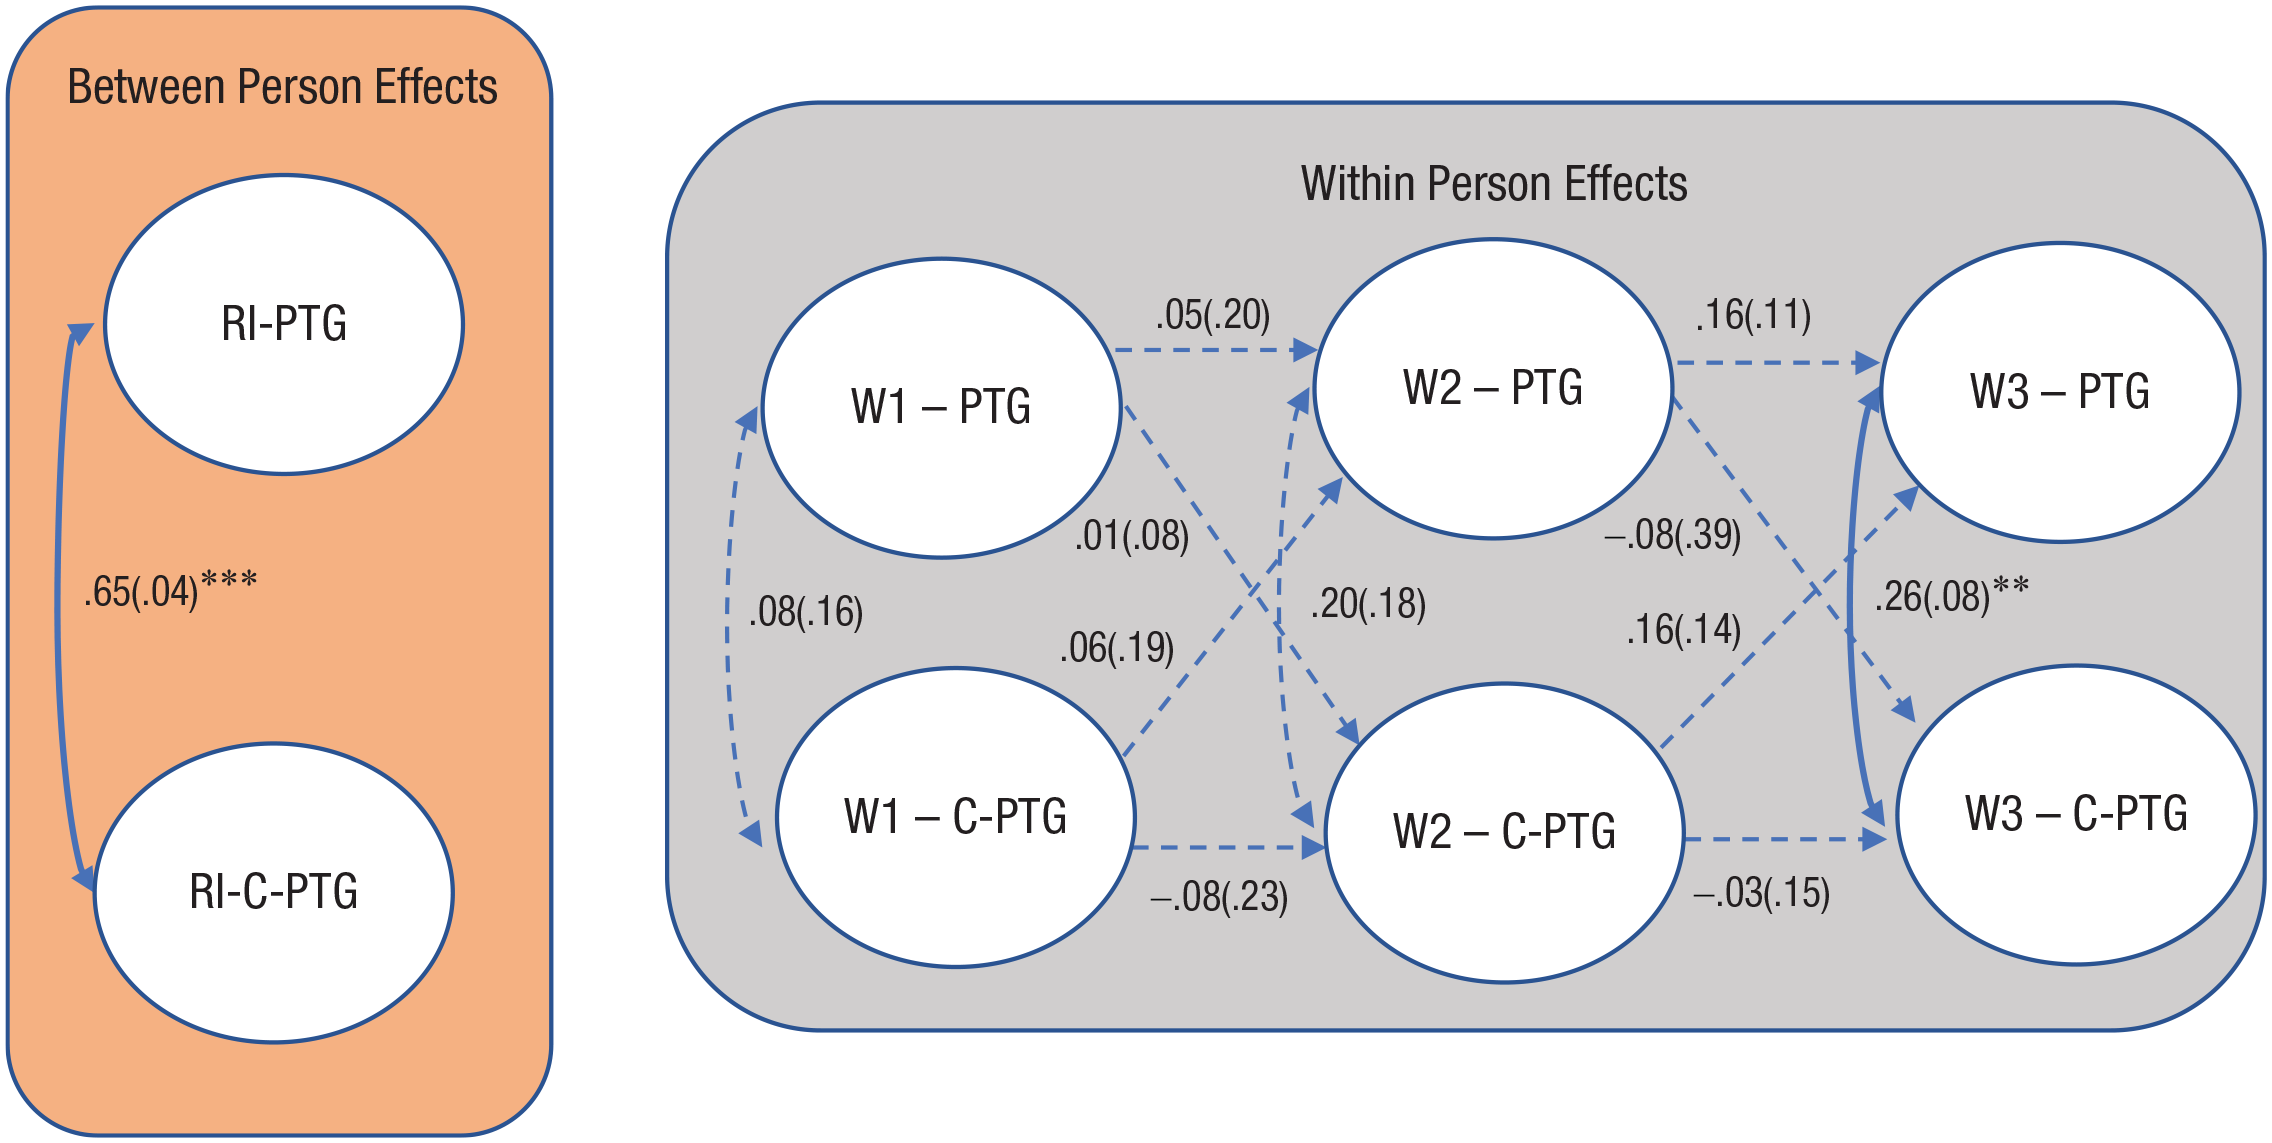
Cross-lagged effect between posttraumatic growth (PTG) and current standing on PTG domains (C-PTG) for the full scale over three waves using a random-intercept (RI) cross-lagged panel model. Standard errors are given in parentheses. Asterisks indicate significant paths (**p < .01, ***p < .001). Double headed arrows represent correlations. Single headed arrows represent standardized regression coefficients. Dashed lines represent estimated but not significant relations, solid lines represent significant relations. W = Wave.
Cross-lagged relations between PTG and S-PTG
We next conducted an RI-CLPM to examine the stability and cross-lagged paths between PTG and aggregated S-PTG from Wave 1 to Wave 3 (Fig. 2). The RI-CLPM model fit was excellent, χ2(1) = 0.43, p = .52; CFI = 1.00; TLI = 1.00; RMSEA = 0.00 (90% CI = [0.00, 0.79]); SRMR = 0.01. There was one significant stability path: S-PTG at Wave 2 positively predicted S-PTG at Wave 3 (β = 0.34, p < .01). No other within-person correlations were significant. Furthermore, no cross-lagged paths were significant between PTG and subsequent S-PTG, supporting our central hypothesis.
Cross-lagged effect between posttraumatic growth (PTG) and state manifestations of PTG domains (S-PTG) for the full scale over three waves using a random-intercept (RI) cross-lagged panel model. Standard errors are given in parentheses. Asterisks indicate significant paths (**p < .01, ***p < .001). W = Wave.
Domain-level analyses
We next examined the reciprocal and stability paths between PTG and both C-PTG and S-PTG for each of the five PTG domains (new possibilities, personal strength, improved relationships, spiritual change, and appreciation of life) using RI-CLPM models. These models are reported in the supplementary materials at https://osf.io/78jdt/. All the subscale models fitted the data well (see Supplementary Tables 3 and 4 at https://osf.io/78jdt/). In addition, there was one significant cross-lagged pathway observed in these analyses (see Supplementary Fig. 9 at https://osf.io/78jdt/): Spiritual Change S-PTG at Wave 1 significantly predicted Spiritual Change PTG at Wave 2 (β = 0.36, p < .05). However, this relation was the only significant effect of the many cross-lagged pathways tested in this study and was in the opposite direction of our main prediction (e.g., PTG predicting subsequent change in S-PTG). In sum, consistent with our hypothesis, our results showed no evidence that perceived growth predicted subsequent observed change using both current-standing and aggregated state assessments of PTG domains.
Discussion
Past research has provided compelling evidence that measures of perceived growth lack construct and predictive validity. However, does perceived growth have value in fostering subsequent “self-fulfilling” observed change? Examining this question using both subsequent current-standing and aggregated state assessments of change and RI-CLPMs, we found that the answer appears to be no. These findings thus provide further evidence for the limited utility of retrospective measures of perceived growth such as the PTGI.
One strength of the present study was the multimethod assessment of PTG for assessing observed change (i.e., current-standing and state measures). Given that theories of PTG predict transformative changes in the wake of adversity (Tedeschi & Calhoun, 2004), one should expect to observe such changes in daily life (Fleeson, 2014). The use of multiple assessments for measuring change provided a stringent test of the validity of the PTGI as a measure of change by assessing changes in both one’s current standing on PTG-relevant domains (as assessed by the C-PTGI) and aggregated manifestations of thoughts, feelings, and behaviors associated with PTG (as assessed by the S-PTG measure).
The finding that perceived growth did not predict subsequent changes in either current-standing or aggregated state assessments of growth-relevant domains extends past research suggesting the limited mental health benefits of perceiving growth in the wake of major negative life events (e.g., Marziliano et al., 2020; Shand et al., 2015). The present results raise important questions regarding the predictive validity of perceived growth. As we noted earlier, research on PTG has previously conflated perceived growth and observed change (Tennen & Affleck, 2009), despite the fact that perceived growth is not strongly associated with observed change and perceived and actual change are differentially associated with distress (e.g., Frazier et al., 2009). The present results add to this literature by suggesting that perceiving growth does not lead to a self-fulfilling process promoting observed change, at least in the short term. We suggest that, in light of these findings, measures of PTG such as the PTGI should be viewed as lacking predictive validity with regard to subsequent improvements in growth-relevant domains. Additionally, these results suggest that clinical interventions targeting perceived growth as an outcome (see Roepke et al., 2021, for a review of such interventions) may have limited utility in promoting mental health. More generally, the present study builds on past work (e.g., Engelhard et al., 2015; Park et al., 2022; Zalta et al., 2017) challenging the predictive validity of perceived growth with an innovative approach involving two assessments of observed change as well as analyses using RI-CLPMs.
Despite the innovative measurement-burst design of the present study, we acknowledge some limitations. First, although quite representative of the general population in terms of multiple characteristics (e.g., race), the sample was predominantly female. We also note that these results focus on responses to a single major negative event and not all of them met the criteria for a traumatic life event. Participants may have experienced other events over the course of the study, which might make it difficult for them to attribute growth or change to one specific event. In addition, future research should replicate these findings in other cultures where beliefs about growth and redemption from adversity may differ from those in the U.S. context (Blackie & McLean, 2022).
Second, we examined the relation between perceived growth and observed change over a 6-month period. However, we note that most theoretical accounts of PTG do not specify how time should be scaled, how many assessments are needed to test theoretical predictions, how frequently assessments should occur, and when assessments should happen (Hopwood et al., 2022; see also Weststrate et al., 2021, Table 2). Future theoretical work is needed to clarify the precise trajectories of change to be expected after trauma, along with research using different frequency and timing of longitudinal assessments.
Another limitation is that there was attrition across the waves of the study. Although the 78.3% participation rate from intake to at least one of the three waves of the study (as well as the 60.8% completion rate from Wave 1 to Wave 3) compares favorably with other studies with intensive longitudinal designs (~50%; Jayawickreme, Blackie, et al., 2021), we acknowledge that this still represents a substantial level of attrition. We note, however, that with the exception of the analytic sample being older in age, attrition analyses suggested that this sample did not differ meaningfully from the initially recruited sample.
We further acknowledge the methodological limitations of using a life-events checklist to assess adverse events (Jayawickreme, Infurna, et al., 2021). The concordance between life-events checklists and life-events interviews has been estimated at less than .50 (e.g., Monroe, 2008), which likely reflects fundamental errors in the self-reporting of life events. Although there are resource-based limitations to using interviews to ascertain the impact of life events on individuals, interview-based measures are far superior to life-events checklists (e.g., Dohrenwend, 2006) and should be employed in future replications and extensions of this research.
Finally, we also note that the PTGI employs an exclusively positive rating scale, which may have the effect of inflating reports of perceived growth (Boals, 2023; Boals & Glidewell, 2023). Different results may have been observed with assessments that use an altered response scale that includes both positive and negative options (i.e., the option to report both positive and negative change). Future research should replicate the present findings with assessments of perceived change that use both positive and negative wording (e.g., Boals & Schuler, 2018; Nordstrand et al., 2017).
In summary, the present study provides evidence that perceived growth does not predict subsequent observed change in the short term. Future research should move beyond the methodological limitations of perceived growth assessments and strive to understand with greater methodological precision how people can recover, and potentially benefit, from adversity (Tennen & Affleck, 2009).
Footnotes
Transparency
Action Editor: Tamika C. Zapolski
Editor: Jennifer L. Tackett
Author Contributions