
Abstract
For many students, the COVID-19 pandemic caused once-in-a-lifetime disruptions of daily life. In March 2020, during the beginning of the outbreak in the Netherlands, we used ecological momentary assessment to follow 80 undergraduate students four times per day for 14 days to assess mental health, social contact, and COVID-19-related variables. Despite rapidly increasing rates of infections and deaths, we observed decreases in anxiety, loneliness, and COVID-19-related concerns, especially in the first few days. Other mental health variables, such as stress levels, remained stable, whereas depressive symptoms increased. Despite social-distancing measures implemented by the Dutch government halfway through our study, students showed no changes in the frequency of in-person social activities. Dynamic network models identified potential vicious cycles between mental health variables and being alone, which predicted concerns about COVID-19 and was followed by further mental health problems. Findings and implications are discussed in detail.
Keywords
About 75% of all severe mental health problems develop before the age of 24 (Kessler et al., 2005), and many studies have documented that students report consistently higher levels of mental health problems than the general population (Denovan & Macaskill, 2016; Gaspersz et al., 2012; Mortier, Auerbach, et al., 2018; Stallman, 2010; Tomoda et al., 2000; Tran et al., 2017; Williams et al., 2018). Paired with the fact that student samples are convenient to recruit, this has led to a considerable body of research on understanding, predicting, and preventing stress and mental disorders in students.
Mental health problems in students are related to considerable impairment of functioning, decreased academic performance and life satisfaction, higher levels of physical comorbidities, increased college dropout, and increased levels of smoking, alcohol, and drug abuse (Ebert et al., 2019; Ribeiro et al., 2018). Two international World Health Organization surveys documented 1-year prevalence rates of mental illness among students of between 20% and 31%. Anxiety and mood disorders are among the most prevalent problems, often start in early to middle adolescence, and persist into higher education (Auerbach et al., 2016, 2018). The North-American College Health Intervention Project estimated that 25% of college students experience symptoms of depression and that 10% experience suicidal thoughts (Mackenzie et al., 2011). In data of more than 2,500 college freshmen collected in Belgium, the 1-year incidence rates were about 7% for major depression (Ebert et al., 2019), 5% for suicidal thoughts and behaviors (Mortier, Demyttenaere, et al., 2018), and 10% for nonsuicidal self-injury (Kiekens et al., 2019). The U.S.-based National Epidemiological Study on Alcohol and Related Conditions used face-to-face interviews to assess mental health conditions in 5,092 young adults ages 19 to 25 (Blanco et al., 2008). The authors concluded that “almost half of college-age individuals had a psychiatric disorder in the past year” (Blanco et al., 2008, p. 1429) and identified no overall differences when comparing college students and their non-college-attending peers. However, there is scarce epidemiological work dedicated to this comparison.
Although the literature on student mental health has been growing rapidly, only a minority of work consists of prospective stress studies that follow participants during periods of considerable stress (Bolger et al., 2000), such as residency in medical students (Fried et al., 2014; Guthrie et al., 1998). Of those studies, there are only a handful to date that used daily diary or ecological momentary assessment (EMA) methods (e.g., via smartphones) to assess the impact of stressors on students’ daily lives. The few existing studies have focused primarily on U.S. presidential elections and other U.S. events (e.g., the Las Vegas shooting; Frank et al., 2019; Roche & Jacobson, 2019). The idea of tracking participants in daily life is many decades old and was formally introduced by Larson and Csikszentmihalyi (1983) as “a research procedure that consists of asking individuals to provide systematic self-reports at random occasions during the waking hours of a normal week [to obtain] reports about people’s experiences as they occur” (p. 41). Broadly speaking, EMA increases ecological validity compared with retrospective reporting, reduces recall bias and memory distortions, and allows collection of data at the within-subjects level (Almeida, 2005). Over the years, EMA has been used in various areas of research, including psychology (Wichers et al., 2015), psychiatry (Kramer et al., 2014), epidemiology (van der Krieke et al., 2016), and organizational research (Beal, 2015). Today, the widespread use of wearable technology such as smartphones and smartwatches allows easy integration of EMA into daily lives.
Returning to student mental health, the etiology of mental health problems in students is diverse and includes stressors such as financial problems (Heckman et al., 2014), academic pressure (Misra & McKean, 2000), adjusting to new social and geographical environments (Montgomery & Cote, 2003), relationships, life-stage transitions, and time management (Wilks et al., 2010). One massive recent stressor is the COVID-19 pandemic, and early work indicates increases of mental health problems across the globe (Ettman et al., 2020; Jacobson et al., 2020; Nelson et al., 2020; Twenge & Joiner, 2020). In the Netherlands, where we collected our data, the first wave of the COVID-19 pandemic led to severe disruptions of public life. Requests for public transport information in March dropped by 75%, and the number of COVID-19 infections and deaths grew rapidly from 10 to 12,595 and from zero to 1,038, respectively (Fig. 1). The pandemic was accompanied by public-health measures announced by the Dutch Government (2020), potentially causing novel, once-in-a-lifetime stressors for students, including ban of public gatherings; ban of nonessential international travel; closing of, among others, universities, schools, restaurants, cinemas, and gyms; shortage of some basic supplies because of mass purchases; health concerns about family and friends; and economic concerns. Our goal was to study the impact of these stressors on student mental health.
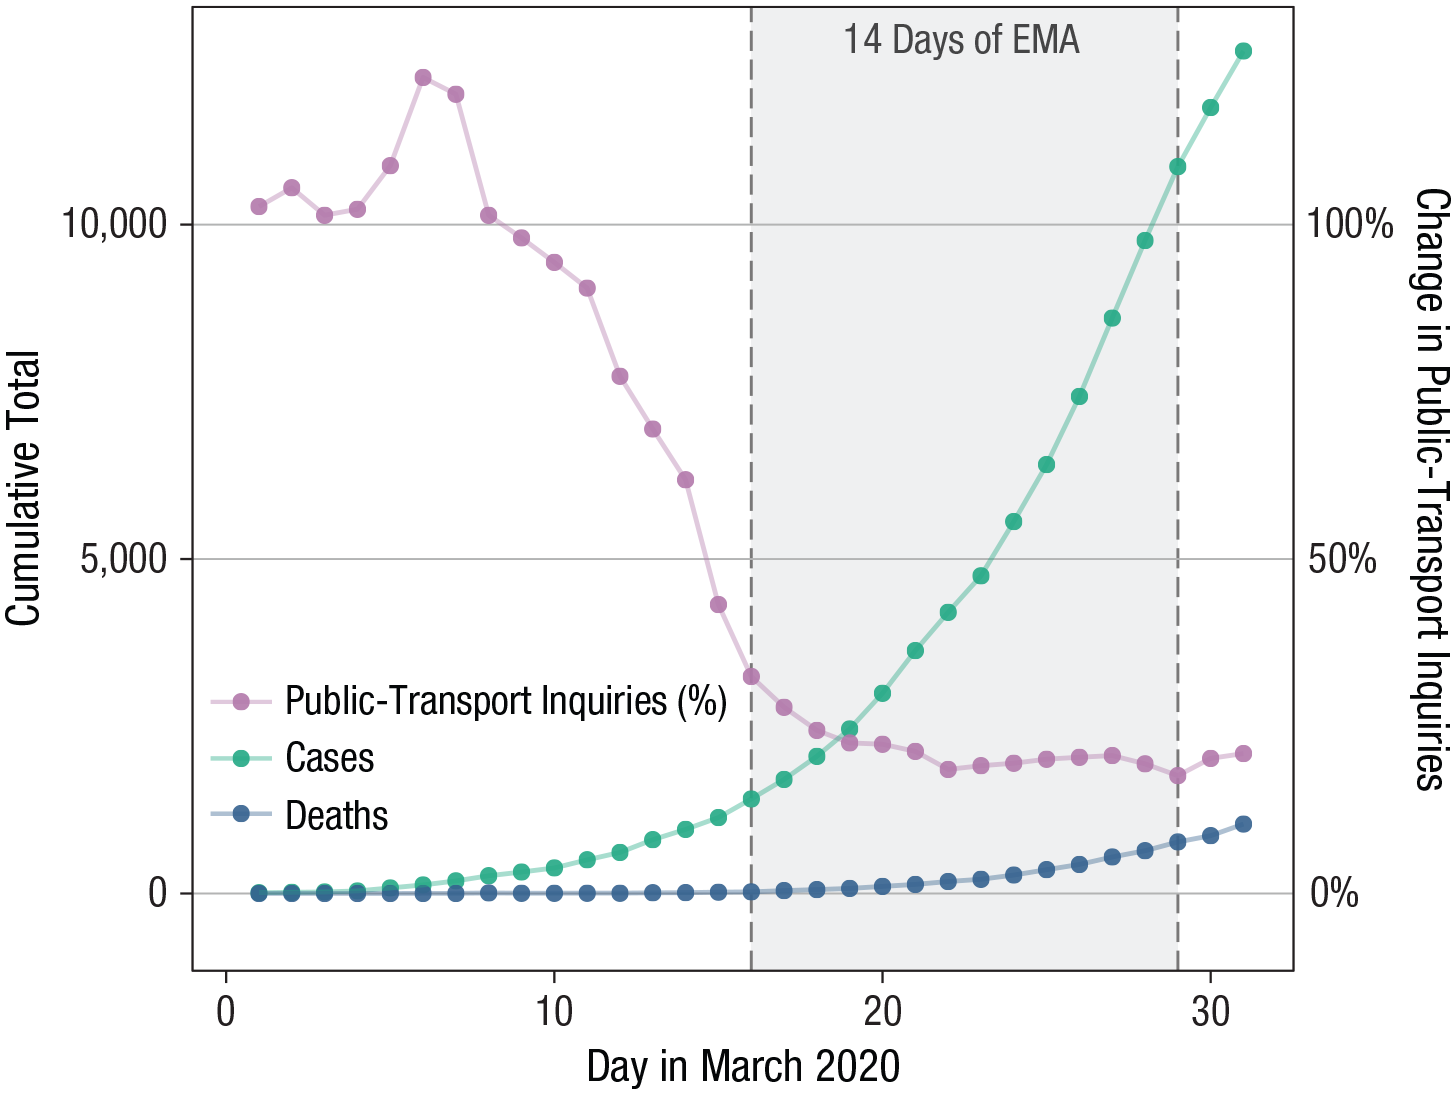
Relation between COVID-19 prevalence and public-transport inquiries in the Netherlands. The percentage of Apple Maps inquiries about public transport in the Netherlands (compared with January 2020) is plotted (right y-axis) as a proxy for disruption of normal daily life (Apple, n.d.). COVID-19 case and death rates in the Netherlands (Worldometer, n.d.) are plotted (left y-axis). The shaded area represents the period of the ecological momentary assessment study. The Dutch government imposed lockdown measures on March 12, 2020, and strengthened these measures considerably on March 23, 2020, halfway through our assessment.
We followed 80 undergraduate students enrolled at Leiden University closely over the course of 2 weeks by using EMA. After a battery of questions at baseline, we queried students about mental health problems, social contact and isolation, and concerns about the pandemic. Contrasting many prior EMA studies that assessed experiences once per day, we zoomed into the daily lives of participants by asking them how they are doing right now four times per day. We concluded the study with a short exit survey, including information on COVID-19 diagnosis, mental health, implementation of social-distancing and personal hygiene behaviors, and whether students felt well informed by Leiden University and the Dutch government.
These data allowed us to answer three questions. First, what is the general frequency of mental health problems, social behaviors, and pandemic-related concerns in the 2 weeks following a university shut down—and do these variables change over time? Second, what variables predict changes in mental health over the 2-week study period? And third, what are the potential causal relations among these variables (e.g., do COVID-19 concerns lead to higher levels of mental health problems at the next measurement point)? We answered the third question by estimating dynamic network models, consistent with the network approach to psychopathology (Borsboom, 2017; Fried & Cramer, 2017; Robinaugh et al., 2019).
Given the novelty of the COVID-19 pandemic and little previous work studying prospective stressors via EMA, we have no a priori hypotheses except that the pandemic has adverse effects on student mental health. Our primary goal for this article is to faithfully report on the collected data in an exploratory way. We share all data, code, and measures online (https://osf.io/erp7v/files/).
Method
Procedure and timeline
The study took place between March 11, 2020, and April 4, 2020, and was conducted in three parts. First, participants completed a 45-min baseline assessment, which was required to continue to the second stage: 2 weeks of EMA. This stage lasted from Monday, March 16 (university closed on Friday, March 13) to Sunday, March 29. During this period, participants received a prompt on their smartphones four times per day (noon, 3 p.m., 6 p.m., and 9 p.m.). Each assessment lasted approximately 2.5 min, and participants had to answer the prompt within 60 min, after which it expired. Third, participants completed a 20-min postassessment survey, available from March 29 to April 5. No manipulations took place. All assessments were conducted via Ethica Data, a data collection platform available on both Android and iOS that participants installed on their smartphones.
Shortly before our EMA data collection started, the Dutch government announced two sets of measures with potential impact on social contact and mental health, on March 12 and 15. Universities starting teaching remotely, social contact indoors and outdoors was allowed only if 1.5-m distance could be guaranteed, gatherings of more than 100 people were canceled, and work from home was encouraged. Supermarkets and similar stores remained open. Halfway through our EMA data collection, on March 23, the government announced a stricter set of rules: People were encouraged to stay at home except for essentials (fresh air, groceries, going to the doctor); only three visitors were allowed at home; if one person in a household showed COVID-19-related symptoms, everybody was to stay at home; and some additional stores and services, such as hair salons, closed. On the fourth day of our EMA data collection, on March 20, Leiden University announced it would be closed at least until the end of the semester.
Participants
We recruited participants in the week following March 4 through online advertisements on social networks, posters, and flyers distributed in the Faculty of Social Sciences of Leiden University or through direct approach by the researchers. Participants were students at Leiden University and were reimbursed for participation with study credits and the chance to win one of four 25€ vouchers. Students received credits proportional to completed EMA surveys. Out of the 100 initially recruited participants, 84 completed the baseline survey, 79 completed the EMA surveys, and 80 completed the postassessment; we include the 80 participants who completed both preassessments and postassessments in this study. The study was approved by the Ethics Board of Leiden University, Faculty of Social and Behavioral Sciences.
Of the 80 students, 60 identified as female, 19 as male, and one as “other,” with a mean age of 20.38 years (SD = 3.68, range = 18–48). There was a mix of 19 nationalities, the most common of which were Dutch (n = 36), German (n = 16), and Finnish (n = 7). Most students were single (n = 50), and fewer were in a relationship (n = 27) or married (n = 3). The large majority of students were first-year undergraduates (n = 68) enrolled in psychology (n = 70). Seventeen students reported having suffered from mental health problems in the past or having taken psychiatric drugs; 26 students were employed. To assess the representativeness of our sample compared with Leiden University undergraduate students in general, we were able to obtain information on sex, age, and nationality for all 2,039 psychology undergraduates enrolled at Leiden University 2019–2020. Mean age was 21.32 years (range = 17–54); there were 1,573 female (77%) and 466 male (23%) students, which compares well with our sample (75% female, 24% male, 1% other). Of these students, 1,394 were Dutch (68%), which means that our sample (48% Dutch) oversampled international students. This is likely because our recruitment and study were carried out in the English language.
Measures
All measures can be found online (https://osf.io/erp7v/files/). The current article reports only selected items of specific interest for our research questions; full data are available online, except for some data we removed to guarantee anonymity.
Baseline and follow-up assessments
The baseline survey consisted of 159 questions in which participants were asked about, among other things, their age, gender, relationship status, employment status, nationality, and prior mental health issues. In addition, we assessed several constructs for which we used, in part, adapted or shortened versions of original scales to decrease participant burden: previous-week depressive symptoms, anxiety symptoms, and stress (Depression Anxiety Stress Scale [DASS-21], e.g., “In the past week I felt down-hearted and blue”; Lovibond & Lovibond, 1995); previous-month perceived stress (10-item Perceived Stress Scale, e.g., “In the last month how often have you felt nervous and stressed”; Cohen & Williamson, 1988); general loneliness (five items from the eight-item revised UCLA Loneliness Scale, e.g., “I feel isolated from others”; Russell et al., 1980); frequency of social in-person activities (“On average how many hours a day do you spend engaged in voluntary in-person social activity”); and self-efficacy (10-item General Self-Efficacy Scale, e.g., “I can usually handle whatever comes my way”; Schwarzer & Jerusalem, 1995).
During follow-up, we queried participants on 74 items. Variables included symptoms of COVID-19 and COVID-19 diagnoses of the participant, close family members, and friends; perceived impact of the COVID-19 pandemic on mental health and whether actions taken by Leiden University affected students’ stress levels; and how well informed students felt by Leiden University and the Dutch government about the COVID-19 pandemic and ways to combat it. In addition, we queried students again on the DASS-21 and the adapted loneliness scale.
EMA
We queried participants how much, over the previous 3 hr, they endorsed a certain feeling or behavior (1 = not at all, 2 = slightly, 3 = moderately, 4 = very, 5 = extremely) or how much time they spent on a certain activity (1 = 0 min, 2 = 1–15 min, 3 = 15–60 min, 4 = 1–2 hr, 5 = >2 hr); for all 14 variables, see Table 1. The mental health items were adapted from the DASS-21/DASS-42 (Lovibond & Lovibond, 1995) and the Generalized Anxiety Disorder Scale (Spitzer et al., 2006); other items were created for the purpose of this study on the basis of our experiences with prior EMA undergraduate projects we conducted in 2018 and 2019 with student populations in the Netherlands. No additional training was provided to participants (e.g., about how to interpret items).
Ecological Momentary Assessment Items, Queried Four Times per Day Over 2 Weeks
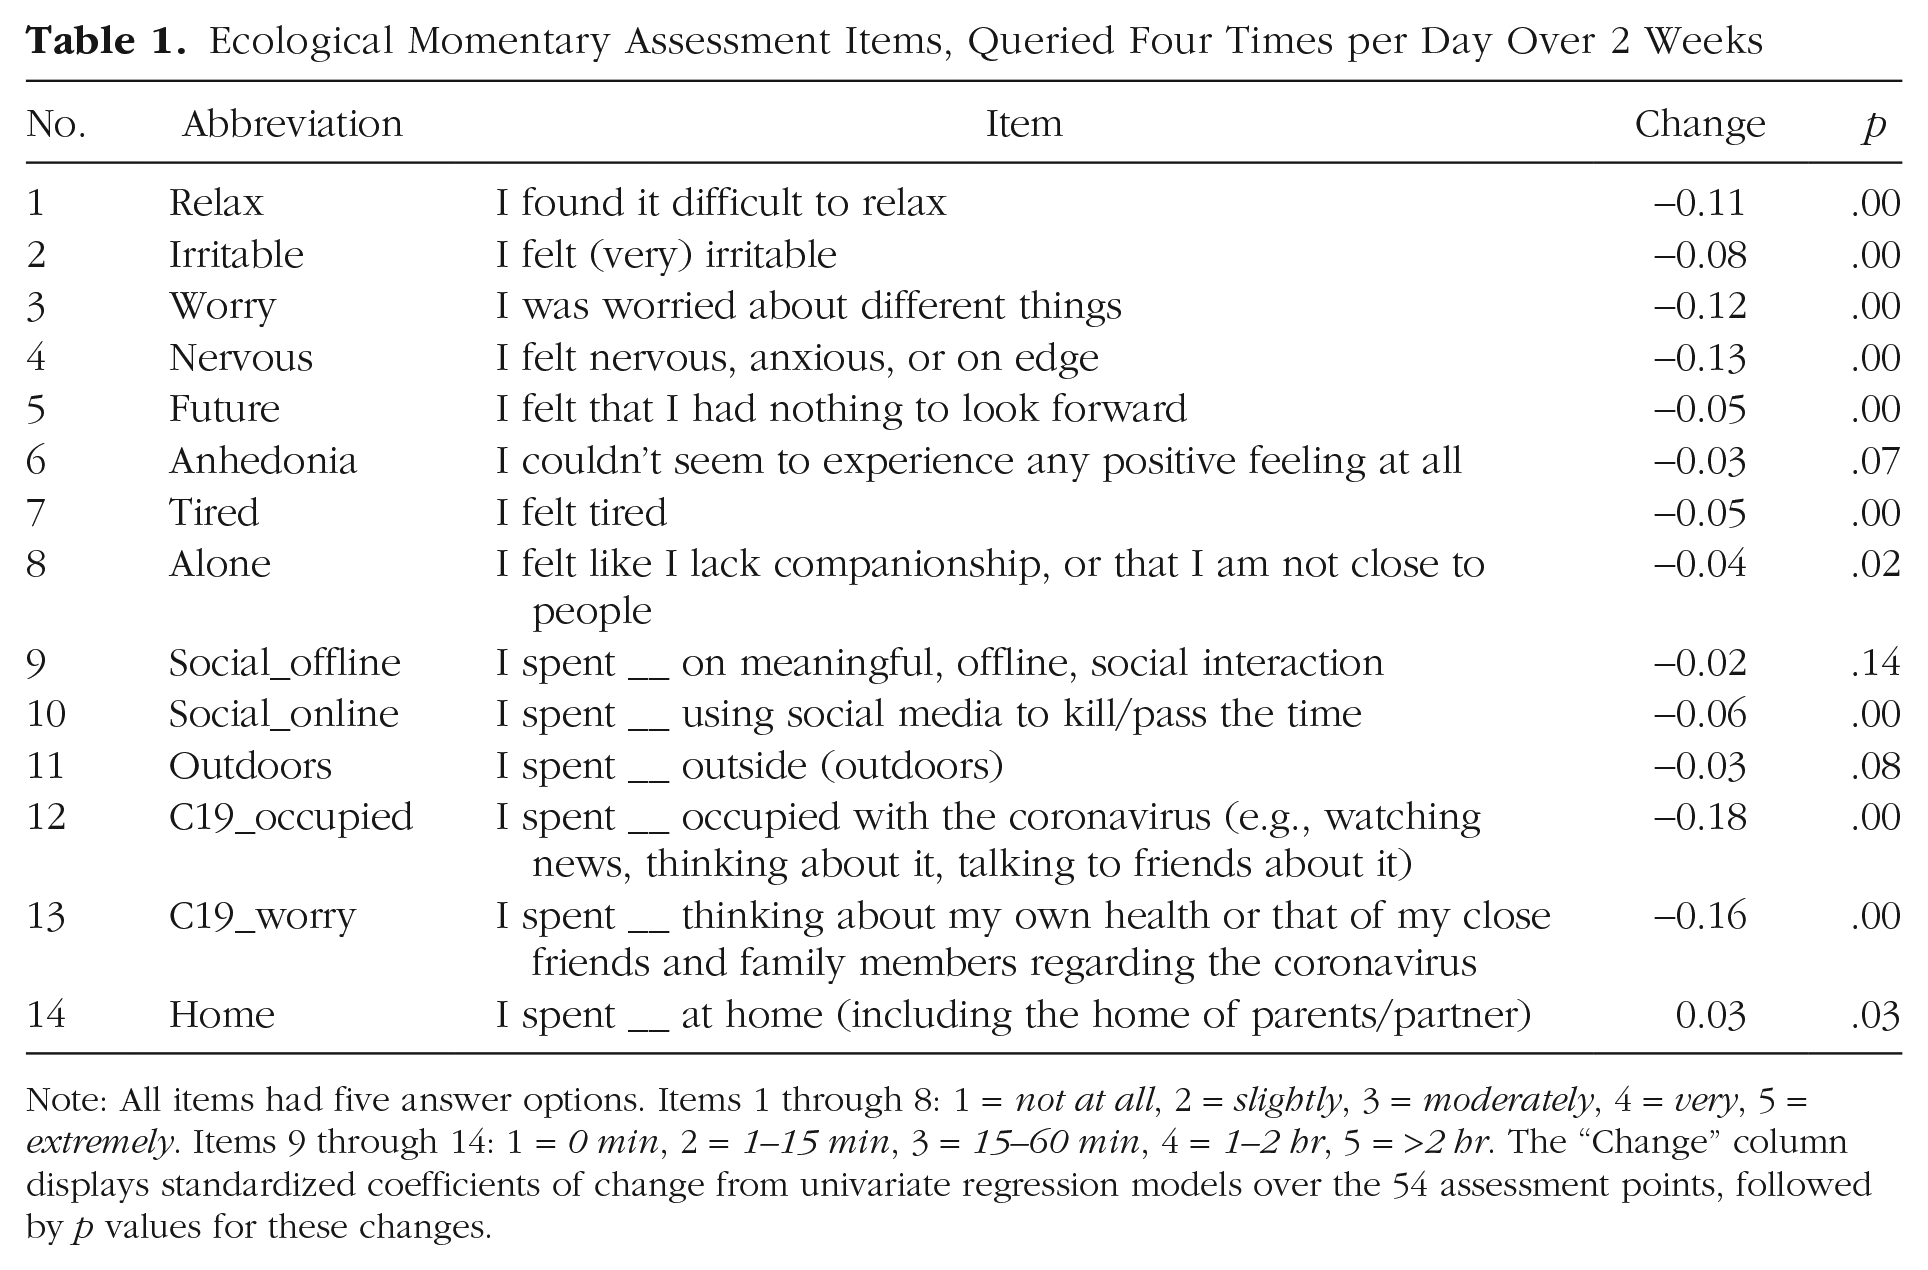
Note: All items had five answer options. Items 1 through 8: 1 = not at all, 2 = slightly, 3 = moderately, 4 = very, 5 = extremely. Items 9 through 14: 1 = 0 min, 2 = 1–15 min, 3 = 15–60 min, 4 = 1–2 hr, 5 = >2 hr. The “Change” column displays standardized coefficients of change from univariate regression models over the 54 assessment points, followed by p values for these changes.
Statistical analyses
All analyses were carried out in the free statistical environment R. Data and syntax are available online (https://osf.io/erp7v/files/).
We used paired t tests and Cohen’s d as an effect size measure to investigate whether DASS-21, the three DASS-21 subscales (depression, anxiety, and stress), and loneliness changed in the 2 weeks between baseline and exit surveys. We estimated a multiple regression model to predict changes in DASS-21 from preassessment to postassessment using the predictors gender, age, nationality, relationship status, working, prior mental health issues, self-efficacy, perceived stress, loneliness, and being socially active, controlling for DASS-21 at baseline. Missing data for the above analyses were deleted listwise.
For estimation of dynamic network models, we used two-step multilevel vector autoregression (mlVAR; Epskamp et al., 2018), a model in which all variables at a given time point are regressed on variables of the previous assessment. Predictors are within-persons centered, and sample means are added as predictors to separate within- and between-persons variance; residuals are used in a second step to investigate contemporaneous relationships. This leads to two networks. First, the temporal network estimates lag-one associations between all items after controlling for all other lagged associations. This provides statistical relations that can be interpreted as Granger-causal: how well an item predicts other items at the next time point after taking into account all other variables (Granger, 1969). Second, the contemporaneous network partials out all temporal relations and then estimates the unique relations among all items within the same time window. A third network returned by two-step mlVAR, the between-persons network, was not investigated because of our relatively low sample size. We displayed the results of network models in graphs that contain nodes (variables) and edges (statistical relationships described above). The temporal model features directed edges, and the contemporaneous network featured undirected edges. Two-step mlVAR requires stationarity. We detrended the data by fitting fixed effects linear regression models to each variable, regressing out a linear trend on day number (i.e., general increases in variables over time) and a categorical effect on measurement per day (i.e., fluctuations of variables from morning to evening) at an α of .05.
The obtained linear trends from the detrending procedure (i.e., the question of whether slopes were different from zero) were used in determining whether EMA items changed over time and are provided in Table 1. To investigate whether individuals differed in these trends, we used univariate multilevel regression models, including fixed and random effects, detailed online (https://osf.io/erp7v/files/).
Results
Mental health comparison of baseline and exit surveys
We identified no changes for DASS-21 scores in the 2 weeks from baseline (M = 15.03, SD = 9.08) to study exit (M = 14.57, SD = 8.75), t(76) = 0.45, p = .66, d = 0.05. Analyzing the three DASS-21 subscales revealed significant increases for depression, from M = 4.46 (SD = 3.80) to M = 5.62 (SD = 4.29), t(76) = 2.33, p = .02, d = 0.27; significant decreases for anxiety, from M = 3.64 (SD = 3.22) to M = 2.73 (SD = 2.85), t(76) = 2.87, p = .005, d = 0.33; and no significant changes for stress, from M = 6.93 (SD = 4.09) to M = 6.22 (SD = 3.74), t(76) = 1.72, p = .09, d = 0.20. According to the DASS-21 cutoffs, depression scores increased from the normal to the mild depression range, anxiety scores decreased from the mild anxiety to the normal range, and stress scores stayed in the normal range. We saw decreases for loneliness scores from preassessment (M = 11.65, SD = 3.92) to postassessment (M = 10.86, SD = 3.90), t(76) = 3.14, p = .002, d = 0.36.
We predicted change in DASS-21 scores from preassessment to postassessment by gender (n = 60 female, n = 19 male), age, nationality (n = 36 Dutch, n = 44 international), relationship status (n = 50 single, n = 30 partnered), working (n = 54 no, n = 26 yes), prior mental health issues (n = 59 no, n = 17 yes), self-efficacy (M = 28.9, SD = 3.93), perceived stress (M = 30.34, SD = 3.36), loneliness (M = 11.65, SD = 3.93), and in-person social activities (M = 3.78, SD = 1.3). None of the variables predicted significant changes except for a negative coefficient for DASS-21 at baseline that we controlled for, b = −0.66, t(62) = −5.12, p < .001; overall, F(11, 62) = 3.71, p < .000, adjusted R2 = .29. The negative relation can likely be explained by regression to the mean, in which higher baseline scores predict decreases (i.e., negative changes).
EMA variables
For the 14 EMA variables over 56 time points, 6,026 of the 61,208 data points (9.9%) were missing. Abbreviations for EMA items and characteristics of change over time are detailed in Table 1 and Figure 2a. Overall, 10 variables significantly decreased over the 2 weeks, one variable significantly increased (home), and three variables (anhedonia, social_offline, outdoors) remained stationary. Note that these are analyses at the group level; for a detailed analysis of how items changed over time on the idiographic level, see online (https://osf.io/erp7v/files/). We observed the largest decreases for the items C19_occupied (β = −0.18), C19_worry (β = −0.16), nervous (β = −0.13), and worry (β = −0.12), all ps < .001; the increase for home was 0.03 (p = .03). It may appear contradictory if considering only p values that home increased when outdoors remained stable, but the standardized coefficients were the same (–0.03, p = .08 for outdoors). We also identified significant cyclic patterns within days for the five variables tired, social_offline, outdoors, home (p < .001), and worry (p = .02). This means that variables showed consistent daily variations (e.g., participants tended to be at home more during morning and evening assessments compared with noon and afternoon assessments; Fig. 2b).
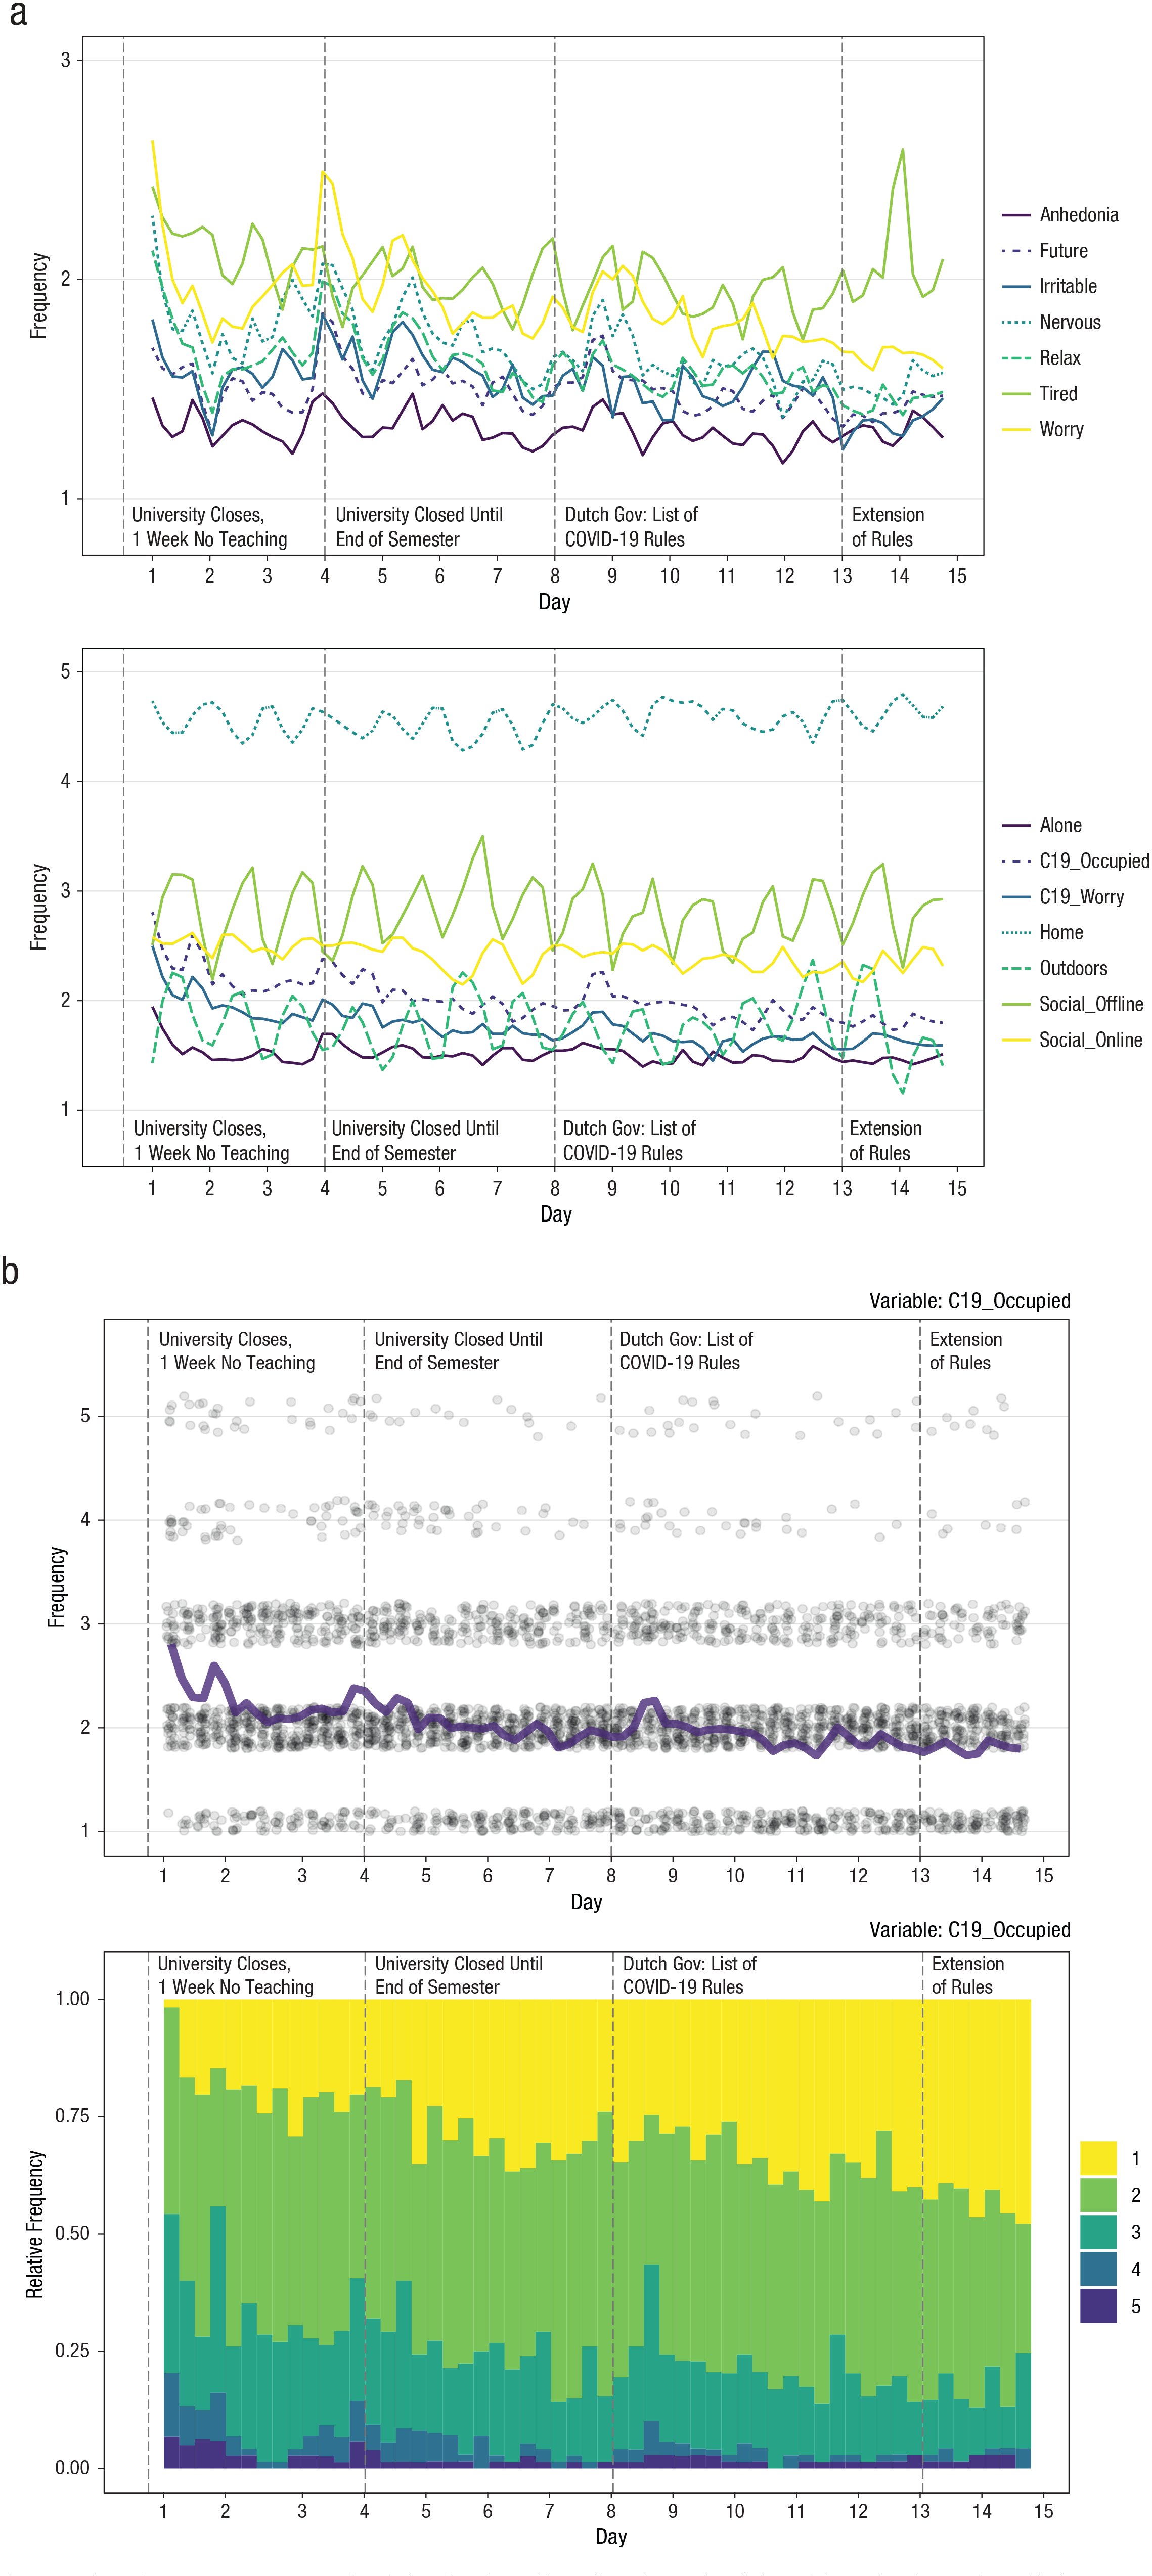
Ecological momentary assessment (EMA) data for 14 variables collected over the 14 days of the study. The graphs in (a) show mean scores on the self-report items for (top) mental-health-related variables and (bottom) social and COVID-19-related variables. Participants responded four times per day using a scale from 1 to 5 (higher scores indicate greater severity or frequency). The graphs in (b) show results for the item C19_occupied: “in the last 3 hours, I spent __ occupied with the coronavirus (e.g., watching news, thinking about it, talking to friends about it)” (1 = 0 min, 2 = 1–15 min, 3 = 15–60 min, 4 = 1–2 hr, 5 = >2 hr). In the top graph, dots indicate individual responses, and the heavy purple line indicates the mean. The bottom graph shows the relative frequencies of ordinal responses. Detailed item descriptions can be found in Table 1.
We plotted in detail how each item evolved over time (see figures online: https://osf.io/erp7v/files/). Focusing on the item with the strongest decrease, C19_occupied, reveals that on Day 1, nearly no students indicated the lowest response category, whereas nearly half of the students endorsed this response on the final day of the study 2 weeks later (Fig. 2b). We used univariate multilevel regression models to obtain information on interindividual differences and found that 83% of the students showed a decrease for C19_occupied and that 57.6% showed a decrease with a standardized coefficient below −0.1. Results were similar for C19_worry: 76.2% and 50.6%, respectively. This means that decreases on the group level were not driven by a few individuals. These analyses also provided evidence for large heterogeneity across participants in autoregressive effects, described in more detail online (https://osf.io/erp7v/files/). For 10 of the 14 EMA variables, models with random effects on the lagged variables were preferred over simple models with fixed effects.
Network model
The evolution of means over time in Figure 2 indicated some strong patterns; for instance, there seemed to be a strong inverse relation between the means of social_offline and home. To investigate these relations further, we estimate contemporaneous and temporal network models that depict conditional dependence relations of all variables (see Fig. 3).
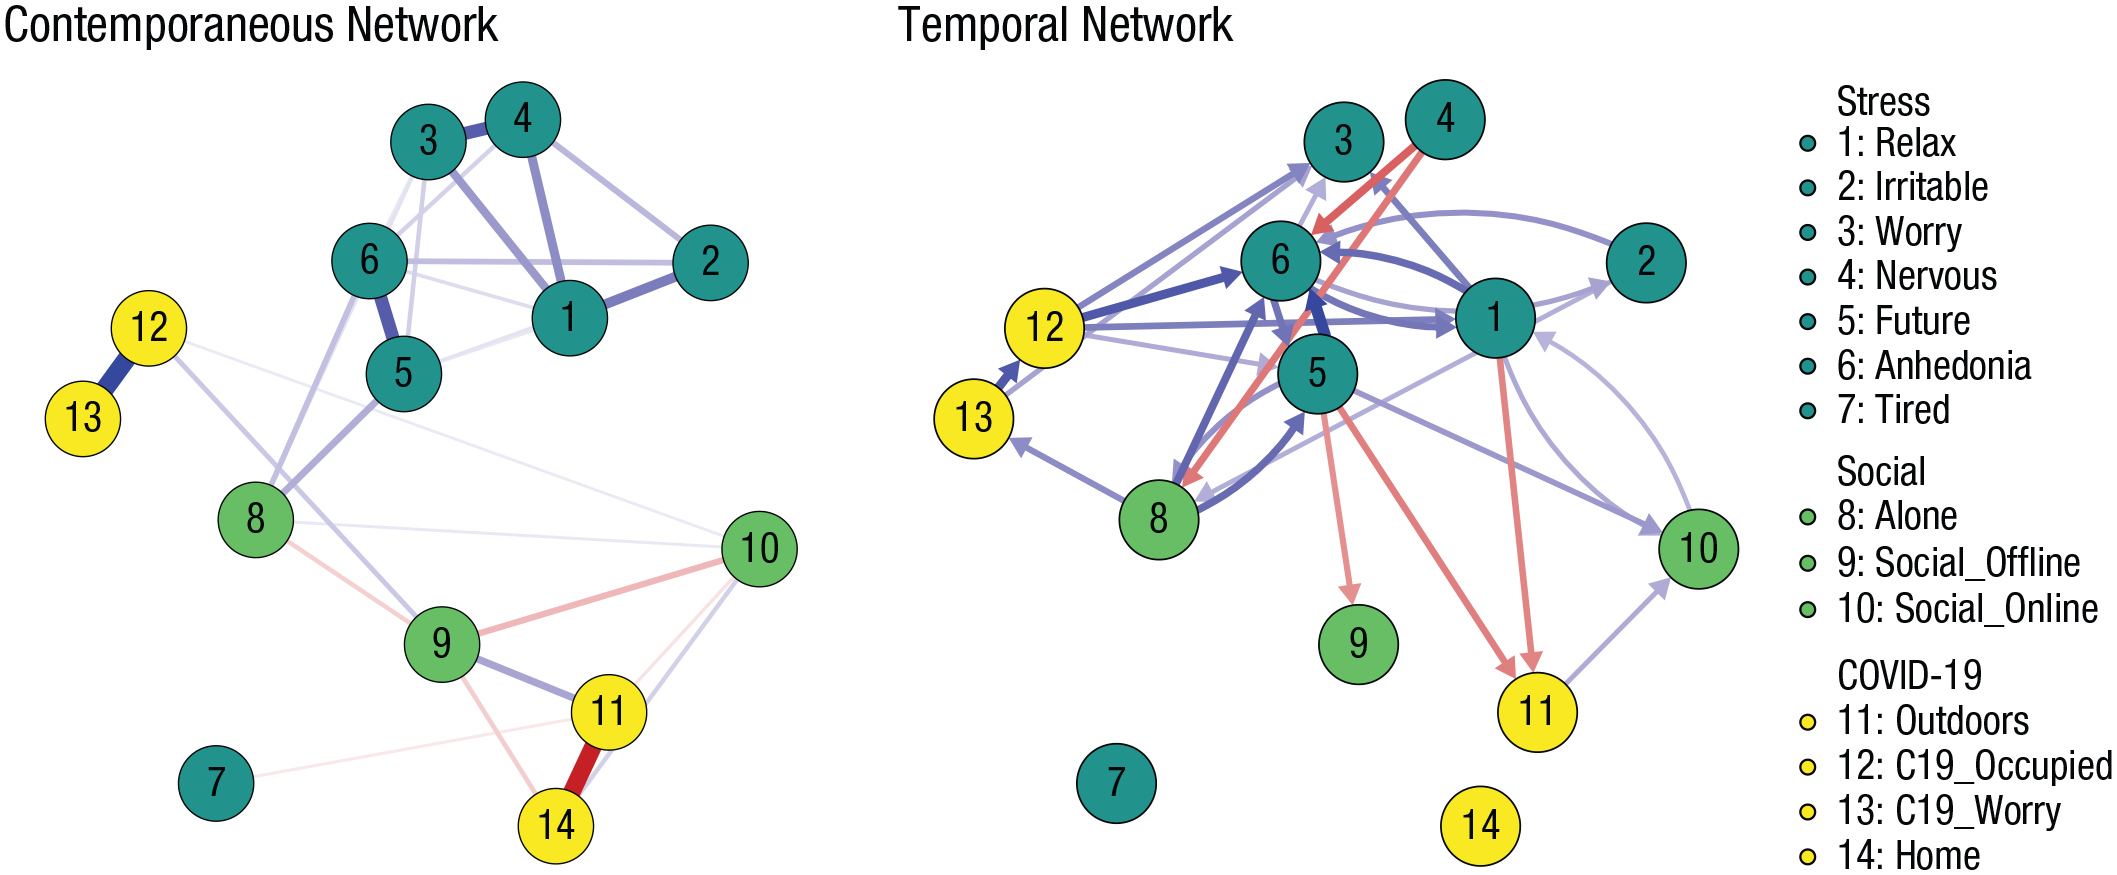
Contemporaneous (left) and temporal (right) relations among 14 ecological momentary assessment variables gathered four times a day over the course of 2 weeks, estimated with a multilevel vector-autoregressive model and depicted as a graph in which nodes are variables and edges (lines) are partial correlations among variables. Thicker and more saturated edges depict stronger relations; positive relations are in blue, and negative relations in red. Strongest relations are contemporaneous network coefficient = 0.5 (12–13); temporal network autoregressive coefficient = 0.22 (8→8); temporal network cross-lagged coefficient = 0.14 (5→6). Autoregressive coefficients in the temporal network were omitted to enhance clarity of presentation. A figure that includes these coefficients is available online (https://osf.io/erp7v/files/).
In the contemporaneous network (i.e., relations among items within the previous 3-hr duration of a given beep), we identified many expected relations among items, such as a positive relation between C19_occupied and C19_worry and negative relations between outdoors and home, social_offline and social_online, and alone and social_offline. Furthermore, we found that mental health items (except for tired) were interrelated; alone was related to (concerns about) future as well as anhedonia, and outdoors was positively (and home negatively) related to social_offline, indicating that meaningful in-person activities took place at home more than outside.
In the temporal network (i.e., lag-one relations from one 3-hr measurement period to the next), we identified positive autoregressive coefficients for all nodes ranging from 0.13 (outdoors) to 0.22 (alone), positive relations among mental health variables, and some vicious cycles, for example, between (worry about) future and anhedonia, (worry about) future and alone, (unable to) relax and anhedonia, as well as (unable to) relax and social_online. The most interesting feedback loop was this one: alone → C19_worry → C19_occupied → anhedonia ⇄ (worry about) future ⇄ alone; C19_occupied as part of this cycle also predicted a range of other mental health problems. Both (unable to) relax and (worry about) future led to less time spent outside at the next time point, and (worry about) future also negatively predicted social_offline. Nervous was followed by participants being less alone and by lower levels of anhedonia at the next measurement point.
Postassessment
At the postassessment, 19.5% of students indicated that they had had symptoms during the previous 3 weeks that could indicate a COVID-19 infection, such as fever, cough, or shortness of breath; none had received a formal diagnosis, however. Only four students indicated that a close friend or relative had received a COVID-19 diagnosis. Participants further indicated, on a 5-point Likert scale ranging from 1 (totally disagree) to 5 (totally agree), 3 being neutral, that they started washing their hands more frequently during the study period (M = 3.49, 95% confidence interval [CI] = [3.32, 3.67]), that they avoided social activities with many people (M = 3.70, 95% CI = [3.56, 3.84]), that the pandemic affected their mental health negatively (M = 3.34, 95% CI = [3.06, 3.62]), that they felt somewhat well informed by Leiden University (M = 3.39, 95% CI = [3.11, 3.67]) and the Dutch government (M = 3.39, 95% CI = [3.11, 3.67]), and that the actions taken by Leiden University and the government had had no impact on their stress levels (M = 2.88, 95% CI = [2.60, 3.16]).
Discussion
We closely followed 80 students during the early days of the COVID-19 pandemic in the Netherlands, a time of fairly dramatic changes. Many of these were once-in-a-lifetime disruptions of students’ daily lives. The unique nature of the COVID-19 pandemic and our unique EMA data make the results somewhat difficult to compare with prior work. Nonetheless, in the following section, we summarize our main results and connect them to other research.
Generally, we observed somewhat heterogeneous changes; there were more decreases than increases in mental health problems, both when comparing baseline with exit surveys and when investigating changes of EMA items during our 2 weeks of study duration. Only responses on the depression subscale of the DASS-21 increased, from an average in the normal range to an average in the mild depression range. Prior work reported considerable adverse effects on mental health during outbreaks, such as during the severe acute respiratory syndrome (SARS) epidemic in 2003; among other variables, being in quarantine and knowing people with SARS diagnoses predicted adverse effects (Hawryluck et al., 2004). COVID-19 mental health studies reported increases in depression symptoms (in U.S. adults; Ettman et al., 2020), anxiety symptoms (in young English adults; Kwong et al., 2020), and distress (McGinty et al., 2020) from before to during the pandemic (see also, Daly et al., 2020; Twenge & Joiner, 2020); a study of Dutch children and adolescents reported similar results (Luijten et al., 2020). None of the students in our sample received a COVID-19 diagnosis during our data collection period, and only four participants reported having close friends or family members with diagnoses, which may have mitigated adverse mental health outcomes. Furthermore, scores of our participants on the DASS-21 at baseline were overall in the normal or slightly increased range, indicating a sample that may be more resilient to adverse events.
We saw decreases for most EMA items related to mental health, including items concerning students’ worry about their own health and that of family members and students’ occupation with COVID-19. These decreases were visible especially in the first three days of our EMA period and have also been observed in other studies, such as the COVID-19 social study that identified substantial drops within the first two days of assessment (Fancourt et al., 2020). How can such decreases in our data be explained given the rapid increases in infections and deaths in the Netherlands (Fig. 1)?
The most plausible interpretation is that the initial decrease represents a quick recovery toward baseline after a brief elevation, implying that we may have missed the peak a few days before. This is consistent with a 14-day EMA study in U.S. students that revealed short-lived increases in adverse mental health outcomes after the 2016 presidential election (Roche & Jacobson, 2019). It is also in line with the COVID-19-related data published by the Understanding America Study (2020), 1 which monitors around 9,000 participants throughout the United States; they recorded peaks of depression, anxiety, and stress between the end of March and middle of April. Another study that examined U.S. Google searches for mental health outcomes during the week of March 16, 2020, coinciding with first week of our EMA data (Jacobson et al., 2020), identified considerable initial increases in searches related to mental but a quick stabilization of searches in less than 4 days. A second interpretation is that the initial decrease could be artifactual, in the sense that early self-report items could be overreported. This has been described as initial elevation bias (Shrout et al., 2018) and is plausible in the context of our study, in which students may initially overreport COVID-related feelings such as concerns about their health. However, recent systematic investigations have raised doubts about initial elevation bias in the context of EMA. In a daily diary study of more than 1,300 participants, Arslan et al. (2020) assessed constructs similar to those included in our study (e.g., stress, loneliness, mood) and concluded that findings are likely substantive in nature rather than measurement artifacts.
Two findings stand out from the overall stable or decreasing mental health problems in our study. Participants reported at the exit measurement point on a one-item screener that the pandemic had affected their mental health somewhat adversely; the specific item was “The coronavirus (COVID-19) situation had an impact on my mental health (e.g., stress, anxiety, depressed mood).” The most plausible explanation for this divergent result, in our opinion, is that students reported changes over a longer period of time than our study period (i.e., the pandemic had affected their mental health adversely before the start of our study). The result could also be a consequence of measurement: It was the only mental health item about retrospective change. A final explanation is that students answered this item about mental health problems other than stress, anxiety, or depression (although we provided these three as examples in the question), meaning that the item queried different content than our main outcome measure, the DASS-21.
The second mental health finding that stands out from our results is the significant increase on the DASS-21 depression subscale from baseline to exit survey, when the anxiety subscale decreased and the stress subscale remained stationary. We performed post hoc analyses to investigate this result in more detail by looking at which particular items were responsible for the increases in depression and decreases in anxiety (for all individual-item changes, see https://osf.io/erp7v/files/). We identified two items that drove the decrease for DASS-21 anxiety; both were related to panic or panic attacks (worried about situations one might panic in and feeling close to panic). For the depression subscale, the two items that increased substantially over time were difficulty to work up initiative and having nothing to look forward to. Although we could not find similar results in the literature, these results do not appear counterintuitive to us: The pandemic initially increased panic-related thoughts, feelings, and behaviors, which quickly return to baseline in a fairly healthy sample of students. At the same time, closure of university and social-distancing measures have a negative impact on motivation and future outlook.
A related result to discuss is that the future outlook item on the DASS-21 depression subscale (nothing to look forward to) increased over time from preassessment to postassessment, as just discussed, but we identified a significant decrease in the same item during EMA, as shown in Table 1. In other words, the item increased over two repeated assessments 2 weeks apart, when we asked how students felt in the previous week, but decreased when monitoring it over 56 measurement points with the question of how they felt in the previous 3 hr. This is not necessarily contradictory because these assessments cover different time frames: The baseline survey queried participants about the prior week, and EMA data collection started after that. This is consistent with the notion that we missed an early peak of mental health problems shortly before the beginning of our EMA study period: Depression symptoms increased from Week 1 to Week 3 of our data collection in pre-post surveys but decreased in EMA items from Week 2 to Week 3. Given the scarcity of measurement work on EMA, we do not know whether there might be other causes of this pattern in the data. It is possible that contemporaneous reporting differs from retrospective reporting of information in important ways, highlighting the importance of more focused measurement work in the domain of EMA research.
Regarding social contact, students reported decreasing levels of loneliness both in EMA data and when comparing baseline and exit surveys. In addition, students reported no changes in their amount of meaningful in-person social activities and slight increases in their time staying at home (potentially spending more time with family, flatmates, and close friends). At the exit survey, students reported retrospectively that they had somewhat avoided social contact in larger groups during our study. Together, these findings imply that although overall in-person social contact remained fairly stable, the type of social contact may have changed to smaller—and potentially more meaningful—social interactions, which could explain the decreases in loneliness. This is consistent with our own experiences: We were more in touch with our families during the outbreak of the pandemic in the Netherlands. During the SARS epidemic, adults in Hong Kong reported increases regarding “feeling part of the community” compared with an assessment a year before the outbreak (Lau et al., 2008), which may be consistent with our findings of decreasing loneliness. Although some additional measures were initiated by the Dutch government halfway through our EMA data-collection period, such as limiting visitors to a maximum of three (for a more detailed description, see the Method section), the government had already announced some measures shortly before EMA data collection started, such as closing of universities. Students may therefore have decreased their social contacts in the days leading up to the beginning of our data collection, explaining why social contact may not have (further) decreased during our data-collection period.
The main results of the two network models were that mental health items clustered together and yielded some potential vicious cycles; that loneliness was positively related to mental health problems and concerns about COVID-19, which, in turn, predicted mental health outcomes; and that being outdoors was related to meaningful in-person social activities. There was some evidence for small peaks of state mental health problems on Days 4 and 8, following university and government announcements. From a dynamical systems perspective, these peaks can be thought of as perturbations of the students’ mental health systems caused by events in the external field (Borsboom, 2017; Robinaugh et al., 2019). This view offers the possibility that, especially in vulnerable students, timely interventions on elements of the dynamical system may have positive outcomes and prevent transitions into more severe problems. This is especially the case for elements that are part of vicious cycles, such as social contact, loneliness, or worry. Overall, future work should use time-series data to investigate dynamical systems of mental health during stressors and the potential benefits of prevention and intervention strategies targeting such systems using methods such as control theory (Fried & Robinaugh, 2020; Henry et al., 2020).
Finally, we want to briefly address how to best interpret estimated relations in the above network models: What do they represent? Network coefficients are no different from other statistical coefficients such as β weights in linear regressions: Anything but purely statistical inference requires auxiliary assumptions. Suppose we find that x at Time 1 predicts y at Time 2 in a univariate linear regression. This leads to a regression coefficient we can draw in a graph (x→y), a statistical relation called Granger causality: x precedes y, and x is related to y (Granger, 1969). But have we established that intervening on x would change y? Hardly, because there are many unknowns (cf. Fried, 2021; Fried & Cramer, 2017). Do we measure x and y at the right time frame to capture causal relations at all, and does the specified functional form (here, a linear relation) match the data-generating process (Robinaugh et al., 2021)? Do we capture the constructs with reliable and valid measures and without bias? Do we control for all relevant covariates, or from a network perspective, do we model all relevant elements of the system (maybe x is related to z, and it is z that actually causes y, not x)? And are we certain we do not include elements in the system that should not be included, such as colliders that can induce spurious relations among variables (de Ron et al., 2019)? There are many more auxiliaries, including specific assumptions that come with the use of particular statistical models such as the VAR model (Epskamp et al., 2018; Fried, 2021), which does not investigate whether changes in x predict changes in y but whether deviations from a person-wise average in x predict deviations from a person-wise average in y. For these reasons, we see exploratory network modeling in time-series data as an important first step in mapping out complex, multivariate, conditional dependence relations. Its core value lies in generating hypotheses that can then be followed up in dedicated work with the goal of trying to understand mechanisms of network relations, such as testing experimentally whether interventions on variables in network models lead to changes consistent with estimated network structures. This is an important open question given that complex systems are notoriously difficult to control (Henry et al., 2020).
Before concluding this article with limitations, we want to reiterate that many variables in the data set have not been analyzed for this report; that the all data, code, and measures are available online (https://osf.io/erp7v/files/); and that we encourage others to use the data for their own work (see e.g., Mansueto et al., 2020; Taquet et al., 2021).
Our study comes with a number of limitations. First, we focused our investigation on the group level and explored only some interindividual differences via random effects multilevel regression models, described in detail online (https://osf.io/erp7v/files/). One interesting result is the heterogeneity across participants in (univariate) autoregressive effects for the majority of EMA variables. Idiographic follow-up work will be important to understand how time series of mental health data, and their relations, differ across people (Fisher et al., 2018; Fried & Cramer, 2017; Hebbrecht et al., 2020).
The second set of limitations pertains to measurement. To limit the burden of an already time-intensive study for students and to minimize dropout, we shortened or adapted some scales, such as the loneliness scale, and were unable to assess many variables of interest in more detail, such as socioeconomic status, income, racial/ethnic background, or the nature of social contacts. Furthermore, to keep surveys brief, we did not provide detailed definitions of the constructs we measured, such as meaningful in-person activities. This means that participants may have interpreted items differently. A study in 4,600 participants found that certain types of social interactions were considered to be especially meaningful (Litt et al., 2020) and that these results were consistent across several cultures. Meaningful interactions included those that enhanced people’s lives, the lives of their interaction partners, or personal relationships; interactions with friends, family, or partners with community ties (e.g., neighbors); and interactions that featured shared activities, were planned in advance, or were memorialized via photographs or other media. Another limitation is that we created the EMA items for our study because there is no dedicated validation work in the context of EMA measurement yet. We urge the field to come together and initiate concerted efforts to develop valid and reliable scales suitable for investigating short-term dynamics of emotions and state mental health problems.
Third, our study is limited in terms of measurement points, and we hope that future research on compliance rates in EMA data may elucidate ways to reliably gather data over longer assessment periods. Combining longer EMA periods with passive sensing and digital phenotype data collection via wearable devices may provide more fine-grained and objective data than we were able to collect (Jacobson et al., 2019).
Finally, although the sample is diverse in terms of nationalities, it is largely limited to European students and is a convenience sample of psychology undergraduates living in the Netherlands. The Netherlands is a first-world country and has ranked first in Europe several times in the past decade in terms of health care consumer satisfaction (Watson, 2012). It is an open question how well our results generalize to other populations given the nature of the COVID-19 pandemic. Likewise, we focused on the immediate impact of the pandemic on student mental health. Other work has focused on longer term consequences, such as a U.S.-based study that demonstrated increases in depression and anxiety symptoms in undergraduates in the winter semester 2020 compared with prior academic terms (Huckins et al., 2020).
Footnotes
Acknowledgements
We thank all participants in the study and all students involved in the data collection efforts for this project: Patrick Aigner, Anika Busch, Rayka Zavaro Dalva, Sophie Janken, Agnieszka Kusal, Lynn Mayer, Alice Micale, Giulia Murgia, Arthur de Souza Queiroz, Joe Saville, Luana Schehr, Emilie Sutter, Jonas Totland, Lea Velthuysen, Anna Wickenkamp, and Elias Zitterbarth. Special thanks to Leonie Cloos and Ricarda Proppert for their help in setting up the study.
Transparency
Action Editor: Kenneth J. Sher
Editor: Kenneth J. Sher
Author Contributions
E. I. Fried designed the study and, together with F. Papanikolaou, collected the data. E. I. Fried and F. Papanikolaou cleaned the data and prepared them for analyses. E. I. Fried and S. Epskamp analyzed the data. E. I. Fried wrote the first manuscript draft. All of the authors revised the manuscript and approved the final manuscript for submission.