
Abstract
This study investigated the factor structure of the Lithuanian version of the Highly Sensitive Person (HSP) scale and identified sensory processing sensitivity (SPS) subgroups among emerging adults. A total of 651 participants aged 18–29 completed the instrument. Exploratory and confirmatory factor analyses supported a three-factor model—Ease of Excitation (EOE), Low Sensory Threshold (LST), and Aesthetic Sensitivity (AES)—consistent with previous cross-cultural findings. Latent profile analysis revealed four distinct SPS profiles: High-, Moderate-, Mild-, and Low-sensitivity. Overall, the findings provide evidence for the psychometric robustness of the Lithuanian HSP scale and point to the potential role of developmental context and gender in shaping SPS. This study contributes to cross-cultural validation initiatives and offers a foundation for future research and practical applications in psychological assessment and intervention with young adults.
Keywords
Introduction
High sensitivity, or sensory-processing sensitivity (SPS), is a biologically based temperament trait marked by deep information processing, heightened emotional reactivity, increased environmental awareness, and susceptibility to overstimulation (Acevedo et al., 2021; Aron & Aron, 1997). Roughly one-third of the population prominently exhibit this trait (Lionetti et al., 2018; Pluess et al., 2018), and on average women report higher levels of SPS than men (Aron & Aron, 1997). Although distinct, SPS overlaps conceptually with broader traits like neuroticism and introversion (Lionetti et al., 2024) and is associated with both adaptive outcomes (Bridges & Schendan, 2019) and mental health challenges (Falkenstein et al., 2025). Various tools (De Gucht et al., 2022) and procedures (Ishikami & Tanaka, 2023) have been developed to assess SPS, with Aron and Aron’s (1997) Highly Sensitive Person (HSP) scale remaining the most widely used and validated. In HSP research, it is common to integrate both variable- and person-centered approaches. The former focus on relationships between variables across the population, while the latter identify subpopulations of individuals with similar response patterns (Howard & Hoffman, 2018). In the present study, both approaches were employed to examine the structural validity of the Lithuanian version of the HSP scale and to identify SPS subgroups among emerging adults.
Originally conceptualized as a unidimensional construct (Aron & Aron, 1997), SPS has since been examined through more differentiated models. Evans and Rothbart (2008) and Rinn et al. (2018) proposed two-factor models, while Smolewska et al. (2006) introduced a widely supported three-factor model, comprising ease of excitation (EOE), aesthetic sensitivity (AES), and low sensory threshold (LST), reflecting mental overwhelm, aesthetic awareness, and aversive sensory arousal, respectively. This structure has been replicated across diverse linguistic and cultural contexts (De Gucht et al., 2023; Konrad & Herzberg, 2017; Takahashi, 2016; Trå et al., 2022; Turjeman-Levi & Kluger, 2022). Alternative models, such as bifactor structures (Iimura et al., 2023) and expanded multi-factor solutions (Bordarie et al., 2022), often rely on modified or abbreviated scales. Collectively, these variable-centered findings support SPS as a multidimensional construct involving both strengths and vulnerabilities.
Although initially conceptualized as a continuous trait (Aron & Aron, 1997), person-centered research often reveals distinct SPS subgroups. Three main profiles—low, medium, and high sensitivity—have been consistently identified across age groups (Baryła-Matejczuk et al., 2022; Pluess et al., 2018; Yang & Kwon, 2024). In a seminal study of emerging adults, Lionetti et al. (2018) expanded on the flower metaphor, characterizing low-sensitive individuals as dandelions (29%), highly sensitive ones as orchids (31%), and introducing tulips to represent those with medium sensitivity (40%). Extending this framework, Bürger et al. (2024) proposed a four-group model: low -, medium-, vulnerable-, and confident-sensitivity types, highlighting the heterogeneity within high sensitivity. Liu and Tian (2024) further emphasized this diversity by combining SPS with emotion regulation profiles, illustrating the utility of person-centered approaches in informing tailored psychological interventions.
Despite methodological advances, inconsistencies in the HSP scale’s structure and subgroup classifications remain across studies, highlighting the importance of further validation in different cultural contexts and populations (Greven et al., 2019). This study aimed to (1) examine the factor structure of the Lithuanian HSP scale and (2) identify SPS subgroups among emerging adults. Emerging adulthood was selected due to its distinctive developmental relevance. This transitional stage involves both opportunities and instabilities, often accompanied by increased psychological demands (Arnett, 2000). Individuals in this life stage frequently face age-based discrimination (Bratt et al., 2018) and must exert considerable internal effort to adapt (Newcomb-Anjo et al., 2017). In such contexts, SPS may act as both a vulnerability factor and a resilience resource. By investigating SPS in Lithuanian emerging adults, this study contributes to the cross-cultural understanding of the construct and offers a validated tool for future research and tailored applications.
Method
Participants and Procedure
The final sample comprised 651 participants aged 18–29 years: 542 women (83.3%), 95 men (14.6%), and 14 nonbinary individuals (2.2%). Of the initial 686 participants, 35 (5.1%) were excluded due to biased responses, identified through three data-driven techniques: the longstring index (detecting repetitive answers), intraindividual response variability (flagging unusual patterns), and Mahalanobis distance (identifying multivariate outliers).
Data were collected online between April 2023 and March 2024 via Google Forms and Microsoft Forms, both accessible without login requirements. Eligibility was restricted to individuals aged 18–29, consistent with definitions of emerging adulthood. Participation was voluntary and uncompensated, with informed consent obtained from all participants prior to the study. A multi-pronged recruitment strategy was implemented to maximize diversity and avoid overreliance on a single source. Within academic settings, invitations were circulated through university mailing lists and forums. Beyond the university context, study announcements were posted on social media platforms (e.g., Facebook, Instagram) and in a variety of interest groups (e.g., psychology communities, hobby and cultural groups). This approach was intended to include both students and non-students from across Lithuania, thereby reaching a broader segment of emerging adults.
Measures
The original HSP scale (Aron & Aron, 1997) was translated into Lithuanian using standard forward- and back-translation in line with International Test Commission guidelines (2017). Permission for translation and use was obtained from the original authors. The scale comprises 27 items rated on a seven-point scale (1 = not at all, 7 = extremely). The original version has demonstrated strong reliability and validity across numerous studies. Psychometric properties of the Lithuanian version are reported in the Results section.
Data Analysis
Although prior research often supports a three-factor model, cultural adaptations can yield alternative solutions. Exploratory factor analysis (EFA) was therefore conducted first to test dimensionality, followed by confirmatory factor analysis (CFA) to confirm the structure. For this purpose, a six-step procedure based on Osborne’s (2014) guidelines was implemented: (1) data inspection, (2) extraction method selection, (3) factor number determination, (4) rotation method choice, (5) result interpretation, and (6) model replicability evaluation. The total sample was randomly split into two subsamples—A (n = 326) and B (n = 325)—with balanced gender representation. Both EFA and CFA were carried out using methods appropriate for ordinal data. Data suitability was assessed with the Kaiser-Meyer-Olkin (KMO) index, individual measures of sampling adequacy (MSA), and Bartlett’s test of sphericity.
EFA on Subsample A employed weighted least squares with polychoric correlations. Factor retention was guided by Kaiser’s criterion, parallel analysis, and the minimum average partial (MAP) test. Oblique (promax) rotation aided interpretability, with evaluation based on factor loadings (≥.32), cross-loadings, explained variance, internal consistency (≥.70), and average inter-item correlations (.15–.50). CFA on Subsample B validated the structure using diagonally weighted least squares, with fit indices including CFI and TLI (≥.95), RMSEA (≤.06), and SRMR (≤.08) (Brown, 2015).
Latent profile analysis (LPA) was conducted on the full sample using validated factor scores. Following Bauer’s (2022) three-step approach—model specification, profile number selection, and solution interpretation—model fit was evaluated via AIC, BIC, and SABIC. The bootstrapped likelihood ratio test (BLRT) compared nested models, while entropy (≥.60) and average posterior probabilities (≥.70) assessed classification accuracy. The final model adhered to a minimum class size of 5%, balancing statistical rigor with theoretical coherence and parsimony. Between-profile differences were tested using one-way ANOVA. Gender differences were examined using independent-sample t-test on factor scores, cross-tabulations of profile membership, and t-test on average posterior probabilities of belonging to profiles, with nonbinary participants excluded from these analyses due to their small number.
All analyses were conducted in R (R Core Team, 2023). Key packages included careless (Yentes & Wilhelm, 2023) for response bias detection, psych (Revelle, 2024) for descriptive statistics, EFA, lavaan (Rosseel, 2012) for CFA, and tidyLPA (Rosenberg et al., 2018) for LPA.
Results
Factor Structure
Initial data inspection confirmed the suitability for factor analysis. Both Subsample A (KMO = .89) and Subsample B (KMO = .88) showed strong overall adequacy, with significant Bartlett’s test results (χ2 (351) = 3071.6, p < .001; χ2 (351) = 3173.92, p < .001). However, item HSP12 demonstrated poor MSA values (.56 and .57, respectively), leading to its exclusion. Factor retention criteria yielded differing solutions: Kaiser’s criterion suggested six factors, and parallel analysis indicated five, both producing weakly defined structures. In contrast, the three-factor solution, supported by both original and revised MAP tests, was optimal. Items HSP6 and HSP20 were removed due to insufficient factor loadings, resulting in a refined 24-item model.
Item to Factor Loadings, Reliability Metrics, Means, and Standard Deviations
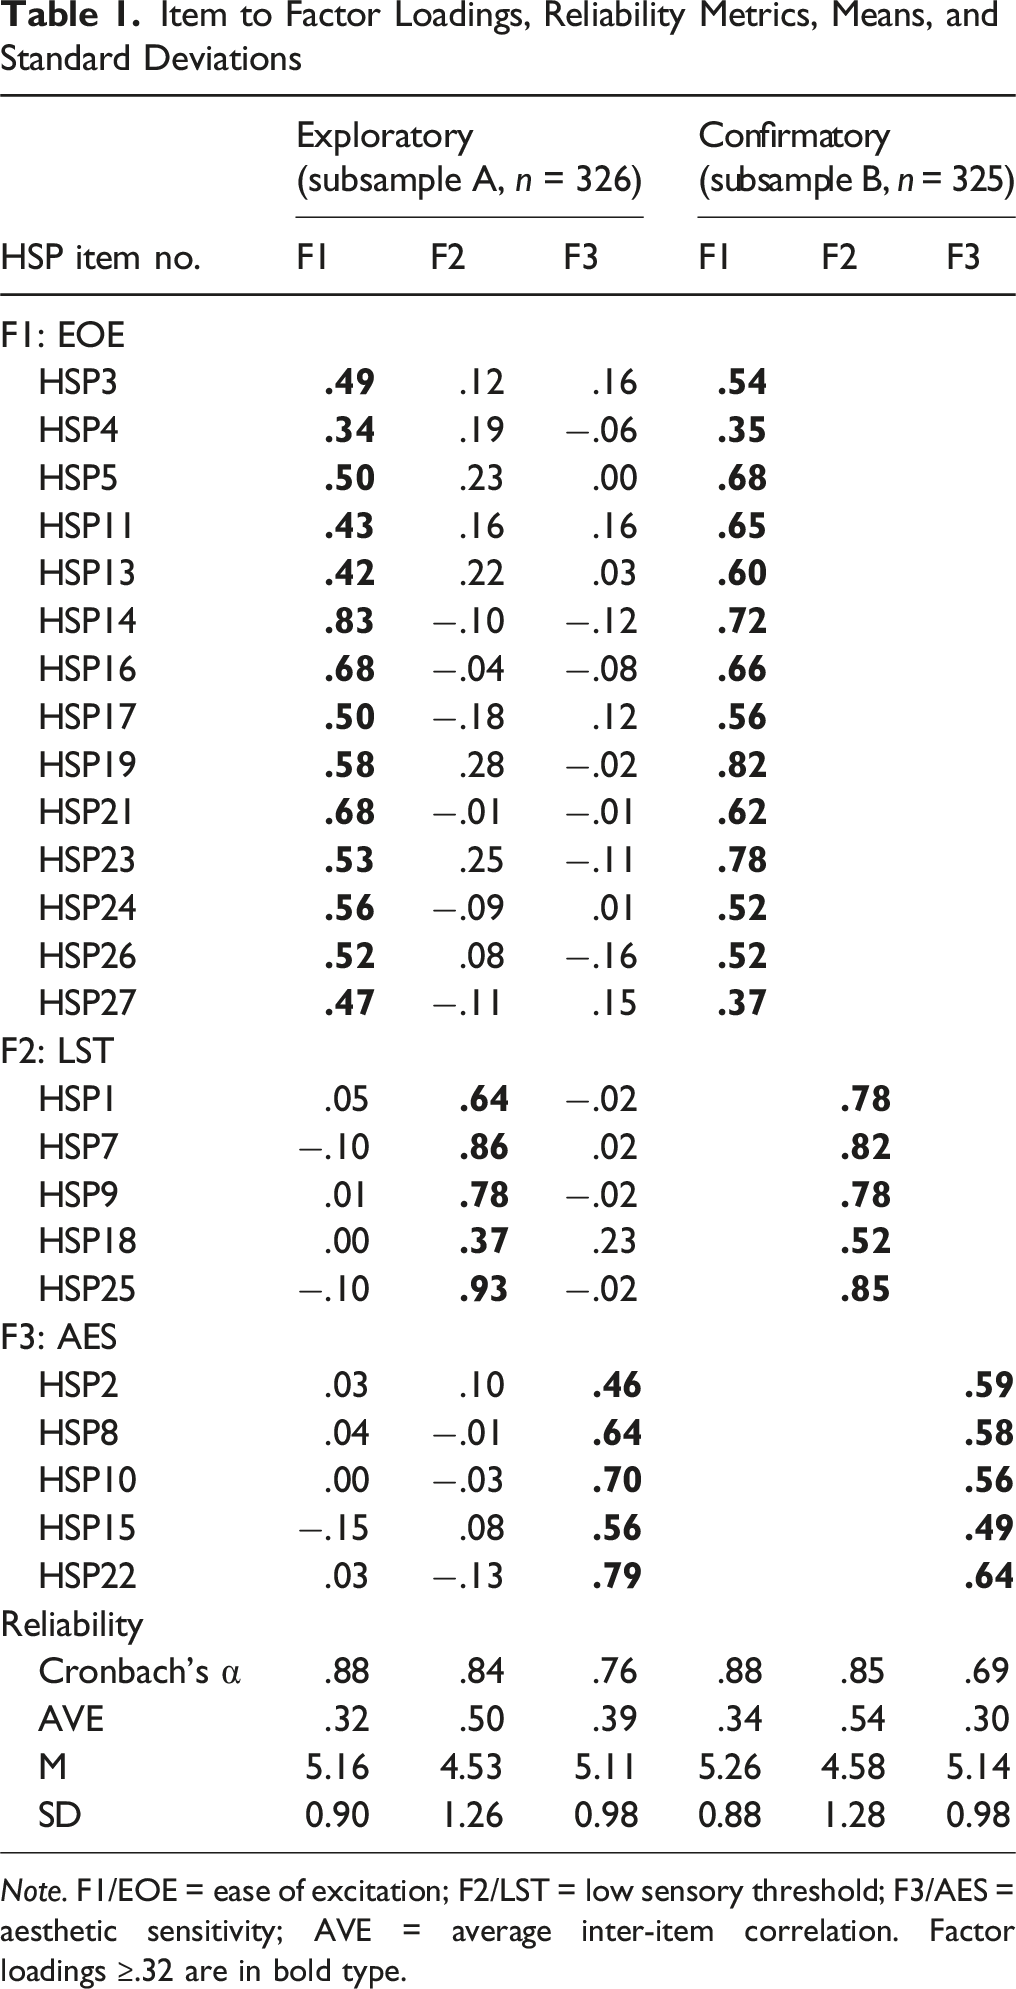
Note. F1/EOE = ease of excitation; F2/LST = low sensory threshold; F3/AES = aesthetic sensitivity; AVE = average inter-item correlation. Factor loadings ≥.32 are in bold type.
Confirmatory factor analysis in Subsample B supported the model’s replicability, yielding excellent fit indices: χ2 (249) = 598.30, p < .001; CFI = .978; TLI = .976; RMSEA = .066 (90% CI [.059–.073]); SRMR = .068. EOE and LST showed strong internal consistency, while AES approached adequacy. Inter-item correlations were acceptable for EOE and AES, though slightly elevated for LST. The strongest correlation remained between EOE and LST (.80), with moderate correlations between AES and EOE (.55) and AES and LST (.50).
Gender analyses based on the entire sample showed that women scored significantly higher than men on all three factors: EOE (t (365) = 12.23, p < .001, d = 1.36), LST (t (365) = 10.02, p < .001, d = 1.11), and AES (t (365) = 7.64, p < .001, d = 0.85).
Latent Profiles
Model Fit Information for Latent Profile Analysis
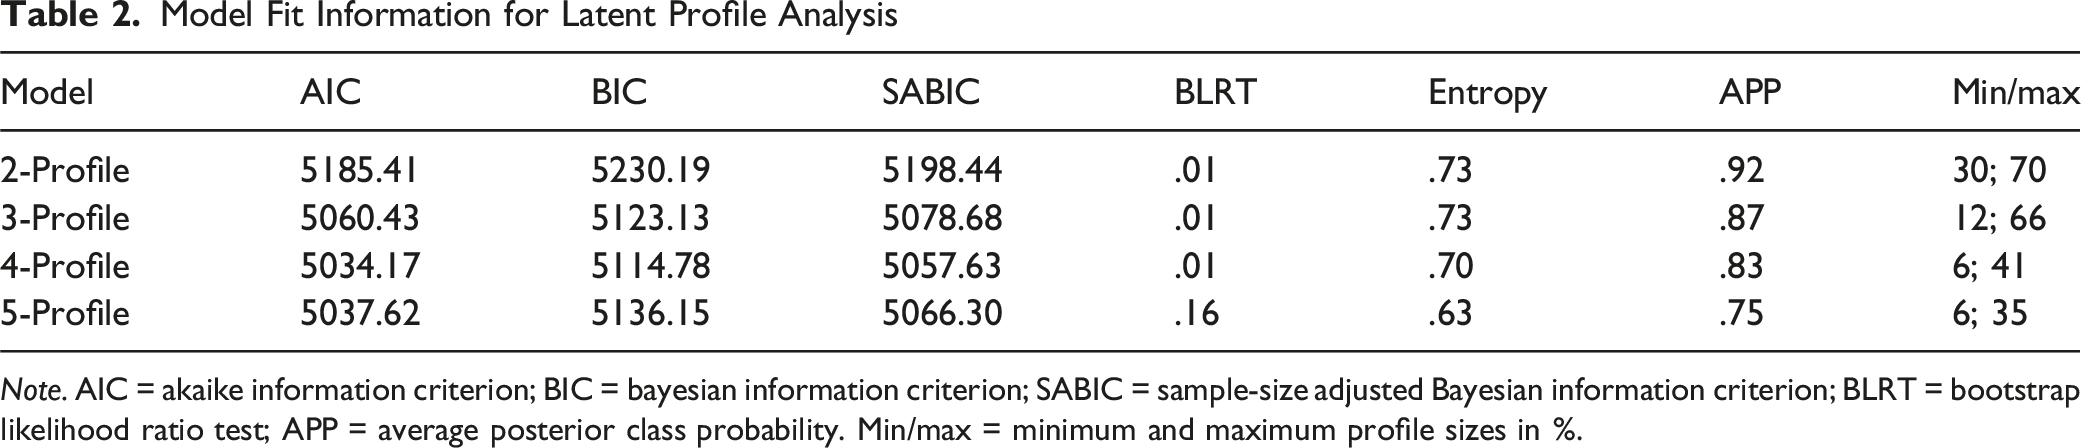
Note. AIC = akaike information criterion; BIC = bayesian information criterion; SABIC = sample-size adjusted Bayesian information criterion; BLRT = bootstrap likelihood ratio test; APP = average posterior class probability. Min/max = minimum and maximum profile sizes in %.
Between-Profile Comparisons Using One-Way ANOVA
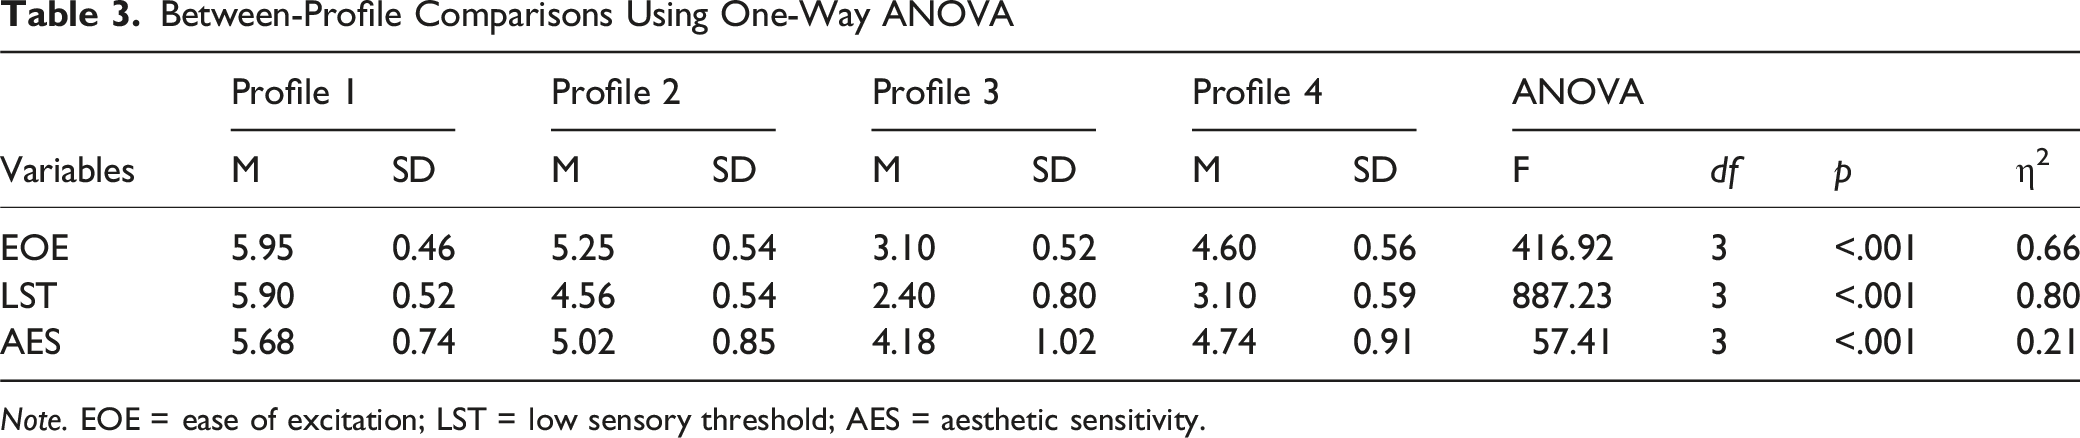
Note. EOE = ease of excitation; LST = low sensory threshold; AES = aesthetic sensitivity.
Gender differences were also evident in profile membership. The distribution of participants across four profiles differed significantly by gender (χ2 (3) = 151.0, p < .001, Cramer’s V = 0.49). Independent-sample t-tests confirmed these differences: women were significantly more likely to be classified into Profile 1 (High-sensitivity) (t (635) = 7.7, p < .001, d = 0.88) and Profile 2 (Moderate-sensitivity) (t (635) = 3.2, p < .001, d = 0.36), while men were more likely to be classified into Profile 3 (Low-sensitivity) (t (635) = −12.8, p < .001, d = −1.41) and Profile 4 (Mild-sensitivity) (t (635) = −5.2, p < .001, d = −0.57).
Discussion
This study examined the factor structure of the Lithuanian HSP scale and identified distinct SPS subgroups among emerging adults. Employing both factor and latent profile analyses, the findings clarified the scale’s dimensionality and revealed heterogeneity within the sample.
The three-factor model yielded the best fit, aligning with the structure most consistently supported in prior research. Items loaded cleanly onto the interrelated dimensions of EOE, LST, and AES, validated in multiple cultural contexts, and the item-to-factor loadings were broadly consistent with the original model by Smolewska et al. (2006), with only minor deviations. In the present study, three items were excluded to optimize model fit: HSP12 (“Are you conscientious?”) due to conceptual divergence (as noted by Trå et al., 2022; Turjeman-Levi & Kluger, 2022), and HSP6 (“Are you particularly sensitive to the effects of caffeine?”) and HSP20 (“Does being very hungry create a strong reaction in you, disrupting your concentration or mood?”) for low loadings, in line with prior validation efforts (Konrad & Herzberg, 2017; Takahashi, 2016). The final model demonstrated strong fit and reliability. While AES exhibited lower internal consistency than EOE and LST, this pattern reflects previous findings (Iimura et al., 2023; Konrad & Herzberg, 2017; Smolewska et al., 2006) and remained within acceptable bounds. However, the high intercorrelation between EOE and LST, and elevated inter-item correlations in LST, may suggest redundancy. Some retention criteria (e.g., Kaiser’s criterion, parallel analysis) indicated additional factors, but these were weakly defined. Taken together, these findings point to two directions for further research: first, refining the scale by shortening it to reduce redundancy; and second, expanding it by adding new items to capture potentially overlooked aspects of sensitivity.
The sample was best characterized by four distinct profiles based on unique patterns across the three SPS subtraits: High-, Moderate-, Mild-, and Low-sensitivity. This classification broadly aligns with prior research indicating that highly sensitive individuals make up about one-third of the population. While SPS is commonly structured into three levels, the present findings revealed a four-profile solution, echoing Bürger et al. (2024), who identified nuanced subgroups within high sensitivity. While Bürger et al. focused on distinctions among highly sensitive individuals, these results point to meaningful variation at the lower end. The Low-sensitivity profile encompassed only 5.9% of participants, while the Mild-sensitivity group represented 21.2%. Further analysis revealed that the Mild group’s EOE scores resembled those of the Moderate profile, while their LST scores aligned more closely with the Low group, suggesting elevated emotional reactivity without parallel sensory sensitivity.
One explanation for these results relates to the specificity of the age group. As outlined in the Introduction, emerging adulthood is often characterized by heightened emotional reactivity and developmental stressors, as well as increased demands for adaptation. Within the environmental sensitivity framework (Greven et al., 2019; Pluess, 2015), sensitivity is understood as a general capacity to register and process environmental influences, expressed to varying degrees across contexts. From this perspective, the Mild-sensitivity profile may represent a context-contingent expression of SPS, in which the developmental challenges of emerging adulthood selectively amplify excitation without parallel increases in sensory sensitivity. Such an interpretation suggests that profiles may not be entirely stable but could vary with situational demands, particularly during transitional life stages. It also underscores the practical importance of providing tailored support for emerging adults who show heightened emotional reactivity despite otherwise low sensitivity.
A complementary explanation relates to gender. Women were more likely to belong to the High- and Moderate-sensitivity groups, whereas men were overrepresented in the Low- and Mild-sensitivity groups. These differences suggest that gender may shape how SPS profiles are expressed, raising the possibility that the identified structure partly reflects gendered patterns of reporting or experience. This interpretation echoes Aron and Aron’s (1997) observation that gender differences in sensitivity may reflect cultural ideals discouraging men from acknowledging sensitivity, a view further supported by recent research on highly sensitive men (Miller & Lynch, 2024). In addition, gender has been shown to shape the very experience of emerging adulthood (De la Fuente et al., 2020), which may provide further context for the observed gendered distribution of profiles.
Both interpretations remain tentative and require further empirical support, ideally through longitudinal and cross-cultural studies that can disentangle age-related and gender-related influences on sensitivity profiles.
This study has several limitations. First, despite efforts to recruit a diverse sample, the study may still reflect self-selection bias inherent in online recruitment, and the sample was predominantly women, with only a small number of nonbinary participants. Such imbalances are common in HSP research (Trå et al., 2022), but they may reduce the generalizability of the findings and point to the importance of examining gender and other sociodemographic factors not assessed here, such as socioeconomic status, as potential moderators in profile formation and interpretation. Furthermore, although recruitment targeted both students and non-students, information on participants’ student status was not collected, preventing any comparison between these groups and limiting the ability to assess how well the sample represents the broader emerging adult population. Second, reliance on a single instrument (the HSP scale) constrained interpretive depth, as latent profiles were identified solely from sensitivity scores without validation against external correlates. Including additional measures would strengthen interpretation by situating profiles within the broader context of personality characteristics and external factors. Finally, the focus on emerging adulthood provided valuable insights but limits conclusions about SPS stability across the lifespan. Whether the identified profiles—particularly the Mild-sensitivity group—reflect enduring individual differences, age-specific dynamics, gender-specific influences, or a combination of these factors remains unclear. Longitudinal and cross-age studies are needed to clarify developmental patterns of SPS.
In sum, this study confirmed the validity of the three-factor structure of the Lithuanian HSP scale and identified four distinct sensitivity profiles among emerging adults. These findings advance the cross-cultural understanding of sensory processing sensitivity and demonstrate the value of combining variable- and person-centered approaches to capture its nuanced expression. The validated scale and identified profiles provide a foundation for future work on psychological assessment and tailored interventions, while also highlighting the need for longitudinal and cross-cultural studies to examine how SPS develops and functions across different contexts and life stages.
Footnotes
Funding
The authors received no financial support for the research, authorship, and/or publication of this article.
Declaration of Conflicting Interests
The authors declared no potential conflicts of interest with respect to the research, authorship, and/or publication of this article.
Transparency and Openness Statements
The raw data and materials used in this study are not openly available but are available upon request to the corresponding author. No aspects of the study were pre-registered.