
Abstract
Background
Registered nurses (RNs) represent the largest segment of the health care workforce and have unique job demands and occupational health considerations. The purpose of this study was to describe the incidence, cost, and causes of occupational injuries among RNs in Washington State and to quantify the cumulative cost and burden of each type of injury, relative to all injuries among RNs.
Methods
Annual injury claims data covered under Washington State workers’ compensation (WC) fund were analyzed over a 13-year period (2007–2019). Annual mean incidence and cost of injuries were calculated and stratified by nature, source, and event/exposure. Negative binomial regression models were used to examine trends in injury incidence over time, for injury incidence overall, and by the most common injury classifications.
Results
Between 2007 and 2019, 10,839 WC claims were filed and accepted for Washington State RNs (annual M = 834), totaling more than US$65 million. No significant trend in overall injury incidence was observed (incidence rate ratio [IRR]: 0.99, 95% confidence interval [CI] = [0.94, 1.05]). The most common injury exposures were bodily reaction and exertion, contact with objects and equipment, falls, and assaults and violent acts.
Discussion
To our knowledge, this is the first broad study of the incidence and costs of occupational injuries among RNs across all workplace settings. We identified high-cost, high-frequency incidence rates of musculoskeletal, sharp, and violence-related occupational injury claims, highlighting intervention targets. Implications for Occupational Health Practice: Policy makers, health systems, and occupational health nurse leaders can use this information to identify priority areas where evidence-based occupational health and prevention programs are most needed.
Background
In 2022, more than five million registered nurses (RNs) were employed in the United States (American Association of Colleges of Nursing [AACN], 2023). This occupational group experiences unique physical and psychological demands and occupational health considerations (Broetje et al., 2020). Occupational injuries are associated with deleterious consequences for workers, including not only pain and disability from the injury itself but also sequelae including personal financial burden, psychosocial morbidity, family and social problems, and can affect the quality of patient care (Gu et al., 2020, Occupational Safety and Health Administration, n.d.). Historic research has shown that for employers and society, consequences of occupational injuries contribute to job turnover and attrition, and high medical and time loss costs (Brewer et al., 2012; Charney & Schirmer, 2007; Waehrer et al., 2005). Recent research has linked inadequate staffing and greater nurse-to-patient ratios to increased occupational injury, intent to leave, and job dissatisfaction (Bae, 2023; Shin et al., 2018).
The work demands for RNs differ from those of other health care professions. According to the AACN (2023), nurses represent one of the largest groups of the U.S. workforce in addition to the largest segment of the health care workforce. The AACN (2023) also notes nurses are the primary providers of in-hospital patient care and deliver most of the nation’s long-term care. Compared with other groups of health care workers, RNs provide the most hours of direct patient care and spend the most time with patients through the care continuum, which increases their time at risk for injury (Butler et al., 2018).
The physical and psychological demands that RNs face in the workplace are considerable. In 2017, nurses were one of the top three occupational groups with the highest rates of musculoskeletal disorders (MSDs) and are recognized as a “high risk occupation” by the National Institute for Occupational Safety and Health (NIOSH; Richardson et al., 2018). Repositioning, lifting, and manually transferring patients often requires heavy manual exertion and lifting amounts of weight that far exceeds Water’s historically calculated maximum acceptable weight limit of 35 pounds for manual patient handling (NIOSH, 2023; Richardson et al., 2018). These substantial physical work demands are exacerbated by factors like long work hours, mandatory overtime, unsafe staffing, high patient acuity, and other stressful working conditions and contribute to increased risk of MSDs and absenteeism (Krishnan et al., 2021; Richardson et al., 2018). Substantially increased risk of musculoskeletal injuries has also been reported in relation to perceived physical work demands among RNs (Amin et al., 2020).
Outside of the physical demands of the nursing occupation, caring for patients psychologically affects RNs as well. Concepts that have been used to describe aspects of the emotional cost of caring include burnout, secondary traumatic stress, vicarious trauma, compassion fatigue, moral distress, moral injury, and nurse-specific trauma, a phenomenon that has only recently been conceptualized in the literature (Foli, 2022; Foli et al., 2021; Wei & Horton-Deutsch, 2022). These psychological phenomena tangibly affect nurses, their organizations, and their patients (Schmidt & Reem, 2020). Sequelae to the aforementioned concepts can include depression, post-traumatic stress disorder, addiction, other mental health disorders, and increased risk for nurse suicide (Schmidt & Reem, 2020).
Previous research on injury risk or prevention among RNs has focused on either specific injury types and/or settings where injuries occur. For example, historic studies of RNs across all (or many) workplace settings may focus on musculoskeletal injuries, violence, or needlesticks or sharp injuries (Clarke, 2007; Davis & Kotowski, 2015; Gilchrist & Pokorná, 2021; Park et al., 2015). Broader studies that report occupational injuries overall have focused specifically on RNs employed in a single health care setting, such as hospitals (Perhats et al., 2012; Stone & Gershon, 2006). A 2015 study by Gomaa and colleagues analyzed data from the Occupational Health Safety Network to summarize the incidence of occupational of injuries among health care workers, including RNs (Gomaa et al., 2015). These data, while comprehensive, provide only a partial description of injuries among RNs, given that Occupational Health Safety Network data are voluntarily provided and subject to potential participation bias. Furthermore, data are derived from a limited number of health care facilities across 19 states.
The purpose of this study was to describe the incidence, cost, and causes of occupational injuries among RNs in Washington State from 2007 to 2019 and to quantify the cumulative cost and volume burden of each type of injury, relative to all injuries among nurses over the 13-year period.
Methods
This study used publicly available annual injury data for RNs with approved workers’ compensation (WC) claims in Washington State and statewide labor estimates of employed RNs from the NIOSH Employed Labor Force (ELF) query system to estimate annual mean incidence and cost of RN injuries. Estimates were stratified by the nature and source of injury, as well as the event/exposure attributed to the injury. Negative binomial regression models were used to examine trends in injury incidence over time, for injury incidence overall, and by the most common injury classifications.
Data Sources and Study Population
Workers’ compensation in Washington State is administered by the Washington Department of Labor and Industries (L&I). Washington State is one of the only four states that operate an exclusive State Fund (i.e., no private WC insurers operate in the state), which provides WC coverage for approximately 75% of workers specified by the Industrial Insurance Act (State of Washington, n.d.). The Washington Department of Labor and Industries performs the functions of an insurer for State Fund claims and administers the state WC system. Population-based WC claims data from the Washington State Fund have been used them to describe injury trends and evaluate occupational health policies and interventions (Dong et al., 2004; Sears et al., 2021). This study utilizes annual injury data for RNs in Washington who were covered under the State Fund (publicly available from L&I). Injury data include the annual number of and total annual costs for incident WC claims. Data are categorized by Standard Occupational Classification 2000 (SOC2K) code, based on occupational information presented on the initial report of accident. Standard Occupational Classification 2000 codes for RNs (29-1110) include advanced practice nurses, such as nurse practitioners, clinical nurse specialists, certified nurse midwives, and certified RN anesthetists (Bureau of Labor Statistics [BLS], 2016). Annual data are aggregated by fiscal year (e.g., 2019 = July 1, 2018, to June 30, 2019).
The summed count and total costs for all RN WC claims were summarized annually according to three Occupational Injury and Illness Classification System (OIICS) v1.01 hierarchical coding structures (Centers for Disease Control and Prevention, n.d.). Occupational Injury and Illness Classification System coding structures classify the following injury or illness characteristics: (a) nature, (b) source, and (c) event or exposure. Nature describes the principal physical characteristics of the injury or illness and consists of nine major divisions, such as “Traumatic injuries and disorders.” Source categorizes the primary factor responsible for or precipitating the injury or illness into 10 major headings (e.g., “Machinery”). Event, or exposure, describes the manner in which the injury or illness occurred and consists of eight headings (e.g., “Falls”). Within each of the structures, headings can be broken down up to 10 subheadings.
Total paid-to-date costs are reported for closed claims and the greater of estimated claim costs or paid-to-date costs are reported for open claims. Estimated claim costs are actuarial-based cost forecasts based on file review by a claims management expert. Costs include reimbursed amounts for medical care, pharmacy, vocational rehabilitation, and time loss (wage replacement benefits).
Statewide labor estimates of employed RNs were obtained from the NIOSH ELF query system, which weights cases from Current Population Survey (CPS) data to produce population estimates of employed persons (NIOSH Division of Safety Research, n.d.). Labor estimates for RNs were identified using the occupational codes 3130 (for 2007–2010) or 3255, 3256, 3257, and 3258 (for 2011–2019) based on an employee’s primary job, outlined in Supplemental Table 1 (U.S. Census Bureau, 2022). Two types of estimates were extracted from ELF: number of workers (sum of weighted numbers of employees from CPS data) and full-time equivalents (FTE; number of workers employed 40 hours per week for 50 weeks). Other ELF selection criteria included age ≥16 years and composited final weight for survey sampling. Employed Labor Force data were generated by month and aggregated into fiscal years to correspond with the WC data.
Data Analysis
Annual injury incidence rate and total annual injury cost were calculated as primary measures, with each measure stratified by the nature of injury, source of injury, and injury event/exposure. Measures were summarized in terms of the number of RNs (claims or cost per 100,000 workers) and the number of FTE RNs (claims or cost per 10,000 FTE). Annual summary statistics for number and cost of injuries (over the whole study period) were calculated using means and standard deviations.
Regression models were used to model linear trends in injury incidence over time. The Vuong test indicated overdispersion of the data, so negative binominal regression models were preferred over Poisson. Separate models were constructed for injury incidence overall and by the most common injury classifications (event/exposure, nature, and source). Models included a continuous variable for year and adjusted for denominator at risk (FTE). Results of negative binomial models are expressed as incidence rate ratios (IRRs) with 95% confidence intervals (CIs). Statistical significance was defined as p ≤ .05 and all statistical tests were two-tailed. We used Stata/MP v.15 for all analyses (StataCorp, LP, College Station, Texas).
Results
Over the 13-year study period, 10,839 WC claims were filed and accepted for RNs in Washington State, totaling more than US$65 million (Table 1). An average of 834 claims were filed annually (range: 771–908). No significant trend in the overall injury incidence rate was observed using negative binomial regression when examining the data by FTE (IRR: 0.99, 95% CI = [0.94, 1.05]) or by the number of workers (IRR: 1.00, 95% CI = [0.95, 1.05]) (Table 2).
Annual Incidence and Costs of RN Workers’ Compensation Claims in Washington State, 2007 to 2019
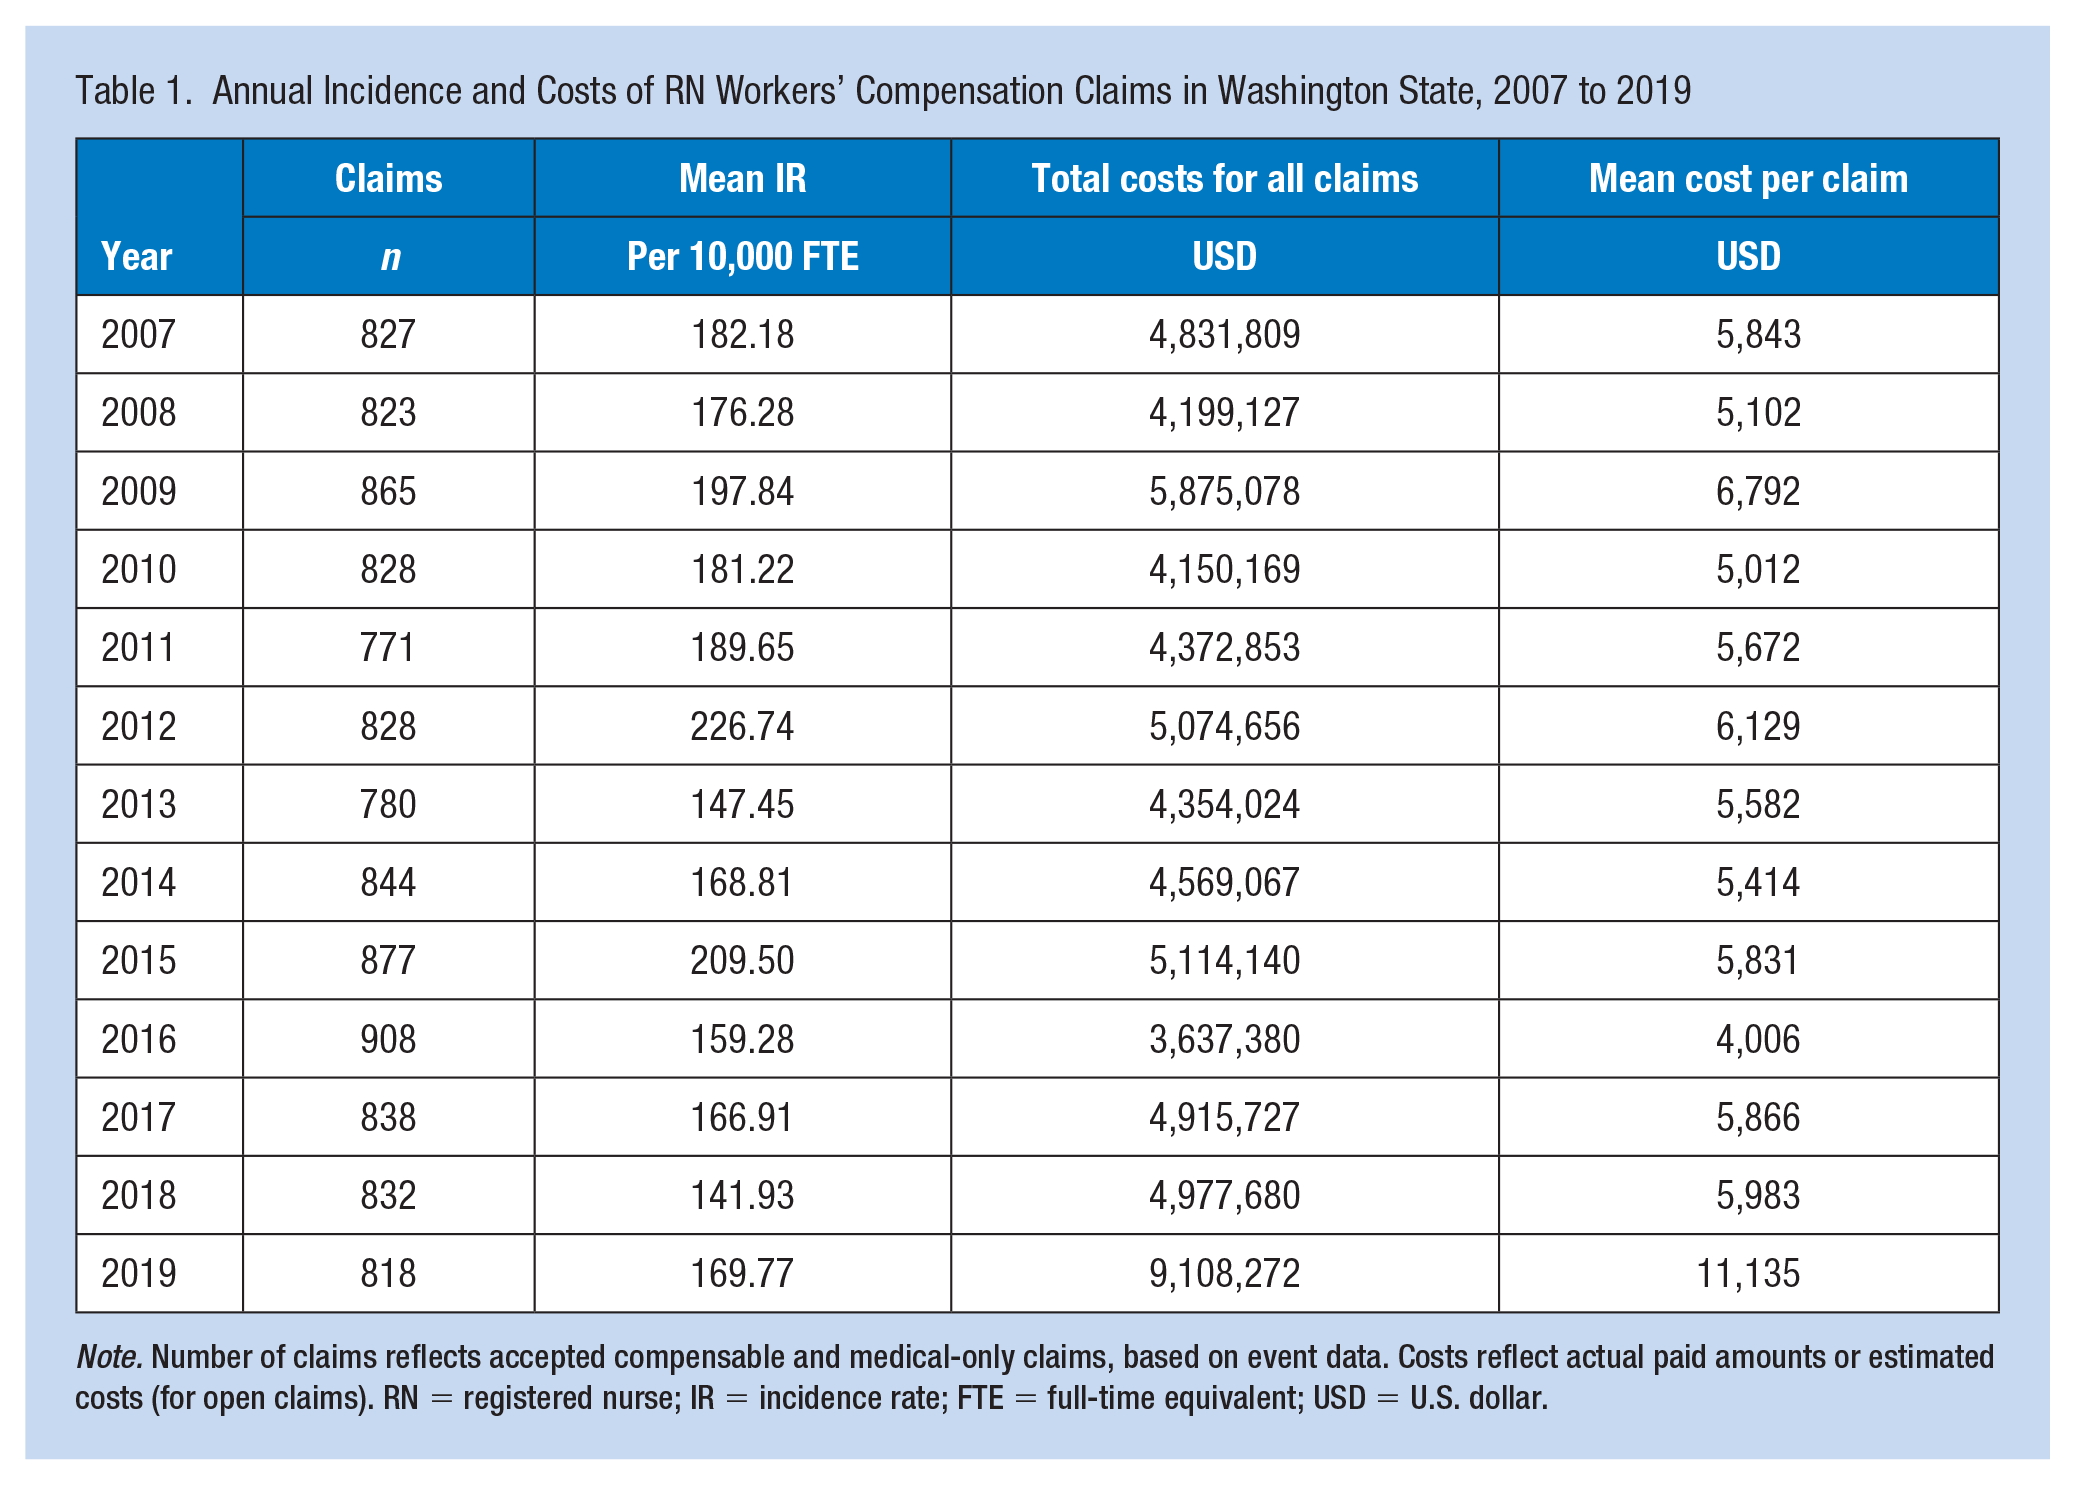
Note. Number of claims reflects accepted compensable and medical-only claims, based on event data. Costs reflect actual paid amounts or estimated costs (for open claims). RN = registered nurse; IR = incidence rate; FTE = full-time equivalent; USD = U.S. dollar.
Incidence Rates and Costs for Occupational Injuries Among RNs in Washington State, 2007 to 2019, Classified by OIICS Categories for Injury Event/Exposure, Nature, and Source
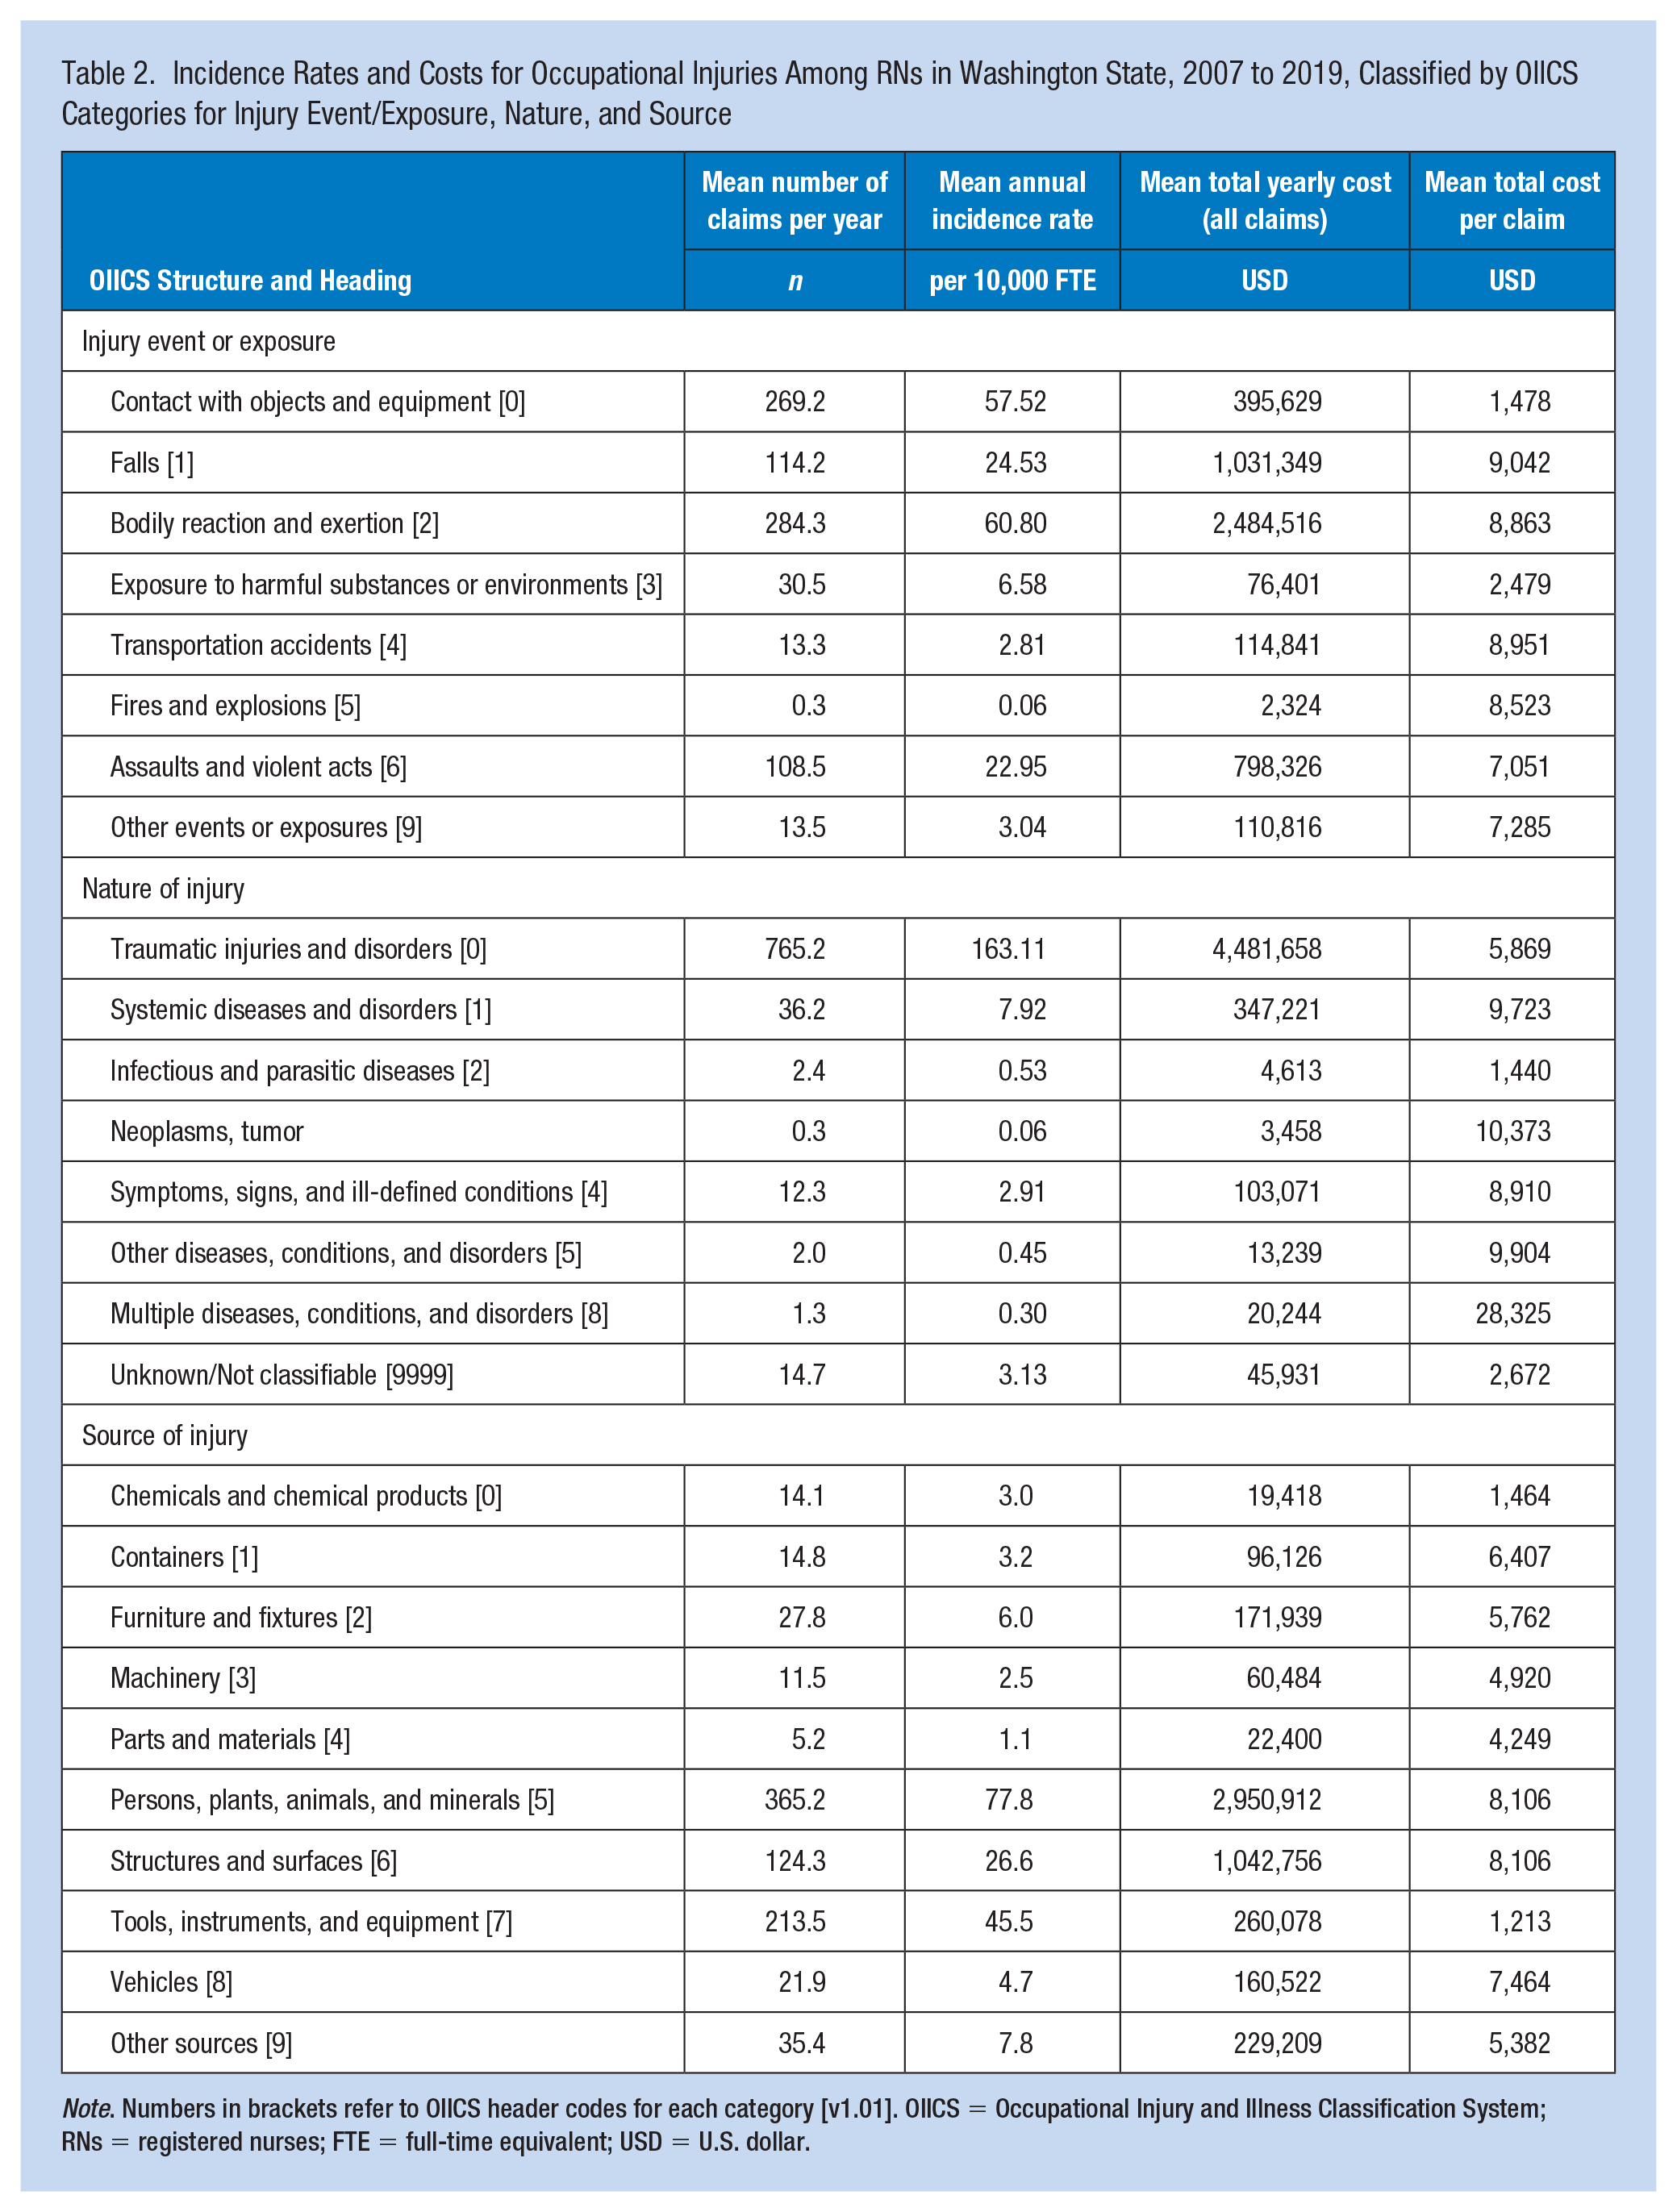
Note. Numbers in brackets refer to OIICS header codes for each category [v1.01]. OIICS = Occupational Injury and Illness Classification System; RNs = registered nurses; FTE = full-time equivalent; USD = U.S. dollar.
Injury Event/Exposure
The most common RN injury exposures, based on incidence rate per 10,000 FTE, were (in order of magnitude) (a) bodily reaction and exertion, (b) contact with objects and equipment, (c) falls, and (d) assaults and violent acts (Table 2). Injury claims associated with these classifications were also the four most costly; however, while injuries associated with assaults and violent acts occurred less frequently than those due to contact with objects and equipment, they were more costly (Table 2). For the most common exposures (noted above), no significant trends in incidence were observed over the 13-year time period: bodily reaction and exertion (IRR: 0.97, 95% CI = [0.87, 1.09]), contact with objects and equipment (IRR: 1.00, 95% CI = [0.90, 1.11]), falls (IRR: 0.99, 95% CI = [0.87, 1.13]), and assaults and violent acts (IRR: 1.01, 95% CI = [0.91, 1.13]).
Subclassfications of injury events/exposures showed that overexertion was the most common injury event (41.7 injuries per 10,000 FTE), followed by those associated with being struck by an object (34.9 injuries per 100,000 FTE), assaults and violent acts by a person (20.5) and fall at the same level (20.1) (Supplemental Table 2).
Nature of Injury
When classifying injuries by OIICS nature of injury, traumatic injuries and disorders had, by far, the highest incidence and costs (Table 2). Over the 13-year timeframe, there were 9,947 claims for traumatic injuries and disorders, resulting in a mean incidence rate of 157.1 injuries per 10,000 FTE and an average annual cost of 4,481,658 (SD: 1,408,155). The annual incidence rate of traumatic injuries and disorders did not change over the time period (IRR: 0.99, 95% CI = [0.92, 1.06]).
Most common among traumatic injuries included those involving muscles, tendons, ligaments, and joints (63.77 per 10,000 FTE) and open wounds (44.91 per 10,000 FTE). While considerably less common than traumatic injuries to muscles, tendons, ligaments, and joints (7.64 per 10,000 FTE), the mean cost per claim associated with injuries of the bones, nerves, and spinal cord was 50% higher (Supplemental Table 3).
Source of Injury
Between 2007 and 2019, occupational injuries originating from persons, plants, animals, and minerals were most common among RNs, with a mean annual incidence of 75.0 per 10,000 FTE and resulting in a mean annual cost of US$2,950,912 (Table 2). Second most common were injuries associated with tools, instruments, and equipment (43.79 per 10,000 FTE, mean annual cost US$260,078). Structures and surfaces were less common sources of injury (25.67 per 10,000 FTE); however, they were more costly (mean annual cost US$1,042,756; Table 2). The annual incidence rate of injuries associated with persons, plants, animals, and minerals remained steady over the 13-year study period (IRR: 1.00, 95% CI = [0.88, 1.13]), as did the rates for injuries due to tools, instruments, and equipment (IRR: 1.01, 95% CI = [0.88, 1.17]) or structures and surfaces (IRR: 0.99, 95% CI = [0.86, 1.14]).
Within the OIICS header category of persons, plants, animals, and minerals, the most common injury source subcategory was persons (other than injured or ill worker), which were associated with 55.88 injuries per 10,000 FTE (Supplemental Table 4). Injuries attributable to medical and surgical instruments were also relatively common (39.19 per 10,000 FTE).
Discussion
This study describes the incidence, cost, and causes of occupational injuries among RNs in Washington State over a 13-year time period, prior to the COVID-19 pandemic. We sought to quantify the cumulative cost and volume burden of each type of injury, relative to all RN injuries. Our results showed steady injury incidence rates observed over this time period, with high-cost and/or high-frequency subcategories representative of musculoskeletal injuries, needlestick injuries, and injuries from violence, indicating where evidence-based interventions are most needed. These stable rates were observed despite the marked decline in WC claims over time, which the authors believe to be more likely attributable to underreporting than decreases in injuries. While this study identified no significant trends pertaining to incidence rates, it does provide insight into the most common and costly events/exposures (way injury occurred), nature of injuries (principal physical characteristics), and sources (primary responsible factor) over time for RNs working across settings in Washington State.
To our knowledge, this is the first comprehensive and long-term study of occupational injuries among RNs across all work settings. While there are no similar studies to the authors’ knowledge for direct comparison, our findings align with Liberty Mutual’s 2019 Workplace Safety Index report for health care and social assistance sector employees (Liberty Mutual Group, 2019). This report lists overexertion, same level falls, and intentional injury by another person as the top three sources of WC direct costs for nonfatal claims with more than 5 days away from work. Our study identified the highest mean annual incidence rates and cost for injury event/exposure for (a) bodily reaction and exertion (US$2.5 million), (b) contact with objects and equipment (US$395,629), (c) falls (US$1 million), and (d) assaults and violent acts (US$798,326) (listed in the order of magnitude of IR; Table 1).
In our study, musculoskeletal injuries are represented across all three stratifications of event/exposure, nature, and source. In the event/exposure classification, overexertion refers to “excessive physical effort directed at an outside source of injury/illness” and includes manual patient handling activities like turning, lifting, pushing, or pulling (U.S. Department of Labor and the BLS, 2012). Supplemental Table 2 shows this subcategory had the highest mean annual IR per 10,000 FTE (41.7) among all event/exposure subcategories. By nature classification, Supplemental Table 3 shows the subcategory with the highest mean annual incidence rate per 10,000 FTE was traumatic injuries to muscles, tendons, ligaments, and joints (66.1 per 10,000), inclusive of dislocations, herniated disks, sprains, strains, and tears. Finally, in the source of injury category, person other than injured or ill worker (which includes patients) was the subcategory with the highest mean annual IR per 10,000 FTE (55.9) and annual total cost (US$2,121,462).
Considering the NIOSH Hierarchy of Controls, substitution, engineering, and administrative controls can help mitigate additional risk for nurses at risk for musculoskeletal injuries. A 2018 review of interventions to decrease musculoskeletal injuries among identified multicomponent intervention programs included patient lift systems, education/training in patient handling, cognitive behavioral therapy, peer coaching, fitness training, and footwear as intervention categories with minimal evidence of impact/success (Richardson et al., 2018). These programs may include combinations of state- or workplace-level policies (Lee et al., 2019). Authors concluded there is a need for additional, higher quality studies in this area.
Sharp injuries are another common, recognized occupational hazard among nurses. In this study, when looking at the nature of injury, the subcategory with the second highest mean annual incident rates were open wounds (44.9), which includes needlestick injuries in which there was no further diagnosis (Supplemental Table 3). In Supplemental Table 4, medical and surgical instruments was the subcategory with the second highest mean annual incidence rate per 10,000 FTE (39.2), inclusive of injuries from needles, syringes, scalpels, and surgical knives (collectively known as sharps) (NIOSH, 2021; Ou et al., 2022; U.S. Department of Labor and the BLS, 2012). A 2021 Cochrane Review pertaining to prevention of sharp injuries through education and training interventions only reveals small reductions in sharp-related injuries among health care workers (Cheetham et al., 2021). Substitution and engineering controls—like the stocking and use of needle alternatives, safety engineered devices, and convenient placement of sharp disposal containers—can help mitigate additional risk for nurses (NIOSH, 2021; Ou et al., 2022).
Violence against nurses and other health care workers is considered endemic in health care organizational culture and has reached epidemic proportions. Press Ganey recently estimated that two nurses are assaulted every hour in U.S. hospitals, with the highest rates seen in emergency department, behavioral health, and pediatric units (Press Ganey, 2022). In 2019, Liberty Mutual estimated that violence against health care industry workers generated US$450 million in WC costs annually (claims that required more than 5 days away from work) (Liberty Mutual Group, 2019). Indirect costs not covered or captured by WC include temporary/permanent replacement staff while the worker recovers. The psychological impact on the nurse can lead to additional operational losses and risks, like increased use of sick time and turnover, reduced quality of care, decreased efficiency, increased medical errors, increased insurance costs and security needs, and even regulatory noncompliance (Enos, 2022).
In this study, assaults and violent acts had the third highest mean annual IR per 10,000 FTE in the event/exposure category (20.5), with a mean total annual cost of just under US$800,000. This subcategory includes verbal assaults and threats, sexual assault, self-inflicted violence, and other behaviors such as hitting, kicking, or shoving regardless of intent. Programmatic approaches to prevent injuries from workplace violence are recommended, but evidence remains very limited and prevention program success is thought to be largely dependent on the culture of the work environment (Spelten et al., 2020). Engineering controls, like bulletproof glass, increasing staff visibility, controlled building access, and video surveillance systems, may be useful in preventing nurse injury from violence. Interventions like user-friendly incident reporting, violence risk assessment tools, incident response teams, and entry procedures are examples of administrative controls (Enos, 2022). Regular staff training in de-escalation and crisis management may be helpful as well. Health care organizations and leaders should ensure nurses have access to mental health resources to process traumatic events, including incidences of workplace violence (Foli et al., 2021).
Limitations
This study utilized two different data sets to calculate and describe the incidence, cost, and causes of occupational injuries among RNs in a single state. The nature of the data used in this study, coupled with high levels of underreporting, suggests that our results reveal the tip of the iceberg, especially when it comes to workplace violence (WPV), (Byon et al., 2022; Kyung et al., 2023). The data used here reflect described injuries accepted and covered by the Washington State WC fund. Therefore, this study did not capture costs for occupational injury not covered by WC. Standard Occupational Classification 2000 codes for RNs (29-1110) include advance practice nurses, such as nurse practitioners, clinical nurse specialists, certified nurse midwives, and certified RN anesthetists, which may suppress some of the potential trends among RNs who spend more time in direct patient care roles and have not specialized as advanced practice nurses/providers (BLS, 2016).
Detailed demographic information like race/ethnicity, work tenure, and age was not available, and workplace characteristics like the work environment (setting/site/department), staffing levels, shiftwork, and shift durations are unknown as well. Workers of color face more barriers to reporting occupational injuries and illness, and this underestimation could be reflected in the data used in this analysis (Kyung et al., 2023; Sabbath et al., 2017).
Future Research
These results illustrate the opportunities for health systems to further examine setting- or site-specific injury rates among nurses and implement occupational intervention programs. The Institute for Healthcare Improvement offers an Implementation Resource Guide with strategies to equitably and measurably improve safety for health care workers (National Steering Committee for Patient Safety, 2020). Evidence-based programmatic approaches that employ substitution, engineering, or administrative controls may better be able to mitigate risk for nurses, but more research regarding the effectiveness of these intervention types is needed. Research regarding the implementation of programmatic approaches to address workplace violence injuries is urgently needed. The psychological impact of avoidable sources of nurse-specific trauma on RNs, their organizations, and the patients they care for needs to be examined in future studies (Foli et al., 2021). Nurse employers should also consider how factors such as long work hours, mandatory overtime, unsafe staffing, and high patient acuity contribute to increased risk of nurse occupational injuries and future research should quantify excess risk from these factors as well (Richardson et al., 2018).
Conclusion
The wellbeing of the nurse workforce is a prerequisite to providing patients with safe, quality care (National Steering Committee for Patient Safety, 2020). As the bidirectional relationship between nurse wellbeing and patient safety and quality care becomes increasingly apparent, health care organizations will be expected to better care for nurses as an occupational group. This baseline epidemiological study reveals the burden and cost of accepted Washington State fund WC claims for nurses over a 13-year period of time. The COVID-19 pandemic resulted in a unique and challenging health care work environment and novel exposures arose or were exacerbated during the pandemic (Byon et al., 2022; Foli et al., 2021; Lake et al., 2022; Zhang, 2021). Because the pandemic and related sequelae are ongoing and represent a separate time period, these data were not included in this study. Policy makers, health systems, and occupational health nurse leaders can use this information to help identify priority areas where implementation of occupational health and prevention programs is most needed.
Applying Research to Occupational Health Practice
This study examined 13 years of WC claims data for RNs in Washington State, totaling more than US$65 million. The overall injury incidence rate did not show a significant trend over the study period. The most common and costly claims for RNs included musculoskeletal injuries, sharps-related injuries, and injuries from assaults and violent acts.
These findings have implications for occupational health nursing practice, health systems, and policy makers. Occupational health nurses and health systems can focus on interventions and policies at the higher levels of the National Institute for Occupational Safety and Health’s Hierarchy of Controls (i.e., elimination, substitution, or engineering controls) to prevent the most common and costly injuries among this occupational group.
This is the first comprehensive and long-term study of occupational injuries among RNs across all work settings and provides valuable insight into the incidence, cost, and causes of occupational injuries among RNs, highlighting areas where evidence-based interventins are needed to improve occupational health and safety of workers in the nursing profession.
Note. WC = workers’ compensation; RNs = registered nurses.
Footnotes
Acknowledgements
None
Author Contributions
Study concept and design: JMG and JMS.
Critical revision of the manuscript; drafting of the manuscript; and data acquisition, analysis, and/or interpretation: TA, JMG, and JMS.
Statistical analysis: JMG.
Obtained funding: JMG and TA.
Conflict of Interest
The author(s) declared no potential conflicts of interest with respect to the research, authorship, and/or publication of this article.
Funding
The author(s) disclosed receipt of the following financial support for the research, authorship, and/or publication of this article: This research was funded by the Oregon Healthy Workforce Center pilot grant through U19OH010154, National Institute for Occupational Safety and Health, Center PI: WK Anger, Pilot PI: J Graves. Research reported in this publication was supported by the National Institute for Occupational Safety and Health (under Federal Training Grant T42OH008433for T. Amberson). The content is solely the responsibility of the authors and does not necessarily represent the official views of NIOSH.
Supplemental Material
Supplemental material for this article is available online.
Institution and Ethics Approval and Informed Consent
This study was determined exempt from human subjects review by the Washington State University institutional review board.
References
Supplementary Material
Please find the following supplemental material available below.
For Open Access articles published under a Creative Commons License, all supplemental material carries the same license as the article it is associated with.
For non-Open Access articles published, all supplemental material carries a non-exclusive license, and permission requests for re-use of supplemental material or any part of supplemental material shall be sent directly to the copyright owner as specified in the copyright notice associated with the article.