
Abstract
Background:
Agricultural workers are disproportionately at risk for heat-related morbidity and mortality. The purpose of this study was to explore how sociocultural and occupational factors, and environmental heat stress influenced fluid intake and hydration status among Latino farmworkers working in eastern North Carolina.
Methods:
A community-informed, mixed methods research study was conducted in partnership with staff at a federally qualified health center. In summer 2020, we recruited Latino farmworkers at migrant camps. Twenty-eight male, migrant farmworkers participated in focus group discussions and 30 completed surveys and provided urine specimens. Wet bulb globe temperatures were measured in fields where workers labored. Content analysis and parametric analyses were performed. Data integration was completed using a meta-matrix.
Results:
Prior to work, 46.7% of farmworkers’ urine specific gravity measurements indicated dehydration, which increased to 100% after work. The farmworkers spent between 2 and 7.5 hours of their day working in conditions above the recommended limits for workplace heat exposure. Farmworkers described exposure to extreme heat and inconsistent occupational policy compliance. Farmworkers expressed the opportunity to drink water but accessibility and poor water quality limited hydration. The integrated data supported congruent findings of extreme heat, few work breaks, and substandard housing.
Conclusion/Application to Practice:
Farmworkers are dehydrated at work, placing them at higher risk for heat-related illness (HRI). By engaging with agricultural stakeholders, occupational health nurses can combine efforts and advocate for effective health and safety work policies to reduce HRIs and deaths among farmworkers. Legislation stipulating cooling and hydration practices would support safer work environments.
Background
Agricultural farmworkers experience significant occupational health and safety hazards, including extreme outdoor heat (Chicas et al., 2022). In the United States from 2000 to 2010, agricultural workers were 35 times more likely to die from heat-related illness (HRI) than all workers in other industries (Gubernot et al., 2015). Among agricultural workers, Latinos had the highest HRI mortality rate compared with non-Latinos (Gubernot et al., 2015). Due to increasing temperatures from climate change, environmental heat stress in the United States and around the globe are at record levels and the rates of HRI and death are on the rise (Ebi et al., 2018).
North Carolina (NC) ranks among the top leading agricultural states in the United States, with more than 52,000 farms (National Association of State Departments of Agriculture, 2022). The NC agricultural industry relies more heavily on migrant and seasonal farmworkers than most states (North Carolina Department of Health and Human Services, 2021); many (95%) of the farmworkers are from Mexico and Central America (Lambar & Thomas, 2019). The state has a disproportionately higher HRI fatality rate among farmworkers compared with other states (Lambar & Thomas, 2019). From 1992 to 2006, an estimated 68 HRI crop workers deaths occurred in NC, the highest annualized death rate in the United States (Luginbuhl et al., 2008). The climate of NC is warm and humid (Frankson et al., 2019) and farmworkers there work 60 to 72 hours per week, under direct sunlight, in field crops that require exertional labor (Kearney et al., 2016; Lambar & Thomas, 2019). In tobacco fields, farmworkers wear clothing to help reduce exposures to nicotine and pesticides (Kearney et al., 2016), which can increase the risk for HRI (National Institute for Occupational Safety and Health [NIOSH], 2016). According to findings from two NC studies, most farmworkers experienced symptoms of HRI while working outdoors (Arcury et al., 2015; Kearney et al., 2016), yet changing the duration, intensity, or hour of day worked were uncommon HRI preventive practices (Arcury et al., 2015).
The most severe type of HRI is heat stroke and can lead to acute organ failure, severe injuries, and death (Epstein & Yanovich, 2019). Less is known about the long-term effects of heat stress. Scientists are actively investigating an epidemic in equatorial countries known as chronic kidney disease of uncertain etiology (CKDu). This form of chronic kidney disease is more common among young agricultural workers and is contributed to rising outdoor temperatures, exertional activity, and chronic dehydration—although the science is still unclear (Crowe et al., 2019; Johnson et al., 2019).
Occupational HRI death is largely preventable (NIOSH, 2016). Efforts to mitigate HRI include proper hydration and frequent work breaks in the shade (NIOSH, 2016). Specific to water intake, farmworkers reported various sociocultural and occupational barriers. Social factors included a preference for sugar-sweetened beverages (Luque et al., 2020) and the humoral practice of choosing dark sodas to restore the body’s balance while working in the heat (Barker et al., 2017). Occupational factors included workdays that were void of or accommodated brief work breaks, long distance to the bathroom facilities (Lam et al., 2013), poor quality of drinking water (Lam et al., 2013; Luque et al., 2019), and piece-rate pay (Lam et al., 2013; Luque et al., 2019; Wadsworth et al., 2019). Piece-rate pay is the employer’s choice to compensate workers by pound or piece of crop produced in a shift (Horton, 2016). Piece-rate pay incentivized fewer bathroom breaks; therefore, farmworkers chose to consume less water (Luque et al., 2019; Wadsworth et al., 2019).
A few studies have included physiological markers of hydration among U.S. farmworkers (Mix et al., 2018; Moyce et al., 2017; Vega-Arroyo et al., 2019). Measuring urine specific gravity (USG) with a refractometer, Mix and colleagues (2018) found 50% of 192 farmworkers in Florida were dehydrated pre-shift and 80% were dehydrated post-shift. Measuring pre- and post-shift body mass among farmworkers in California, Moyce et al. (2017) and Vega-Arroyo et al. (2019) found 14.3% of the 283 farmworkers to be dehydrated and 12% developed an acute kidney injury during a working day, despite 2 to 3 L of fluid intake.
California is one of only two states to adopt permanent occupational standards for HRI prevention in outdoor environments (Heat Illness Prevention in Outdoor Places of Employment of 2006, § 3395; Outdoor Heat Exposure of 2003, WAC 296-62-095). On the federal level, there are no occupational safety and health regulations that address HRI prevention. As of October 2021, the Occupational Safety and Health Administration (OSHA) initiated the rulemaking process to develop a heat-specific workplace standard (Heat Injury and Illness Prevention in Outdoor and Indoor Work Settings of 2021, 29 CFR 1910), although this can take as long as ten years before becoming regulation (Wittenberg, 2021).
To protect farmworkers from the disproportionate risk for heat-related mortality and provide further insight into farmworker kidney health, it is important to first understand farmworker fluid intake and hydration status. To date, there have not been any published studies that have examined hydration status among NC farmworkers. The purpose of this study was to explore how sociocultural and occupational factors, and environmental heat stress influence fluid intake and hydration status among a subset of Latino farmworkers working in eastern NC.
Methods
A community-informed, sequential exploratory mixed methods study was conducted in collaboration with staff at a federally qualified health center (FQHC). We chose a sequential exploratory design to gain comprehensive knowledge and enhance validity through triangulation (Creamer, 2018). This study was informed by Intersectionality theory, which supports the exploration of how sociocultural factors influence behavior, among a traditionally marginalized population (Collins, 2015). A community-informed approach added the emic (insider) perspective (Minkler et al., 2017), while the principal investigator (PI) contributed the etic (outsider) perspective. The research team was composed of the PI, two bilingual Latino FQHC staff, and a bilingual nursing student. This study was built on a pilot study that explored farmworkers’ perceptions of on-the-job hydration (Mizelle & Larson, 2020).
The study setting was four farmworker camps in eastern NC. Data collection occurred during July and August in 2020. These were the hottest months of the year in NC with 29 days and 16 days, respectively, of temperatures above 32°C (90°F) (Raleigh Weather Forecast Office, 2020). There are approximately 1,100 farms (U.S. Department of Agriculture, 2019) and 2,300 farmworkers (Lambar & Thomas, 2019) working in the six-county FQHC service area during peak harvest.
The research team sought permission from local farmers to recruit farmworkers. Ten farmers, who had previous relationships with the FQHC staff, were contacted via phone. Four allowed access to their farms for recruitment. Over 4 weeks, the research team drove to the migrant camps (temporary housing), shared a bilingual research-specific flyer, and obtained signed informed consent from interested farmworkers. The team read the consent form aloud and answered questions. Inclusion criteria were Latino men and women between ages 18 and 54, English or Spanish speaking, worked >50% outdoors for 8 or more hours per week. Exclusion criteria were self-reported history of recent illness, kidney disease, or use of diuretics.
First, we conducted four focus group discussions (FGDs) with farmworkers to gain diverse perceptions on fluid intake (Mizelle et al., 2022). Next, we collected two surveys, microclimate temperatures and physiological markers; to determine the prevalence of pre- and post-shift dehydration and the associations between sociocultural factors, occupational factors, environmental heat stress and fluid intake with farmworker hydration status.
The four FGDs were conducted in July and August 2020, with five to nine farmworkers in each group, for a total of 28. One moderator (PI) and one bilingual co-moderator (FQHC staff or undergraduate student) facilitated the focus groups using a semi-structured question guide (Krueger & Casey, 2015). In early August, we collected: physiological markers; demographic survey, Beverage Intake Assessment Questionnaire; and wet bulb globe temperature (WBGT). For the quantitative surveys, we invited 43 farmworkers, and 32 agreed to participate, resulting in a 74% acceptance rate. Eighty-seven percent of the final sample (n = 30) took part in the entire study. Participants provided urine samples at their camps, on 1 of 4 days in a sequential 5-day period. Each participant was deidentified and given a unique ID number for tracking purposes.
Physiological Markers
Using reagent strips, we assessed for protein, ketones, blood, and glucose which could alter USG results (Pagana & Pagana, 2018). Farmworker specimens with trace glucose levels and higher, and protein 2+ and higher were excluded from the analysis. Urine specific gravity is quick, non-invasive (Perrier et al., 2017), and a reliable measure of hydration status (Villiger et al., 2018). USG was measured with a digital refractometer, the Palm Abbe model PA202X-093. This refractometer model had a validated linearity with osmolality, and observed error of ≤ 0.1% (Wyness et al., 2016).
Pre-shift, prior to beginning the workday, farmworkers collected their first morning void urine specimen. Research team members informed participants how to correctly collect the clean catch specimen. Refractometer procedures followed the manufacturer’s instructions (MISCO Refractometer, 2014) and clinical laboratory guidelines (Laboratory Corporation of America® Holdings and Lexi-Comp Inc., 2020). The second urine specimen was collected at the end of the workday (post-shift), following the same procedure. All results were recorded and explained to participants on-site. Participants who had abnormal results were referred to local health clinics for follow-up; this occurred in two cases. The latest guidelines from the National Athletic Trainers’ Association were used to categorize the urine specimens; USG <1.020 was considered euhydrated, 1.020 to 1.029 as dehydrated, and ≥1.030 as significantly dehydrated (Casa et al., 2015).
Demographic Survey
The survey included questions on demographics, and social and workplace factors. The research team first developed the survey in English and back translation was used to develop the version in Spanish.
Beverage Intake Assessment Questionnaire
Fluid intake, including quantity, type, frequency, and timing was assessed using the 32-item Beverage Intake Assessment Questionnaire (BIAQ) (Ferreira-Pêgo et al., 2016). The BIAQ was found to have relative validity and good repeatability among a sample of Spanish-speaking adults (Ferreira-Pêgo et al., 2016). The demographic survey and the BIAQ were collected either the night of urine specimen collection, the following Sunday, or on the FGD date. The research team read the survey and BIAQ to each participant and recorded the responses. Farmworkers were offered a US$25 gift card after completion of the FGD and after completion of quantitative data collection.
Wet Bulb Globe Temperature
For all occupational groups, WBGT is the preferred measure of environmental heat stress (NIOSH, 2016). Wet bulb globe temperature accounts for temperature, humidity, wind speed, sun angle and cloud cover. We used the QUESTemp° 34 (3M, Oconomowoc, WI) heat stress monitor, which has demonstrated the least error in relation to the reference standard (Cooper et al., 2017). To measure farmworker microclimate, direct WBGT readings of the participants’ work shift environments were measured every 1 minute. The QUESTemp° 34 was set at the edge of the field, on a tripod, 3.5 feet above the ground (TSI Incorporated, 2018).
The worksite’s current WBGT was compared with the American Conference of Governmental Industrial Hygienists’ (ACGIH®, 2019) Threshold Limit Values (TLVs®), which provides recommended limits for workplace heat exposure. On the day of data collection participants worked in tobacco; therefore, a moderate metabolic rate was assumed (Dillane & Balanay, 2020). Hourly TLVs® were adjusted according to work/rest periods; the farmworkers shift was considered 75% to 100% work/rest and adjusted for short breaks (50%–75%) or longer breaks (0%–25% or 25%–50%). Hourly mean WBGT indices were compared with the estimated TLVs® to determine if the participants exceeded the exposure limit recommendations. The environmental heat stress indices included in the analysis were Mean WBGT, Maximum WBGT, number of hours spent working above the TLVs®, and percent of day working above the TLVs®.
Data Analysis
The audio recordings of the FGDs were transcribed in Spanish and translated into English in Microsoft Word documents. The research team became familiar with FG transcripts through multiple readings and reflections. Content analysis was used to explore the “explicit and covert meanings” in the text (Bernard et al., 2017, p. 243). We first used a deductive approach to coding; matrixes were created, which included concepts from Intersectionality theory and the previous pilot study. Next, we employed an inductive approach to capture unique words from the farmworkers (Bernard, 2011) by highlighting/copying excerpts within the transcripts. Research team meetings occurred biweekly. Parametric analyses were done using SPSS v.27 (IBM Corp., 2020). Descriptive statistics were calculated. Pearson’s product correlation coefficient was used, using Cohen’s guidelines, to examine the associations between cultural and place factors, beverage intake, WBGT with the dependent variable of USG. Statistical techniques utilized to compare groups included paired and independent-sample t-tests and one-way between-groups ANOVA. Data integration was achieved by placing the qualitative and quantitative data and the team’s reflexive notes in a case-by-variable meta-matrix (Creamer, 2018).
The study was approved by the University and Medical Center Institutional Review Board at East Carolina University (UMCIRB-20-001259), which included a COVID-19 pandemic safety plan.
Results
A total of 32 Latino male farmworkers participated in this mixed method study. Of the 32, one farmworker did not provide urine specimens and one specimen was excluded due to glucosuria, resulting in a final convenience sample of 30. The final analysis included 30 pre-shift USG specimens and 25 post-shift specimens. Of the post-shift specimens, one was excluded due to the presence of 2+ protein, one was missing, and three were outliers. From the survey data, all participants were foreign-born migrant workers who had H-2A visas and worked in three counties in eastern NC (Table 1). On the day of data collection, the farmworkers logged fewer hours than a typical workday, because of rain. All workers were paid by the hour instead of piece-rate pay.
Farmworker Survey Data (n = 30)
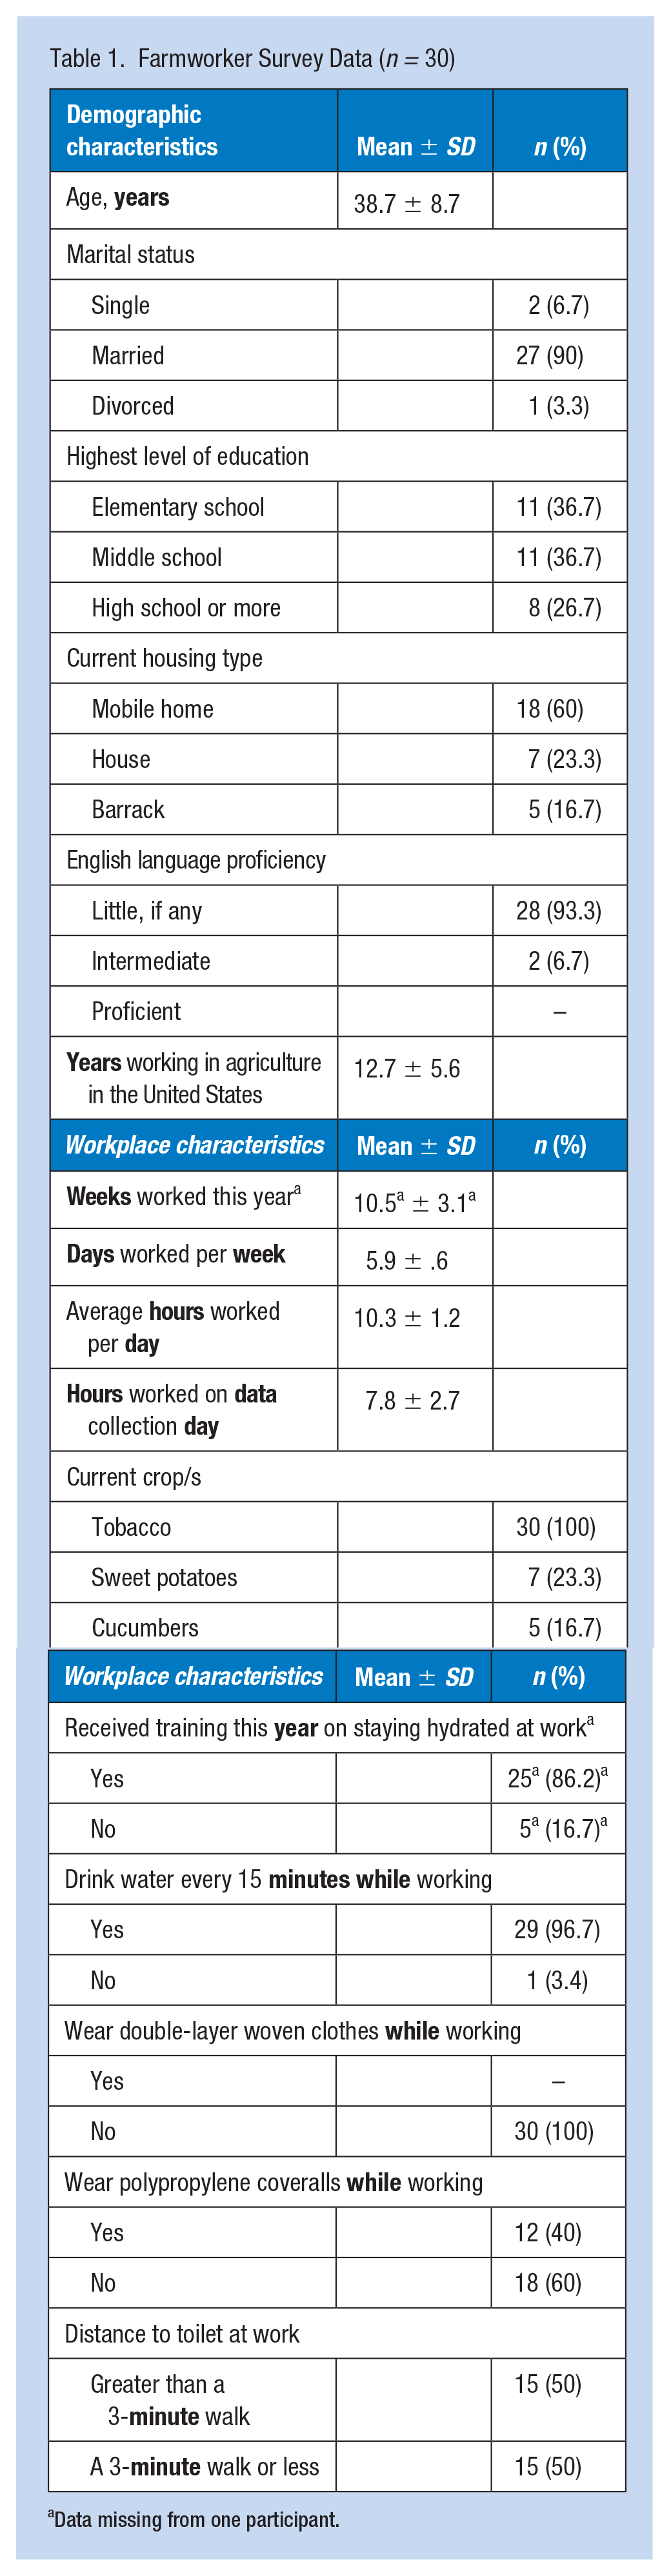
Data missing from one participant.
Sixteen (53.3%) of farmworkers pre-shift USG indicated euhydration and 14 (46.7%) were dehydrated. No farmworkers were considered significantly dehydrated pre-shift. Post-shift, 23 (92%) of farmworkers were dehydrated and 2 (8%) were significantly dehydrated. There was significant increase in USG from pre-shift (M = 1.020, SD = .005) to post-shift (M = 1.026, SD = .003), t (24) = −6.765, p < .001 (two-tailed). Using paired pre-and post-shift data, 100% of participants’ USG measurements increased over the shift, with a mean increase of 0.007 [0.005, 0.009]. The eta-squared statistic (.656) indicated a large effect size. Proteinuria was measured in 16% of the pre-shift samples, increasing to 70% post-shift, although most samples contained trace amounts.
The average fluid intake of this sample of farmworkers was almost four liters/day; composed of 2.5 liters of water (Table 2). Water was consumed during the day but rarely before or after the shift. Water consumption while working was estimated to be 0.2 L/hour. Total fluid consumption while working was estimated to be 0.35 L/hour. On average, farmworkers consumed about 770 mL (two servings) of sugar-sweetened beverages per day.
Average Farmworker Fluid Intake (mL) Per Day (n = 27 a )
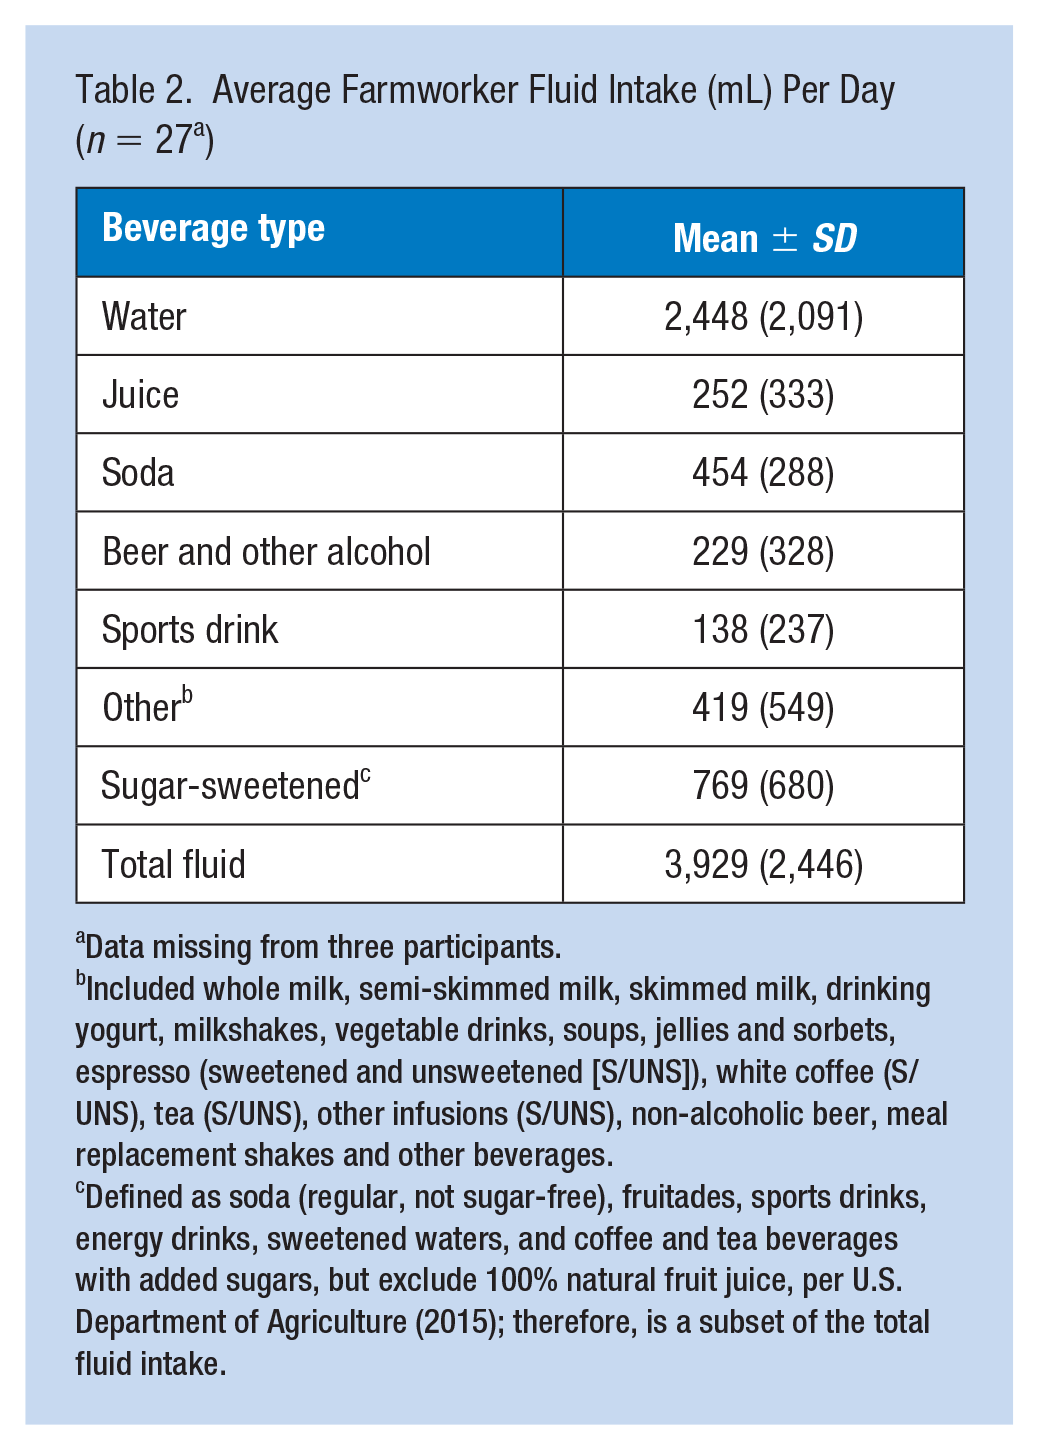
Data missing from three participants.
Included whole milk, semi-skimmed milk, skimmed milk, drinking yogurt, milkshakes, vegetable drinks, soups, jellies and sorbets, espresso (sweetened and unsweetened [S/UNS]), white coffee (S/UNS), tea (S/UNS), other infusions (S/UNS), non-alcoholic beer, meal replacement shakes and other beverages.
Defined as soda (regular, not sugar-free), fruitades, sports drinks, energy drinks, sweetened waters, and coffee and tea beverages with added sugars, but exclude 100% natural fruit juice, per U.S. Department of Agriculture (2015); therefore, is a subset of the total fluid intake.
The mean WBGT on the four collection days was 29.1°C (84.4°F, SD = .979), and the mean maximum WBGT was 33.9°C (93°F, SD = .459). The farmworkers spent between 2 to 7.5 hours of their day working in conditions above the TLVs®, which was 50% to 100% of their workday. On data collection Day 1, 2, or 3, the farmworkers had surpassed the TLVs® by 9:00 am (Days 1 and 2) or 10:00 am (Day 3) and continued to work above the TLVs® for the remainder of the day. They were permitted 15-minute breaks at 9:00 am and 3:00 pm and a 30 to 60-minute lunch break. Farmworkers on data collection day 4 processed cucumbers outside for 2 hours in the evening with no break.
Three correlations were found between the dependent and independent variables. The correlating independent variables were related to time and heat stress. There was a strong, positive correlation between the average hours worked per day and post-shift USG, r = .64, n = 25, p < .01; as the number of hours worked on a typical workday increased, the post-shift USG levels increased. Controlling for age had very little effect on the strength of the relationship. There was no correlation between the actual number of hours worked on data collection day and pre-shift USG, r = .15, n = 30, p = .44, or post-shift, r = .29, n = 25, p = .16. There were moderate, positive correlations between weeks worked this year, r = .45, n = 24, p < .05, and hours spent working above the TLVs®, r = .43, n = 25, p < .05, with post-shift USG.
Evaluating euhydrated and dehydrated groups further highlighted the importance of both time and heat stress to hydration status. Of those already dehydrated in the morning, average days worked per week, r = .61, n = 12, p < .05, average hours worked per day, r =.74, n = 12, p < .01, and hours worked on data collection day, r = .71, n = 12, p < .01, correlated with post-shift USG. Of those already dehydrated in the morning, all four environmental heat stress indices also correlated with post-shift USG. As the mean WBGT, r = .72, n = 12, p < .01, maximum WBGT, r = .66, n = 12, p < .05, number of TLVs® hours, r = .71, n = 12, p < .05, and percent of TLVs® hours on data collection day, r = .71, n = 12, p < .05, increased so did post-shift USG.
Finally, the pre-shift and post-shift means of categorical groups were compared. There was a significant difference in pre-shift USG for those that worked in the sweet potato crop (M = 1.023, SD = .003) and those that did not, M = 1.019, SD = .005; t (28) = −2.079, p = .047, two-tailed. No significant differences were found between those (a) who did and did not drink beer and other alcohol, (b) who did or did not drink sport beverages, (c) with high or low caffeine intake, (d) who wore or did not wear poly coveralls, or (e) with greater than or less than 3-minute walk to toilet.
Using content analysis, two themes were identified as Absence of Protection and Freedom to Drink. The first theme, Absence of Protection, was represented by two subthemes: (a) Intense Climate Considerations and (b) Workplace Exploitation. The second theme, Freedom to Drink, was represented by two subthemes: (a) Distance and Distaste and (b) the Culture of Farm Work. Farmworkers perceived extreme outdoor temperatures as the greatest barrier to fluid intake while working. Farmworkers described inconsistent occupational policy compliance and payment practices. They perceived a freedom to drink water whenever necessary, although water could be stored far away. They further reported self-care sacrifices and incomplete hydration education. Macro-level factors influenced farmworker hydration through the piece-rate payment system and the H-2A visa program, which included employer provision of temporary housing.
Integration of qualitative and quantitative data supported congruent findings of extreme heat, few work breaks, and poor housing (Table 3). Farmworkers reported infrequent breaks in the FGDs, coupled with the WBGT data suggests breaks were not permitted enough to stay within the recommended TLVs®. Qualitative and quantitative data support unofficial water breaks were allowed, meaning workers could stop, go drink water and return to work. Farmworkers described substandard housing conditions, paired with the long workdays and high prevalence of pre-shift dehydration could suggest rehydration before or after work may be inadequate.
Integration of Mixed Methods Data
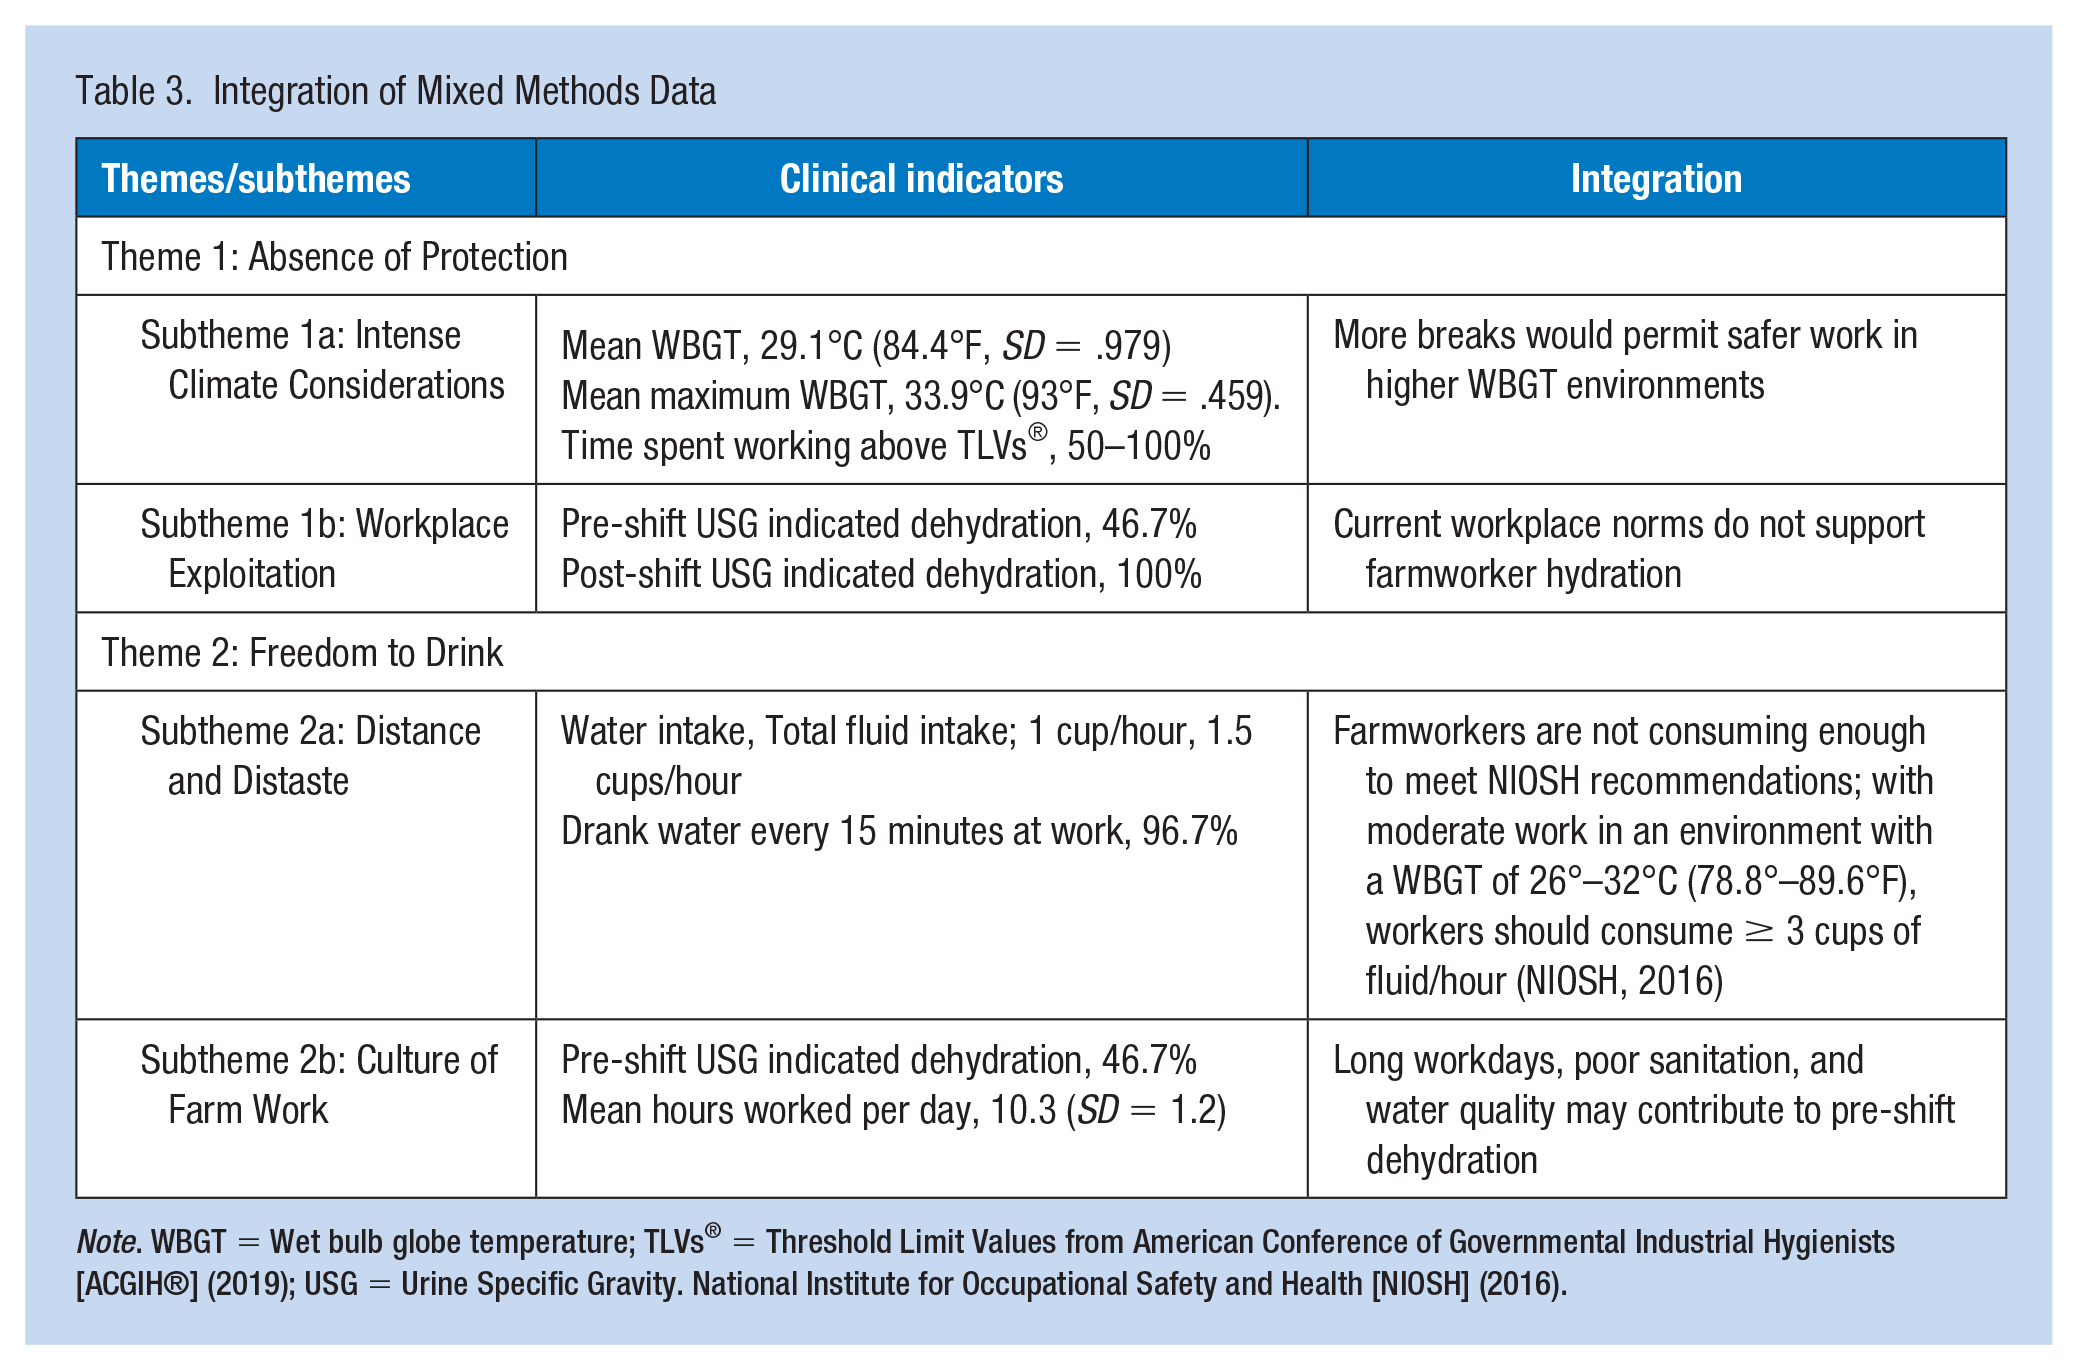
Note. WBGT = Wet bulb globe temperature; TLVs® = Threshold Limit Values from American Conference of Governmental Industrial Hygienists [ACGIH®] (2019); USG = Urine Specific Gravity. National Institute for Occupational Safety and Health [NIOSH] (2016).
Discussion
This was the first NC farmworker mixed methods study to collect farmworkers perceptions on fluid intake, as well as physiological markers of hydration and the microclimate WBGT experienced by farmworkers. Farmworkers’ hydration status deteriorated significantly over a worked shift. Almost half of the sample began the workday dehydrated and by the end of the day all farmworkers were considered dehydrated or severely dehydrated. By measuring the WBGT, we determined farmworkers spent most or all shift working above the recommended limits for workplace heat exposure.
The percentage of farmworkers with dehydration pre- and post-shift was similar to farmworkers in Florida (Mix et al., 2018) but higher than the farmworkers who participated in the California studies (Moyce et al., 2017; Vega-Arroyo et al., 2019). In other occupational groups who experienced equivalent environmental heat stress (~29°C, 84.2°F), comparable USG results were measured in construction workers in Egypt (El-Shafei et al., 2018) and in Japan (Ueno et al., 2018). Piil et al. (2018) found indoor and outdoor workers across Europe had similar pre-shift dehydration prevalence, yet agricultural workers were the only occupational group whose hydration status worsened over the shift. The authors hypothesized that this was due to agricultural workers’ limited access and availability of fluids compared with the other occupational groups. A subtheme in this study, Distance and Distaste, supported the finding of limited access and availability of water during the workday. Reportedly, sufficient water was available, yet inaccessible or had a bad taste.
For HRI prevention among workers, NIOSH has specific recommendations on the amount of water workers should consume during outdoor labor. For farmworkers performing at a moderate metabolic rate in a WBGT 26° to 32°C (78.8°–89.6°F) environment, workers should consume at least three 8-ounce cups of water every hour (NIOSH, 2016). From our demographic survey, all but one participant (96.8%) reported drinking water every 15 to 20 minutes, which met this standard; however, the survey did not specify the quantity at each interval. The results from the BIAQ suggested workers were not drinking enough to meet the standard. They reported 2.5 liters of water intake per day, or 10 cups. Even if this amount of water was strictly consumed during the work shift it would only meet the standard for a little over 3 hours. Their total fluid intake would only meet the standard for 5 hours, or half of their workday.
In other U.S. studies, the water and fluid consumption of farmworkers was insufficient, according to the NIOSH standard mentioned above. Male and female farmworkers in Georgia reported less water intake (2,189 mL) per workday than the farmworkers in our study (Smith et al., 2021). Although the length of the workday was not reported, the researchers suggested the farmworkers were drinking less than the standard. Male farmworkers in California reported more water intake (2,922 mL) than the NC farmworkers, while female farmworkers drank less (1,935 mL), meeting the standard for a third or half of their workday (Moyce et al., 2020).
Researchers who conducted studies with agricultural workers laboring in CKDu hotspots reported varied fluid intake and hydration status. Sugarcane harvesters in El Salvador, with hotter but shorter workdays than reported in our study, met the NIOSH standard by drinking over 3 L of water in 4 hours, and maintained their hydration status pre- and post-shift (García-Trabanino et al., 2015). The USG of sugarcane harvesters in Nicaragua indicated about 18% were severely dehydrated (≥1.030) the morning following a workday, despite water and fluid intake consumption similar to the harvesters in El Salvador (Wesseling et al., 2016). Participants in our study consumed about half as much water and fluids as the El Salvadoran and Nicaraguans, and 8% of our sample were severely dehydrated post-shift. These findings raise several concerns, like the comparable prevalence of dehydration among farmworkers in NC and Central America, and that the NIOSH hourly fluid intake recommendation may need to be reexamined for the farmworker population.
Time at work was suggestive of dehydration in this farmworker sample. The longer farmworkers worked on an average day and later in the season positively correlated with increased post-shift USG. This, coupled with the high percentage of workers already dehydrated pre-shift, suggested rehydration before and after work may be inadequate. Due to fatigue from long workdays and long work seasons, farmworkers might not have the time and/or energy to rehydrate. Rehydration likely occurs in farmworker housing. For migrant farmworkers with the H-2A program, and those who participated in this study, housing was employer-provided. Employers could explore options to improve rehydration at home, like provision of water filters.
Recurrent dehydration, even minor, may cause irreversible kidney damage and is hypothesized to be the cause of CKDu (Polo et al., 2020). Dehydration triggers inflammation and injury cascades; vasopressin and aldose reductase-fructokinase pathways are triggered resulting in tubular injury, which is thought to be compounded by rehydration with sugar-sweetened beverages (SSBs) (García-Arroyo et al., 2016). Frequent consumption of SSBs is associated with chronic illness such as kidney and heart disease and Type 2 diabetes (Malik & Hu, 2019). Our qualitative data suggested farmworkers preferred drinking SSBs over water, yet they understood the basic connection between water intake and kidney function.
A correlation between higher measures of environmental heat stress and higher USG was not an unexpected finding. However, the actual time of day that workers exceeded the TLVs® was a new finding. Three of the groups worked longer shifts, about 6:30 am to 3:30 pm, yet exceeded the TLVs® around 9:30 am. An administrative control for HRI prevention was to alter work schedules to avoid the heat of the afternoon (NIOSH, 2016). Our data suggested this recommendation may not be completely effective in reducing HRI risk for NC farmworkers.
We found that those who worked in sweet potato fields had significantly higher pre-shift USG. Sweet potatoes in NC are usually harvested during autumn, so the participants during data collection were likely cultivating the crop, instead of more physically demanding task of harvesting. In the past, the farmworkers reported receiving piece-rate pay while harvesting the crop which encouraged them to take fewer breaks to earn more money. Farmworkers also reported drinking less water because the constant bending over to harvest created stomach pain if the worker had a full stomach of water. Since the workers were not receiving piece-rate pay at the time of urine specimen collection, we could not conclude that this was related to pre-shift dehydration. Future studies could illuminate whether higher intensity work occurring during cooler temperature days would produce similar effects on hydration status.
The study strengths include a multidisciplinary team and community-informed mixed methods design. It was the first farmworker study set in NC with a focus on fluid intake and measurements of hydration status and microclimate WBGT. The study design was limited by convenience sampling and small sample size. There was potential for sampling bias, as participation agreement was sought through employer permission, a commonly reported study limitation by authors of farmworker studies (Culp & Tonelli, 2019; Mac et al., 2017; Moyce et al., 2017). Other limiting factors included the challenges of conducting research during the COVID-19 pandemic, such as shortening the sampling time frame to access participants to include only male, foreign-born farmworkers in the H-2A visa program.
Implications for Occupational Health Nursing Practice
Specific to hydration status and kidney function, further studies are needed in NC among larger farmworker samples, including collection of more biomarkers such as blood osmolality. The Alliance of Nurses for Healthy Environments could partner with farmworker organizations, FQHC staff, and university faculty to educate farmers and farmworkers on the adverse effects of dehydration and environmental heat stress on kidney health. Using visually appealing infographics, education could emphasize the need to drink water every 15 minutes during a work shift and to specifically consume 8 oz. at each interval. Targeted information on long-term protective kidney behaviors, like avoiding sugar-sweetened beverages, should be included. Nurses and healthcare providers might encourage farmworkers to receive regular health screenings, including tests of kidney function. Local FQHCs could coordinate screenings at farmworker workplaces or camps, as NC farmworkers report transportation as one of the three greatest barriers to health care (Lambar & Thomas, 2019). Local FQHC staff could work with employers to provide more rest and water breaks, to keep high-quality water accessible at all times, and to utilize the HRI prevention phone app OSHA-NIOSH Heat Tool. Employers need to be aware that environmental heat stress limits can be met in the morning hours and how employer-provided housing can impact hydration. Cooling and hydration practices, like the use of backpack-mounted water bladders, could permit safer work in higher WBGT environments.
Conclusion
Farmworkers are dehydrated at work, placing them at higher risk for HRIs. Our study contributed to the knowledge of how social, political, and occupational factors influence NC farmworker fluid intake and hydration status. As farmworkers continue to be a vulnerable population, an approach on an individual and system level is needed to protect farmworkers as HRI rates are rising due to climate change. Focusing on cooling and hydration practices would enhance safer work environments and physiological renal protection.
Footnotes
Acknowledgements
The authors want to thank the study participants and the FQHC staff. We appreciate the contributions of Brayan Madero and Vanessa Viridiana Hernandez, and Charleen McNeill, PhD and Brianna Foster, BSN.
Conflict of Interest
The author(s) declared no potential conflicts of interest with respect to the research, authorship, and/or publication of this article.
Funding
The author(s) disclosed receipt of the following financial support for the research, authorship, and/or publication of this article: Beta Nu Chapter of Sigma Theta Tau International Honor Society, the ECU CON Doctoral Student Research Grant and the ECU CON Office of Research and Scholarship.
Ethical Approval
The study was approved by University & Medical Center Institutional Review Board, UMCIRB 20-001259, on June 26, 2020.