
Abstract
The Olympic Games is one of the most widely followed and visible sporting events in the world. Governments allocate resources to Sports Federations in pursuit of competitive outcomes that depend on a combination of uncertain factors. This study applies the Färe-Primont index (FPI) for the first time in the field of sport to estimate productivity and efficiency and analyse the results of Spanish Sports Federations’ participation in the last four editions of the Olympic Games (2008–2021). It also seeks to identify the existence of behavioural patterns in Spanish Sports Federations that make the best use of the available resources. The results of the study suggest that the structure of funding sources, the size of the governing bodies and the length of time that the SSFs compete for (age) are factors that influence their efficiency and productivity.
Plain Language Summary
The Olympic Games are one of the most popular and watched sports events in the world. Governments spend money on sports organizations to help them do well, but success can be hard to predict. This study is the first to use a special tool called the Färe-Primont index (FPI) to measure how well Spanish Sports Federations (SSFs) have done in the last four Olympic Games (from 2008 to 2021). The study also looks for patterns in how these organizations use their resources. The results show that how these organizations are funded, the size of their leadership teams, and how long they have been competing all affect how efficient and productive they are.
Introduction
The Olympic Games (OG) serve as a showcase in which each country seeks to display the vigour and modernity of its social management through sport. In this scenario, and regardless of the positive externalities that sporting successes provide to the country’s image, such as the stimulation of grassroots sports and the promotion of healthier lifestyles, it is necessary to oversee the use of public funds allocated to the Sport Federations (SFs) and to evaluate the value for money of these resources and, if necessary, to establish fairer and more efficient distribution criteria for the future. In this respect, recent studies have identified Spain as one of the least efficient countries in terms of the use of public funding policies for sports (Kučera et al., 2023).
However, evaluating the productive efficiency of SFs is a particularly complex task, due to both the different characteristics of the various federations and because of the very nature of sport, which does not respond to a standard productive function that links the resources consumed to the results achieved, but which also depends on a series of uncertain factors, including the natural talent of the athletes themselves, the performance of other competitors and even a degree of luck at certain moments in time.
To contextualize the present study it is necessary to differentiate between the Anglo-Saxon environment (entrepreneurial system), where the role of governments is limited to establishing a framework that allows market logic to operate, and the continental European environment (bureaucratic system), which is more interventionist due to the very active role played by governments in regulating the system (Girginov, 2017; Scelles, 2017). In this respect, SFs in continental Europe are run as public services delegated by the state and are therefore controlled by the government through the Ministry of Sport; whereas in Anglo-Saxon environments SFs are independent from the government (François et al., 2019).
In Spain, Spanish Sport Federations (SSFs) are assigned public functions of an administrative nature, acting as collaborating agents of the Government (LD10, 1990). Among these functions, the organization and development of elite sports stand out (RD1835, 1991). In recent years, the finances of SSFs have been under strain and by 2012 more than 90% of SSFs were in a situation of technical bankruptcy, having negative working capital and net worth. In response to this, the Consejo Superior de Deportes (CSD) implemented Viability Plans for federations showing negative figures in either of these magnitudes, including penalties in the annual subsidy if the Viability Plan commitments were not met. As a result, the federations went from losses of 4.8 euros in 2012 to a surplus of 6.7 million euros in 2016 (Guevara-Pérez et al., 2021).
The measures exercised by Spanish government agents contributed to improving the financial situation of the federations, replacing the classic public management model prevailing in Spanish federated sport with the New Public Management approach. This included a large amount of private sector strategies that have led to a gradual professionalization, replacing part of the volunteers with paid staff, increased disclosure of sensitive information for stakeholders in terms of transparency and, with respect to accountability, the replacement of budgetary accounting with accrual accounting (Seguí-Urbaneja et al., 2022). SFs have thus moved from having a purely administrative function to being accountable for their decisions through a performance-based management approach, as has been observed in other contexts (O’Boyle & Hassan, 2014).
SSFs do at the same time receive grants from the CSD, specific grants from the Olympic Sports Association (ADO) and revenues from private sources (licenses and sponsors). The paradigm shift introduced in the management of Spanish federated sports did therefore reduce the dependence on public funds and stimulated the capacity of federations to generate their own revenues (Guevara-Pérez et al., 2021).
This paper aims to study the performance of the SSFs during the last four editions of the Olympic Games (2008–2021) by measuring the productivity and relative efficiency achieved in the use of available resources. In this regard, it is important to consider that the period under study was shaped by the global economic crisis and its impact on Spain during the Beijing 2008 and London 2012 OG, and the crisis generated by the COVID-19 pandemic which affected the Tokyo 2020 OG due to the already well-known negative repercussions of government disinvestment in the sector as a consequence of the austerity measures adopted in periods of crisis (Giannoulakis et al., 2017). A second objective of the paper is to observe whether this performance persists as a behavioural pattern and, finally, to identify the determinants of federations’ efficiency and productivity The study will in particular explore whether the introduction of a performance-based management approach, aimed at reducing the federations’ dependence on public funding and encouraging greater financial management rationality, also contributes to improving sporting efficiency.
In summary, the following three research questions (RQs) will be addressed:
For estimating the recorded productivity and efficiency. The study used the Data Envelopment Analysis (DEA) technique and the Färe-Primont index (FPI) based on the advances developed by O’Donnell (2008, 2010, 2011a, 2012, 2014, 2018). To the best of our knowledge, this is the first paper to use FPI in the field of sport.
The study does therefore subscribe to resource dependence theory (RDT), as it provides an adequate theoretical platform for understanding the behaviour of sports organizations operating in environments with unstable funding sources, based on the premise that the survival of organizations depends primarily on their ability to obtain and maintain resources and manage associated dependencies (Pfeffer and Salancik, 1978).
The paper is divided into the following sections: after the Introduction, section two discusses the theoretical framework and reviews the literature related to efficiency and sport. Section three outlines the methodology employed. Section four presents an analysis of the study’s results, which are then discussed and interpreted in section five. Finally, section six offers the conclusions and outlines potential future developments.
Theoretical Framework and Literature Review
Organizational Performance in Sports
Organizational performance as a field of research is based on various theories (e.g. institutional theory, resource dependence, agency theory, contingency theory, stakeholder theory). These theories are used independently or in combination, which sometimes leads to paradoxical contradictions. This fact stems from the fact that the way performance is perceived is influenced by both objective and subjective aspects, such as emotions, moral values, preferences, personal characteristics and the life cycle of an organization. One empirical challenge posed is that strategic priorities change over time. Assessing NPO performance in relation to its objectives is therefore highly context-dependent (Bayle & Clausen, 2024).
Resource Dependency Theory in Sport
In a sports context, resource scarcity has been widely documented in NPOs (Walker & Hayton, 2017), with respect to both clubs (Wicker & Breuer, 2011) and national SFs (Giannoulakis et al., 2017). This characteristic is often associated with the “non-profit” nature of these types of bodies (Nowy et al., 2015), and secondly, because the financial dimension is not a priority and is subordinated to the sporting interests of the organization, whose financial survival depends on its self-financing capacity and dependence on public authorities (Winand et al., 2010).
In this regard, coercive pressure from governments through the funding of NPSOs has been significant in countries such as Canada (Edwards et al., 2009; Slack & Hinings, 1994), the United Kingdom (Nichols et al., 2005), Australia and New Zealand (Shilbury & Ferkins, 2011), Spain (Romero & Shibli, 2011), Germany (Cachay et al., 2001), and, more recently, Turkey (Erturan-Ogut & Sahin, 2014) and Greece (Giannoulakis et al., 2017). It has in contrast been low in a few countries, such as Norway (Skille, 2009) and Belgium (Vos et al., 2011).
This scenario supports a growing literature linking elite sport performance to public funding and government involvement (De Bosscher et al., 2006, 2008, 2011; Sam, 2012), as well as the negative impact of government disinvestment in the sector as a result of austerity measures during periods of crisis (Giannoulakis et al., 2017).
An additional complexity is that SFs not only rely on financial resources for programme delivery, but also on volunteers, who represent an important resource in NPSOs (Taylor et al., 2009), and these volunteers do not necessarily have the same skill level as paid employees with specific qualifications (Heinemann, 2004).
The influence of the environment will therefore depend on each specific national sport system. For all these studies, RDT has provided a suitable theoretical platform for understanding the behaviour of sports organizations operating in environments with unstable funding sources. Based on RDT’s main tenet, the survival of organizations depends primarily on their ability to secure and maintain resources and manage associated dependencies (Pfeffer & Salancik, 1978).
Measuring Performance in Olympic Sport
The 2008 crisis reactivated, both in academic and professional circles, the interest in accountability and how to evaluate the value for money offered by the activity carried out by all types of organizations. In this respect, traditional magnitudes in for-profit organizations, such as profit or economic profitability, operate as a good indicative measure of the efficiency of the organization, whereas for non-profit sports organizations (NPSOs) financial resources only represent an input to their operations (De Bosscher et al., 2006; Madella et al., 2005). This is why the use of non-financial indicators becomes more important in evaluating performance in non-profit organizations. In the field of sports, an added difficulty in performance evaluation is that the production function is uncertain.
In this context, performance studies applied to the field of sport make up an extensive literature that included works such as those by Bayle and Madella (2002); O’Boyle & Hassan (2014) and Winand et al. (2010). In this area, studies such as the SPLISS project (Sports Policy Factors Leading to International Sporting Success), which has provided valuable contributions to assessing the effectiveness of elite sports policies (De Bosscher et al., 2006), also focus on this subject.
Additionally, there is a large body of literature that has used quantitative methodologies that include parametric and non-parametric approaches for the measurement of efficiency in NPSOs and federated sports. These methodologies include the Free Disposal Hull used by (Benicio et al., 2013) or the stochastic production frontier model used more recently by (Gómez-Déniz et al., 2021). However, DEA has undoubtedly been the most widely used technique. This methodology has been used for more than 40 years (Emrouznejad et al., 2008) and has a presence in studies focused on the field of sport (Bhat et al., 2019).
Most of the studies employing DEA focus on professional sports (Chatzistamoulou et al., 2021; E. Gutiérrez & Lozano, 2012; Ó. Gutiérrez & Ruiz, 2013; Ruiz et al., 2011) and especially football (Buzzacchi et al., 2021; González-Gómez & Picazo-Tadeo, 2009; Zambom-Ferraresi et al., 2015). To a lesser extent, some studies analyse the performance of NPSOs, mainly contrasting the performances of nations in multisport events (Debnath & Malhotra, 2015; Lozano et al., 2002; Zhang et al., 2009). Studies that analyse the performance of a country’s SFs are especially scarce, despite their interest in public and private sponsors that allocate resources to federated sports (Meza et al., 2015; Murat et al., 2023; Torres et al., 2018).
There is in addition a gap in studies that analyse the evolution of sports organizations’ performances in a sustained manner over a long time horizon, with multiple editions of the same sports event.
Determinants of Efficiency and Productivity in SSFs: Hypothesis Formulation
To analyse the determinants of SSFs’ efficiency and productivity, we have adopted a multidimensional approach that integrates both financial and non-financial indicators which, according to the literature, may influence the achievement of organizational objectives (Madella et al., 2005). We have actually developed five pillars that underpin hypotheses relating to financial, governance, age, demographic and technological aspects, and which may have an impact on the performance of SSFs (see Figure 1).
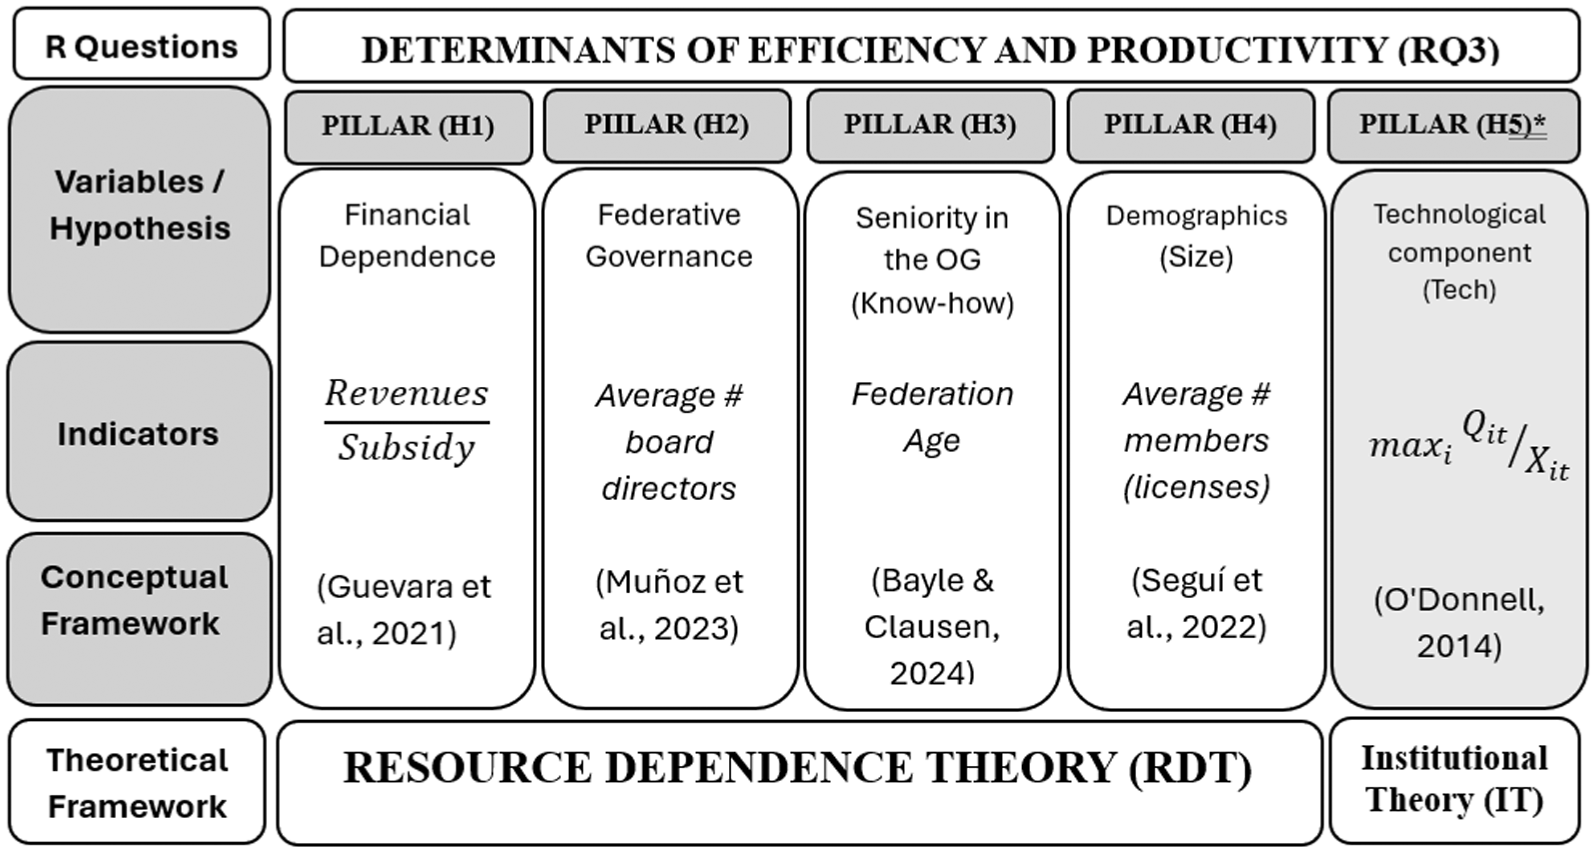
SSFs’ performance determinants: Instrumental design, theoretical and conceptual framework.
From an RDT perspective, federations that are less dependent on public funds have larger governing bodies, more members, and are older than would be expected to achieve higher efficiency. This may occur through the diversification of their funding sources (Terrien et al., 2023), which expands their capacity to attract critical resources (Prakash et al., 2021). It also allows them to leverage economies of scale (Guevara-Pérez et al., 2021), become more autonomous over time, and capitalize on the knowledge embedded in their institutional memory (Bayle & Clausen, 2024).
Financial Dependence
Government systems have a direct impact on the financing model of federated sports. In this respect, governments in the Anglo-Saxon context set a framework for the market logic to be expressed, whereby sports federations adopt a business behaviour, and classical financial ratios are often the most common performance measures (Omondi-Ochieng, 2019, 2020).
On the other hand, in continental Europe governments regulate the system by allocating public funds to SFs, which act as public services delegated by the state and thus adopt the same structures and bureaucratic behaviour (François et al., 2019). This is the most widespread system globally.
This is why public funds represent the means through which governments exercise their control over federated sports, and the reason why many studies subscribe to the institutional theory, which analyses these behaviours as cohesive isomorphisms (O’Brien & Slack, 2004), to the resource dependency theory (Erturan-Ogut & Sahin, 2014; Giannoulakis et al., 2017; Omondi-Ochieng, 2019, 2020), or to both from a multi-theoretical perspective (Guevara-Pérez et al., 2021).
Paradoxically, it has been the pressure exerted by governmental bodies when allocating financial subsidies to the federated sport that has generated an evolution in the sector from the classic model of budgetary management to the New Public Management approach, and with it, a process of professionalization that seeks to reduce dependencies on the state and improve the financial situation of the sector (Nagel et al., 2015).
Sports governing bodies in many countries have been promoting control mechanisms based on adequate accountability, such as Sport Canada’s Sports Funding and Accountability Framework (SFAF, Canada, 1994), the Financial Times Stock Exchange-BOA in the United Kingdom (Morrow & Robinson, 2013) and the programmes run by the General Secretariat of Sport (GSS) in Greece (National Sports Policy, 2011).
In Spain, the difficult economic-financial situation of sports federations forced the CSD to implement Viability Plans in 2013, non-compliance with which would result in a penalty on the subsidies allocated during the plan’s years of operation. This action brought about a reorganization of the sector’s finances (Guevara-Pérez et al., 2021).
This financial dependence on public funds, defined as the ratio of public resources to total revenues, has been a common variable when analysing federated sports in the European context (Terrien et al., 2023; Winand et al., 2012).
Recent studies suggest that a diversification of funding sources that decreases the dependence on public funds improves the financial sustainability of Spanish federated sport, something which could help to improve sporting results since attracting private funding tends to be more demanding in terms of performance (Seguí-Urbaneja et al., 2022). However, in Spain there are no studies that show a relationship between efficiency and the type of federation funding, offering further evidence of a reduced return on investment (ROI) after Barcelona 92 (Torres et al., 2018). The ability of federations to generate their income could be a determinant of efficiency. Our first hypothesis does therefore, state the following:
Federative Governance
The role of governing bodies in the management of SFs is one of the crucial dimensions in achieving their strategic objectives (Muñoz et al., 2023; Winand et al., 2010). However, a systematic review of the literature shows that the role of organizational governance in sports performance is a controversial issue (Parent & Hoye, 2018). In addition, the optimal size of a board at SFs remains an area of debate in both research and practice (Ingram & O’Boyle, 2018).
In this regard, a recent study of national sports federations in the USA (Prakash et al., 2021) advocates larger boards based on the resource dependency theory, according to which a large number of board members would be better able to connect the organization with the external environment in order to secure critical resources and also provide the knowledge and skills needed (Goodstein et al., 1994).
On the other hand, and based on the postulates of management theory (Turnbull, 1997), some authors suggest that board size hinders management efficiency in sports (Dimitropoulos, 2011; McLeod et al., 2021; Yeh & Taylor, 2008). Furthermore, a study on Swedish sports federations points out that contemporary sport governance contexts are marked by a trend toward the efficiency-based board, suggesting a reduction in board size (Stenling et al., 2022).
Our second hypothesis is therefore as follows:
Seniority in the OG
The benefits of the know-how that an organization acquires during its maturity process in a sector are unquestionable (Carter, 1989). From this point of view, one would expect that seniority would be an advantage in sport for federations participating in a competitive environment (Sass, 2012), but it could also be the case that those more recent arrivals have less of a structural burden and take advantage of the momentum offered by new generations of athletes.
Based on this last approach, our third hypothesis is as follows:
Demographic Conditions
The sustainability of a sport is largely determined by its popularity. This fact allows for greater media coverage, with the consequent economic advantages in terms of visibility and marketing, an increasing number of own resources due to the fact that “the greater the number of licences, the greater the income,” thereby favouring the exploitation of economies of scale (Seguí-Urbaneja et al., 2022). Socially, it does in turn allow for a response to “sport for all” in terms of sports promotion to nurture the pool of young athletes that constitutes the raw material of elite sport (Seguí-Urbaneja et al., 2020). Maintaining the infrastructure of mass sports does on the other hand require the allocation of a large number of resources to meet the demands of athletes who practice the discipline for purely leisure purposes, compared to smaller federations where it may be easier to devote all efforts to the training of elite athletes. Our fourth hypothesis therefore states the following:
In sports it is in addition common for the leader to transmit externalities towards the rest, something which has been widely confirmed in the literature as the trickle-down effect, explaining why the success of elite sports serves as an inspiration to young athletes (De Bosscher et al., 2013; Seguí-Urbaneja et al., 2020). In this respect, successful new management practices adopted by one federation are expected to be transmitted to the rest. This is what institutional theory defines as institutional isomorphism, arguing that organizations operating in an environment with similar requirements and funding expectations are expected to adopt similar management measures and governance frameworks (DiMaggio and Powell, 1983). This allows us to pose our fifth and final hypothesis:
In adhering to resource dependence theory, the contribution of this paper is in summary threefold: (1) it assesses SSF performance by using the Färe-Primont index, which satisfies all the desirable axioms of a productivity index to a greater extent than more common indices. (2) It identifies consistent patterns of behaviour from the accumulation of data over 20 years (four complete Olympic cycles), and finally, (3) it incorporates financial and non-financial determinants that explain efficiency and productivity.
Methodology
There are several techniques for estimating total factor productivity (TFP) and efficiency. However, the frontier approach, either DEA or stochastic frontier analysis (SFA), has several advantages over other TFP measures such as index numbers of price-based estimates, like the Tornquinst or Fisher index, or growth accounting methods (Coelli et al., 2005). Between DEA and SFA, one of the main advantages of the former is that it does not require the establishment of a specific functional form, nor a particular distribution for the inefficiency term, something which gives it greater flexibility than SFA techniques. In SFA, if the functional form or distributional forms are incorrectly assumed, the performance of SFA declines (Ruggiero, 2007). In addition, even with high collinearity between inputs, it has no impact on DEA estimations (Andor & Hesse 2011).
Furthermore, nonparametric methods, such as DEA, perform better with heterogeneous production functions. As Van Biesebroeck (2007, p. 560) pointed out: “… it is the preferred estimator for productivity levels if technology is likely to vary across firms, and scale economies are not constant. Examples would include situations where one has to pool firms from very different industries, at different stages in their lifecycle or operating in countries with different levels of development.” This is especially important in our analysis of sports federations, where the functional form is unknown.
The advantages of the frontier approach and DEA can be summarized as follows: (a) it does not need to establish a specific functional form, (b) no assumption is required about the distribution of the inefficiency component (as in parametric frontier techniques), (c) it is not necessary to assume that all economic units are efficient, (d) no information about prices is required, (e) the economic units do not need to follow a profit-maximization or cost-minimization behaviour and (f) it permits the decomposition of TFP into technical change and technical efficiency, among other measures.
In addition, to calculate the TFP index as the basis of the decomposition into the technological index and efficiency index, FPI has some important advantages over other similar indexes, since it allows for multi-lateral and multi-temporal (instead of only binary) comparisons. Moreover, this index is what the literature calls “primal indexes,” which are indexes that are constructed using output and input distance functions. In other words, FPI is an additive, multiplicative and primal index. Thus, the FPI is considered an exhaustive and ideal index in that it satisfies all the relevant axioms and proof in the index numbers theory (O’Donnell, 2011a, 2011b).
Through the FPI, the study provides criteria for the allocation of public funds to high-level sports, discriminating between sports regardless of their levels of Olympic participation or professionalization, or their individual and collective status. In addition, the Färe-Primont index allows for multilateral (between different federations) and multi-temporal (between different periods) comparisons.
TFP and Efficiency Estimations
In order to calculate the TFP and its components, we used the aforementioned advances proposed by O’Donnell. Thus, TFP is defined as the relationship between outputs and inputs, which can be represented as:

where
We adopted output-oriented measures to estimate the production function, and where it is constructed from the maximum output given certain fixed factors. The distance function that represents the technology available in period t can be written as:

where
The specific calculations applied to the case of FPI, are represented by Equation 3:

The linear optimization of Equation 4 yields the parameters
The aggregate functions used to compute the FPI are:


The FPI can be decomposed into two components. One is the technological component (Tech) and the other is the efficiency component (EFF), as follows:


The technological component (Tech) measures a shift in the production frontier during a period and is expressed by Equation 7. It is calculated by identifying the economic unit i, which achieves the maximum level of TFP for a given period t.
The efficiency change component (EFF) is a measure of overall productive performance. It measures a movement of the economic unit towards (or away from) the production frontier, which means an improvement (or worsening) in the efficient use of production factors.
It is possible to decompose the TFP into other measures of efficiency, including the scale efficiency. However, due to the interest of this paper and for reasons of space, we will only observe the decomposition into TC and EFF. For other different decompositions, see (O’Donnell, 2014).
To estimate TFP, Tech and EFF, we defined one output and three inputs. Regarding the output variable, we used the synthetic indicator created by Torres et al. (2018), which has several benefits. Firstly, it not only takes into account the number of medals but also the diplomas obtained up to eighth place. Secondly, it considers the number of events offered in each discipline (Meza et al., 2015) and the results achieved by each federation. It can be expressed as follow:

where IO is the indicator of the output, n is the position obtained in the competition and m is the total number of competitions offered in which each federation participates. The score for n is assigned as follows: 1st place-1 point, 2nd place-1/2 point … 8th place-1/8 point. A minimum of 1/9 point is assigned for all federations, and considered as a bonus to qualify for the OG (Torres et al., 2018).
The selection of the inputs is critical since they should reflect the “essence” of the productive process. To reach this goal, we have only chosen “stock” variables as productive factors. That is, we have left some of the “flow” variables, such as financial resources, out of the production function, these being commonly included in other works (de Carlos et al., 2017; Gómez-Déniz et al., 2021; Torres et al., 2018).
Non-financial measures capture the human talent involved in producing Olympic results. Therefore, our first input is the number of athletes from each federation participating in the OG (Benicio et al., 2013; Debnath & Malhotra, 2015; Torres et al., 2018). It can be considered to be a proxy of the investment made by each federation in the Olympic programme. It does in addition play the role of transmitting the composite impact of a country’s size and economy to the end phase of Olympic success (Vagenas & Vlachokyriakou, 2012). In the Spanish Olympic team, there is a highly significant correlation between the size of the delegation in each sport and the funds for that sport, as can be seen in Table 1.
Correlation Between Delegation Size and Funding Sources.

Source. Compiled by the author.
The second and third inputs essentially represent the human capital factor. They are the number of high-level athletes (Gómez-Déniz et al., 2021) and the number of high-level coaches from each federation (de Carlos et al., 2017). Both variables are proxies of the potential possibilities that each federation has to qualify or obtain medals in each edition of the Olympic Games with the human talent involved (Murat et al., 2023).
For this study, we have selected the 21 federations that have participated in the last four editions (2008, 2012, 2016 and 2021) of the Olympic Games, and which are listed in Appendix 1. For the three input variables, we have averaged the values of the four periods comprising each Olympic cycle, that is, 2005 to 2008, 2009 to 2012, 2013 to 2016 and 2017 to 2020. Even though the Olympic Games were postponed to 2021 we have only considered data until 2020, which covers the original Olympic cycle. The data have been obtained from the sports statistics database DEPORTEData available on the CSD website (CSD, 2025a), as well as from the data contained in “other statistics” (CSD, 2025b), for the reference years 2005 to 2020.
Performance Persistence
The study of persistence in efficiency or performance involves comparing the level of efficiency achieved by a sample of units under study over consecutive periods. This makes it possible to assess assess the consistency of the results obtained and to develop expectations about what is likely to occur in the future.
There are different methodologies to examine the existence of persistence in performance: regression analysis (parametric methodology), efficiency rankings and contingency tables (a non-parametric technique that uses various test statistics). Contingency tables were chosen to remain consistent with the non-parametric nature of DEA analysis in data treatment.
The contingency table technique is based on comparing efficiency rankings from two consecutive periods, distinguishing a subset of “winner” and “loser” entities in each period. An entity is characterized as a “winner” or “loser” based on the median. The more efficient half of each ranking consists of the winning entities, while the less efficient half consists of the losing entities.
Next, a contingency table is constructed. It is a 2 × 2 matrix that includes the following categories: GG (winners in both periods), GP (winners in the first period and losers in the second), PG (losers in the first period and winners in the second), and PP (losers in both periods). To determine the robustness of the possible persistence phenomenon in performance, Malkiel’s Z Statistic (1995) will be used:

where:
Z represents the statistic, which follows a normal distribution (0.1).
Y denotes the number of winning entities in two consecutive periods.
n is GG + GP
Malkiel assigns p a value of .5, assuming a neutral assumption of persistence in performance.
For an overview of achieving efficiency, productivity and performance persistence, Figure 2 outlines the variables and indicators used within the RDT framework.

SSF performance and persistence: Instrumental design, theoretical and conceptual framework.
Key Determinants of the TFP and EFF
This section examines the effects of some key determinants of the federation’s TFP and EFF. We are mainly interested in analysing the influence of two main different areas; finance and structure. The first area includes financial issues. The second area captures some of the most important structural characteristics of the federations, such as corporate governance, age and size as a proxy of demographic conditions. In addition, we include the technology frontier (Tech) as an additional determinant of the TFP, which allows us to capture some kind of spillover effect.
Model, Variables and Data
The two models to be estimated, and which comprise all the determinants considered, can be represented as follows:
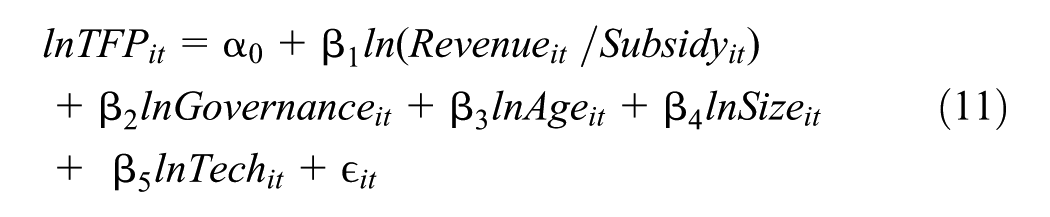

where ln indicates that the variable is measured in logarithms, so that the coefficients are elasticities. The error term can be represented as εit = αi+μit, one capturing the individual effects of each cross-section unit (α i ) and the other being the random effect (μ it ), which captures the phenomena not explained by the model and that vary by country and periods. Finally, the subscripts i and t denote each cross-sectional unit and the periods respectively.
The variables TFP, EFF and Tech are those calculated in the previous section. Revenue and Subsidy are the Federations’ own private revenues and government subsidies, respectively. These were calculated by adding up the amount received for each federation during each four-year Olympic cycle. With respect to these financial variables, and to test our first hypothesis (H1), we considered that the Revenue divided by Subsidy ratio would capture the effect of financial structure on TFP and EFF, since it takes into account the financial proportion between own and government revenues. Besides these two sources of income, there is a third source which comes from the Olympic Sports Association. However, we do not include this source in our analyses because it produces a problem of perfect collinearity. Nonetheless, this last source of financing is, proportionally, the least representative. This financial variable tries to capture the capacity of the federations to generate their revenues by decreasing their financial dependence on public funds (Guevara-Pérez et al., 2021).
To test our second hypothesis (H2), Governance is a proxy variable that tries to measure the effect of corporate governance structure (Dimitropoulos, 2011). It is measured by the average number of members on the Board of Directors (Muñoz et al., 2023) in each Olympic cycle. We also included two other structural variables, Age and Size, to test our third (H3) and fourth (H4) hypotheses, which are proxies that measure experience in managing and the dimension of each federation, respectively. Age is the age of each federation at the time of each OG and Size is the average number of licenses (number of federated athletes) in each Olympic cycle. This demographic variable aims to capture possible links between grassroots sport and the productivity and efficiency of high-level sport.
We did in addition, include the Tech variable in model (11) to test our fifth hypothesis (H5) and capture the impact of some externalities produced by improvements in the leader’s technology on the TFP of other federations.
Results
Färe-Primont TFP and Efficiency Estimations
TFP, Tech, EFF and IO results are presented in Appendix 1 and discussed in this section. In terms of productivity, the frontier determined by the technological component (Tech) reached the highest level recorded (0.4921) in the 2008 Beijing Olympics, falling to 0.3932 for the 2012 London Olympics, rising to 0.4878 in the 2016 Rio Olympics and finally reaching its lowest level (0.2017) in Tokyo 2021, where the competitive results are more modest than in previous editions. When looking at efficiency (EFF), the Tennis Federation was the most efficient at the Beijing 2008, London 2012 and Tokyo 2021 Olympic Games, while Triathlon stands out at Rio 2016. Table 2 presents the ranking based on the federations that indicate this efficiency frontier for each period.
Efficiency Ranking of Federations in Olympic Games Using the Färe-Primont Index.

Source. Compiled by authors.
Note. DMUs = “decision-making units” (SSFs).
As can be seen, the sensitivity of the model makes it possible to capture the heterogeneity of SSFs, differentiating between a single efficient federation for each period. When analysing the top five places in the ranking, we can in addition see that the model gives the same possibilities to individual sports (taekwondo, badminton) and collective sports (handball), highly professionalized sports (tennis) or amateur sports (weightlifting, Olympic shooting), and sports that have many competitions (canoeing, sailing) and those that do not (triathlon, handball, badminton). The result does in addition allow for a dynamic analysis in which the evolution of each federation can be observed.
The volatility of sporting results over time as a consequence of the uncertainty associated with performance referred to in the introduction explains a large part of the variations in the ranking. Thus, the study confirms that highly efficient sports such as canoeing (Guevara-Pérez, Martín Vallespín, et al., 2022), which has brought Spain the highest number of medals in the last three editions of the Olympic Games (Guevara-Pérez, Rojo-Ramos, et al., 2022), are not among the most efficient when it comes to optimizing the available resources. The ranking does therefore, provide criteria for the allocation of public funds to SSFs. However, it still remains to determine possible factors that influence the efficiency and productivity of SSFs.
Performance Persistence Results
To observe whether there is a pattern of behaviour in terms of federations’ efficiency, a persistence test was carried out for the Olympic cycles analysed. The results are presented in Table 3.
Persistence in the Efficiency of Spanish Federations.

Statistical significance for a 5% level.
Persistence is only observed between the 2008 and 2012 efficiencies, while the rest of the periods do not show any statistical significance.
This fact could confirm that no pattern can provide a profile of efficient federations, whose structure and management model could serve as a reference for the rest.
Estimations Models (11) and (12)
The most frequently used panel data models are fixed effects (FE) and random effects (RE) and those are our starting points. So our first step is to carry out the Hausman test and the Sargan-Hansen test to choose between FE and RE. Based on both results, reported in Table 4, we can confirm that RE is appropriate for our estimations for both models (11) and (12). We did in addition run the Lagrange multiplier (LM) test for random effects proposed by (Breusch & Pagan, 1980) to choose between RE and pooled regression, and once again our results indicated that the RE model is preferable.
FE Versus RE, Heteroskedasticity and Cross-Section Dependence Tests.

Critical values from Frees’Q distribution: α0.10: .5822; α0.05: .8391; α0.01: 1.4211.
The second step was to check some typical problems such as heteroskedasticity and cross-sectional dependence. To test groupwise heteroscedasticity we ran the Lagrange Multiplier LM test. To test cross-section independence, we did in addition conduct three complementary tests: one parametric test proposed by Pesaran (2015), and two semi-parametric tests proposed by Friedman (1937) and Frees (1995, 2004). In general, the results reported in Table 4 are indicative of the presence of heteroskedasticity but not cross-sectional dependence, except for the result obtained for Equation 7 by Pesaran’s tests. The above is applicable when these tests provide contradicting results. For instance, if Pesaran’s tests fail to reject the null hypothesis but Frees’ test does not, inferences should be based on Frees’s test (De Hoyos & Sarafidis, 2006).
Key Determinants of the TFP and EFF Estimations
We have already established that RE generalized least square (GLS) regression is the appropriate technique for our estimations. However, the heteroskedasticity problem remains. This problem can be caused since the dynamics of team sports and individual sports are different. Team sports require different methods of training from individual sports, and their performance depends on a group of people rather than on one person. Hence, it is likely that the performance within each class of sports might not be independent, that is, the residuals are not independent within each group. It is therefore difficult to maintain the assumption of independence. In other words, we can state that the observations may be correlated within team sports and individual sports, but they would be independent between team and individual sports. This is why, we propose an estimate of our models with cluster-robust standard error identifying two groups; federations where team sports are dominant (Basketball, Handball, Hockey and Volleyball) and federations where individual sports are common.
Other alternatives to RE GLS, are: Park’s feasible generalized least squares (FGLS) and the panel corrected standard errors technique (PCSE) proposed by Beck and Katz (1995). However, Reed and Ye (2011) have suggested that when the time dimension is 1.5 times larger than the cross-section dimension (T/N), the FGLS technique obtains better results than the PCSE. Otherwise, PCSE performs better, even if Moundigbaye et al. (2018) have more recently reexamined Reed and Ye’s recommendations. Their findings indicate that if the primary concern is hypothesis testing, PCSE performs better than FGLS.
In Table 5 we have presented the results obtained by the RE GLS and PCSE estimator for both equations. In the first case, Equation 6 measures the impact of the main determinant variables on productivity and Equation 7 captures their effect on the Federations’ efficiency, that is, how these determinants help Federations to move towards the leader’s position.
RE-GLS and PCSE Estimations.

As we mentioned before, we conducted our analyses by differentiating between two categories from the most important determinants noted in the literature; financial and structural components. The financial component, represented by the own revenues to subsidies ratio, shows a positive impact on TFP and EFF, being relevant for both productivity and efficiency. The elasticities estimated report values of between 0.159 and 0.237 for TFP. In the case of EFF, elasticity was between 0.104 and 0.220. In both cases, the values show an inelastic response, indicating that when the ratio of revenues to subsidies increases by 1%, productivity and efficiency will increase by around 0.2%. This means that obtaining revenue is important for both TFP and EFF, thereby confirming our first hypothesis (H1), even if its effects, relative to subsidies, are quite inelastic.
Structural components do on the other hand report interesting results. First, we can see that Governance appears in both models, showing negative results, but the parameters are normally non-significant, except those estimated by RE GLS for EFF. This means that the larger the board, the less efficient a federation is (McLeod et al., 2021; Yeh & Taylor, 2008). This can be interpreted as decreasing returns of scale of a sort for the governance indicator. Although the evidence is not conclusive due to the lack of significance of the parameters, and we cannot confirm our second hypothesis (H2).
The Age variable, which is a proxy variable for experience, shows a similar impact on TFP and EFF. The effects of Age variable on TFP is significant at standard level and negative, which means that the older federations are less productive than the newer ones. This might be a striking result, but it must be remembered that the older a sport is, the more difficult it is to break a record or win an Olympic medal because of the discipline’s mature nature. This has something to do with the limits of human physical capabilities. Furthermore, the older sports are more widely practised internationally and do therefore have a higher level of competition at Olympic level. This makes it more difficult to win a medal and is what this measure would reflect in terms of its effect on productivity performance. We achieved similar results when analysing the effect of the Age variable on EFF, with the impact being negative, also getting quite similar effects from both RE GLS and PCSE and thus confirming our third hypothesis (H3).
The Size variable does in addition shows a small negative effect on TFP and EFF, thus confirming our fourth hypothesis (H4). This can be explained by the difficulty involved in assigning resources efficiently in big organizations.
Finally, the technology frontier (Tech) included in model (11) shows a positive and statistically significant effect on the Federation’s TFP. This implies that there are positive externalities transmitted from the leader towards other Federations which confirm the fifth hypothesis (H5).
Discussion
This study analyses the results of SSF’s participation in the last four editions of the OG (2008–2021) from the point of view of productivity and relative efficiency in the use of available resources. The length of time considered (2005–2021) allows for a more robust analysis than previous studies that contemplate only two Olympic cycles (Torres et al., 2018), or even only 3 years (de Carlos et al., 2017). According to (Ericsson & Smith (1991), an athlete needs at least 10 years or 10,000 hr of sports practice to become a successful competitor, so these types of longitudinal studies, which include long periods, help to smooth the effects of cyclical swings in the performance of some sports disciplines. Moreover, the period covered includes Olympic cycles that have been marked by times of economic crisis (Beijing 2008 and London 2012), and also by the COVID-19 pandemic (Tokyo 2021).
In this context, the use of the FPI provides more powerful information for decision-making as it can discriminate more accurately between the productivity and efficiency of federations by identifying a single benchmark among all observations, unlike other studies (de Carlos et al., 2017) with methodologies that create an efficient frontier for each period with several efficient federations in each of them. The FPI meets the conditions of transitivity and multiplicativity, that is, it allows for multilateral (between different federations) and multi-temporal (between different periods) comparisons instead of merely binary comparisons, as in the case of dynamic analysis, for example, performed through the Malmquist index (Torres et al., 2018). This provides a more accurate standard for assessing management and allocating resources in federated sports in the future, especially considering that the current Olympic cycle is being impacted by the war in Ukraine, with its inflationary and recessionary consequences.
Some of the previous studies on the subject coincide in using the expenditure budget of each federation as an input (de Carlos et al., 2017; Gómez-Déniz et al., 2021; Torres et al., 2018), something which means taking into consideration a flow variable that does not participate directly in the production process and that is destined to both professional and grassroots sport in each federation. To measure efficiency and productivity, this study does instead consider only non-financial stock variables that we believe to be directly related to competitive performance.
As for RQ1, the results indicate that the efficiency of Spanish Sports Federations (SSFs) in managing available resources to achieve competitive results has been highly variable across the four Olympic cycles analysed. Although some federations, such as tennis, triathlon and handball, have consistently achieved above-average efficiency, other disciplines like swimming, athletics and volleyball have shown lower-than-average results. Throughout the four Olympic cycles analysed, a general downward trend in the productivity of sports federations has been observed, although there were some fluctuations, such as a temporary increase during Rio 2016. These results support the idea that productivity in sports organizations is inherently more unpredictable than in other industries, as it is not only influenced by internal factors controlled by the organization itself, but also by external conditions beyond its control, such as the performance of competitors or changes in the competitive environment (Andreff, 2001; Gómez-Déniz et al., 2021). Moreover, the economic crises that have affected Spanish federations in recent years have also impacted sports organizations in other countries, creating a shared context of uncertainty and volatility.
In relation to RQ2, the analysis of persistence by using contingency tables suggests that there is no consistent behavioural pattern in the performance of SSFs across Olympic cycles. The absence of a statistically significant persistence in most periods examined indicates that the rankings of federations fluctuate from one cycle to another. This reinforces the idea that efficiency in this context is influenced by multiple external and internal factors and cannot be attributed solely to the inherent characteristics of a federation or discipline. In the field of sport, there are environmental circumstances in each Olympic cycle that lead the participating federations to make greater or lesser use of the resources at their disposal (Espitia-Escuer & García-Cebrián, 2010). The lack of persistence also supports the validity of the FPI assessment tool, as it demonstrates that the productivity assessment does not depend on the characteristics of the discipline, such as whether the sport is individual or team-based.
Our study also shows that the achievement of good sporting results do not guarantee efficiency, such as the case of the canoeing federation, which, while being the one that has contributed the most medals in all the Games (Guevara-Pérez, Rojo Ramos, et al., 2022), is not the most efficient in any of them. Efficiency is therefore determined by the combination of sporting results and resource consumption. Some federations can achieve efficiency with a greater focus on maximizing results and others reach it through a lower consumption of resources. Between the two extremes we can find some situations in between and federations can consciously or unconsciously opt for one strategy or another. The evolution of productivity throughout the four Olympic cycles analysed has been erratic, showing that success in sport not only depends on individual performance but also on your rivals’ performances. The SSFs in the sample are not competing against each other, but against other international SFs in the same discipline that will also have adopted their strategies to optimize their results.
Another contribution of this study compared to previous studies has been to address the determinants of efficiency and productivity based on sector-specific variables (Terrien et al., 2023; Winand et al., 2012). As for RQ3, the study has identified several determinants that shape the efficiency and productivity of SSFs. The results have shown that a lower dependence on public funds is related to a higher efficiency and productivity of the federations, so it seems that policies to stimulate self-financing through private fundraising have a positive effect (Seguí-Urbaneja et al., 2022). Consistent with RDT, a lower reliance on public funding and a strategic pursuit of private sponsorships can enhance the efficiency and productivity of SFS. This diversification not only provides financial stability but also grants federations greater autonomy in decision-making processes (Berry & Manoli, 2018; Torres et al., 2018). Furthermore, the main source of private funding for federations is sponsorship by commercial organizations that not only try to link their image with Olympic values, but also with the success and triumph of their sponsored athletes. Thus, sponsors will be more predisposed to finance disciplines with greater visibility and possibilities of finishing on the podium. At the same time, the federations that try to attract funds know that the best way to obtain and maintain funding is to maximize sporting performance, which is coherent with the postulates of New Public Management (Hood, 1989), according to which the improvement in public management requires an orientation towards efficiency in the use of resources and the search for results.
With respect to federation governance structures, the results indicate that the larger the size of the board, the less efficient the federations are, which is consistent with the postulates of management theory (Turnbull, 1997) and other studies on the subject in the field of sports (Dimitropoulos, 2011; McLeod et al., 2021; Stenling et al., 2022; Yeh & Taylor, 2008). In this way, the benefits of large boards in terms of a diversity of opinions are offset by the costs in terms of operability and less flexibility in decision-making, negatively affecting the body’s value creation (Solanellas et al., 2024). In the specific case of not-for-profit bodies such as SSFs, the size of the board could generate a general feeling of resistance to assuming individual responsibilities and, therefore, less involvement in decision-making.
The study also shows that the SSFs that have most recently joined the Olympic Games are more efficient and productive than those with a longer history in this event, confirming our H4. This could be logical if we consider that, with time, sports structures acquire vices in management at the same time as the maturity process in a sport makes it more difficult to achieve competitive results. Long-standing SFs might face challenges such as entrenched bureaucracies, resistance to change and complacency, which can negatively impact performance (Winand et al., 2012/2013). Conversely, newer SFs often operate with more flexible structures, embrace innovative practices, and are more responsive to the dynamic demands of the sports environment, leading to enhanced efficiency and productivity (Bayle & Madella, 2002). Finally, our findings validate the hypothesis of positive externalities being transmitted from the leader to the rest of the federations (H5), which could be explained by the trickle-down effect in terms of management, as has been observed in other areas of the sports industry (De Bosscher et al., 2013; Seguí-Urbaneja et al., 2020). This transmission of positive externalities can be interpreted through the lens of institutional theory, according to which organizations in the same field tend to become more similar over time due to institutional isomorphism (DiMaggio & Powell, 1983). Less efficient SFs may emulate the practices of leading SFs to gain legitimacy and improve performance, especially under conditions of uncertainty. This mimetic behaviour facilitates the diffusion of effective management practices across federations. Moreover, normative pressures, such as shared professional standards and educational backgrounds among federation leaders, further promote the adoption of similar practices (Scott, 2008).
Conclusion
Measuring the performance of professional sports is a complex task that needs to be addressed from different perspectives. Moreover, it is difficult to reach a single conclusion without taking into account other considerations. This paper focuses on evaluating the performance of Olympic federations from the point of view of the how their productivity has evolved in the last four Olympic cycles and, secondly, it tries to identify the determinants.
The use of the Färe-Primont index is a contribution from our work that assures accuracy in our results, since this index allows for both multitemporal and multilateral comparisons. In addition, it allowed us to obtain three relevant measures for our study; Productivity (TFP), Efficiency (EFF) and Frontier Technology (Tech). This last variable captures the TFP obtained by the most efficient Federation in each period. The two previous variables were used as dependent variables in models (11) and (12) respectively, and the third variable was used as a determinant of TFP in model (11). The positive and significant parameters obtained for the Tech variable confirm the existence of positive externalities from the leader to the other Federations.
The results obtained, which show a certain persistence in the ranking of federations and a balance between team and individual sports, also enhance the consistency and credibility of both the model and the selected indicators. Furthermore, the study covers a long period of analysis, four (4) Olympic cycles, something which allows us to partially mitigate the effect of abnormal performances in certain sports disciplines as a consequence of the spontaneous presence of especially talented athletes during a specific period.
In broad terms, the productivity of Spanish sports federations has shown improvement after the London 2012 Olympic Games, which could suggest that the measures to improve the financial situation introduced by the Spanish government at that time have had a positive impact on the performance of the Olympic federations. However, some federations, such as Tennis, Triathlon and Taekwondo, persistently achieve an above-average performance. The pattern of behaviour of the most efficient Olympic federations is the lower dependence on public resources and the smaller size of the governing bodies. At an individual level, those federations that have implemented the policies associated with the NPM more decisively did thereby obtain better results.
The different nature of the sports disciplines analysed has forced us to choose generic inputs and outputs to make their activity comparable, something which limits the precision and scope of the conclusions. In any case, this is precisely one of the contributions of the study, since the government agents responsible for distributing resources among the federations need criteria for decision-making.
Thus, a practical implication of this study is the need for policymakers and sports administrators to rethink funding allocation strategies. The results show that SFs with a lower dependence on public funding and more flexible governance structures achieve higher levels of productivity and efficiency. Fostering diversified funding strategies and promoting governance structures that balance expertise with agility could therefore contribute to a more sustainable and competitive sports ecosystem. According to Bayle and Clausen (2024) and Solanellas et al. (2024), diversifying income sources reduces the financial vulnerability of nonprofit organizations (NPOs). Moreover, Winand et al. (2012) highlight that effective leadership within SFs requires a high degree of expertise and engagement to align organizational design with evolving environmental conditions. In line with Ferkins and Shilbury (2012), smaller boards may enhance strategic decision-making by streamlining communication and concentrating leadership efforts. Another practical implication of this study is the need for policymakers to make strategic decisions about whether to prioritize the social benefits of grassroots sport participation or to focus on achieving success in elite competition, since the findings suggest a potential trade-off between social inclusivity and elite performance. In line with Green (2006) and De Bosscher et al. (2013), when designing funding and governance frameworks, policymakers must weigh the benefits of investing in grassroots initiatives which foster social cohesion and broad participation, against the emphasis on high-performance sports programmes that deliver international success, but which may exclude wider societal benefits.
Despite the contributions of this study, several limitations should be acknowledged. First, the Färe-Primont index, while robust in satisfying regularity conditions and allowing multi-temporal and multi-lateral efficiency comparisons, has limitations when comparing sports federations. The selection of generic inputs and outputs, necessary to ensure comparability across disciplines, may overlook sport-specific dynamics that influence performance. Second, the federations analysed do not compete directly with one another, but rather with their counterparts from other countries. As such, their performance is influenced not only by internal factors but also by the actions and investment strategies of foreign federations, which are beyond the scope of this analysis. Third, although this study includes the size of the governing body as a variable, it does not account for other governance characteristics that may also affect organizational efficiency and productivity, such as gender balance, level of professionalization or inclusion of former athletes. Future research could explore the influence of these dimensions in greater depth to better understand how internal governance structures shape performance outcomes in national sports federations.
Future studies should also examine the performance of national federations in specific disciplines at the international level, as this would allow the inclusion of discipline-specific variables and better account for the influence of policies adopted by their international counterparts.
Footnotes
Appendix
TFP, Tech, EFF and IO Results.

| Federation | 2008 | 2012 | 2016 | 2021 | ||||||||||||
|---|---|---|---|---|---|---|---|---|---|---|---|---|---|---|---|---|
| TFP | Tech | EFF | IO | TFP | Tech | EFF | IO | TFP | Tech | EFF | IO | TFP | Tech | EFF | IO | |
| Athletics | 0.011 | 0.4921 | 0.0223 | 0.0485 | 0.0038 | 0.3932 | 0.0098 | 0.0198 | 0.0065 | 0.4878 | 0.0134 | 0.04 | 0.0067 | 0.2017 | 0.0334 | 0.0495 |
| Badminton | 0.0328 | 0.4921 | 0.0666 | 0.0222 | 0.0353 | 0.3932 | 0.0898 | 0.0222 | 0.389 | 0.4878 | 0.7973 | 0.2222 | 0.0205 | 0.2017 | 0.1018 | 0.0222 |
| Basketball | 0.083 | 0.4921 | 0.1686 | 0.4056 | 0.0641 | 0.3932 | 0.1631 | 0.3056 | 0.0918 | 0.4878 | 0.1883 | 0.4722 | 0.0166 | 0.2017 | 0.0823 | 0.1111 |
| Handball | 0.1066 | 0.4921 | 0.2166 | 0.2222 | 0.0882 | 0.3932 | 0.2244 | 0.3222 | 0.0395 | 0.4878 | 0.081 | 0.1389 | 0.0853 | 0.2017 | 0.4228 | 0.3889 |
| Boxing | 0.0288 | 0.4921 | 0.0586 | 0.0101 | 0.0217 | 0.3932 | 0.0552 | 0.0085 | 0.0732 | 0.4878 | 0.1501 | 0.0239 | 0.1222 | 0.2017 | 0.6056 | 0.0547 |
| Cycling | 0.1159 | 0.4921 | 0.2355 | 0.2109 | 0.0228 | 0.3932 | 0.0581 | 0.0386 | 0.0515 | 0.4878 | 0.1055 | 0.0646 | 0.0207 | 0.2017 | 0.1028 | 0.0278 |
| Gymnastics | 0.0271 | 0.4921 | 0.0551 | 0.0478 | 0.0179 | 0.3932 | 0.0455 | 0.0293 | 0.0328 | 0.4878 | 0.0672 | 0.0409 | 0.0261 | 0.2017 | 0.1293 | 0.034 |
| Weightlifting | 0.1496 | 0.4921 | 0.304 | 0.0503 | 0.1979 | 0.3932 | 0.5034 | 0.0852 | 0.0807 | 0.4878 | 0.1654 | 0.0392 | 0.055 | 0.2017 | 0.2725 | 0.0258 |
| Equestrian | 0.034 | 0.4921 | 0.069 | 0.0185 | 0.0561 | 0.3932 | 0.1427 | 0.0423 | 0.0585 | 0.4878 | 0.1199 | 0.0757 | 0.0286 | 0.2017 | 0.1417 | 0.0423 |
| Hockey | 0.0938 | 0.4921 | 0.1905 | 0.377 | 0.0357 | 0.3932 | 0.0908 | 0.1389 | 0.0458 | 0.4878 | 0.0939 | 0.2181 | 0.0397 | 0.2017 | 0.1969 | 0.1895 |
| Judo | 0.0321 | 0.4921 | 0.0653 | 0.0467 | 0.016 | 0.3932 | 0.0407 | 0.0222 | 0.0249 | 0.4878 | 0.051 | 0.0222 | 0.0149 | 0.2017 | 0.0737 | 0.0169 |
| Swimming | 0.0092 | 0.4921 | 0.0186 | 0.0316 | 0.0162 | 0.3932 | 0.0411 | 0.0626 | 0.0126 | 0.4878 | 0.0259 | 0.0514 | 0.008 | 0.2017 | 0.0398 | 0.0315 |
| Canoeing | 0.1025 | 0.4921 | 0.2082 | 0.1601 | 0.0923 | 0.3932 | 0.2347 | 0.1638 | 0.1297 | 0.4878 | 0.2658 | 0.2616 | 0.0389 | 0.2017 | 0.1927 | 0.1685 |
| Taekwondo | 0.054 | 0.4921 | 0.1096 | 0.0389 | 0.3875 | 0.3932 | 0.9856 | 0.2639 | 0.2162 | 0.4878 | 0.4431 | 0.1431 | 0.1015 | 0.2017 | 0.5032 | 0.0764 |
| Tennis | 0.4921 | 0.4921 | 1 | 0.4028 | 0.1149 | 0.3932 | 0.2921 | 0.1122 | 0.4878 | 0.4878 | 1 | 0.3922 | 0.2017 | 0.2017 | 1 | 0.1689 |
| Table Tennis | 0.0439 | 0.4921 | 0.0893 | 0.0278 | 0.0563 | 0.3932 | 0.1432 | 0.0278 | 0.0505 | 0.4878 | 0.1036 | 0.0278 | 0.0264 | 0.2017 | 0.1307 | 0.0222 |
| Archery | 0.0848 | 0.4921 | 0.1723 | 0.0278 | 0.0798 | 0.3932 | 0.203 | 0.0278 | 0.0655 | 0.4878 | 0.1343 | 0.0278 | 0.061 | 0.2017 | 0.3022 | 0.0222 |
| Shooting | 0.0148 | 0.4921 | 0.03 | 0.0157 | 0.0391 | 0.3932 | 0.0995 | 0.0452 | 0.0362 | 0.4878 | 0.0743 | 0.0352 | 0.1028 | 0.2017 | 0.5093 | 0.0741 |
| Triathlon | 0.3591 | 0.4921 | 0.7298 | 0.2806 | 0.3932 | 0.3932 | 1 | 0.377 | 0.158 | 0.4878 | 0.3239 | 0.1181 | 0.0443 | 0.2017 | 0.2198 | 0.037 |
| Sailing | 0.1115 | 0.4921 | 0.2266 | 0.1874 | 0.1211 | 0.3932 | 0.3081 | 0.2236 | 0.0321 | 0.4878 | 0.0658 | 0.0561 | 0.0537 | 0.2017 | 0.2664 | 0.1444 |
| Volleyball | 0.0244 | 0.4921 | 0.0495 | 0.0278 | 0.0209 | 0.3932 | 0.0532 | 0.0278 | 0.0191 | 0.4878 | 0.0391 | 0.0278 | 0.0203 | 0.2017 | 0.1008 | 0.0278 |
ORCID iDs
Funding
The authors disclosed receipt of the following financial support for the research, authorship, and/or publication of this article: This research was funded by the Spanish Government Project PID2024-159374NB-I00, funded by MICIU/AEI/10.13039/501100011033/FEDER, UE.
Declaration of Conflicting Interests
The authors declared no potential conflicts of interest with respect to the research, authorship, and/or publication of this article.
Data Availability Statement
The raw data supporting the conclusions of this article will be made available by the authors, without undue reservation.