
Abstract
This article suggests that the cultural distance between participating and host countries can be a new determinant of medal performance at international sports competitions. Prior research has mainly focused on single-country variables, including population size, GDP, political system, and home advantage. This paper provides a unique perspective on the determinants of medals won at the Summer Olympic Games and argues that the gap between host and participant countries may explain the substantial variance of medal performance. Specifically, we find that countries participating in the Summer Olympic Games hosted in a culturally distant country show poor medal performance. These findings highlight the importance of a joint study between the dimensions of national culture and sports management.
Introduction
Researchers from diverse fields have been actively investigating the demographic and economic determinants of the number of medals won in mega sporting events (e.g., Bernard & Busse, 2004; Bredtmann et al., 2016; Forrest et al., 2010; Vagenas & Vlachokyriakou, 2012). It is widely accepted that Olympic medal performance is associated with participating countries’ demographic, economic, social, and political profiles (Hoffmann et al., 2004; Vagenas & Vlachokyriakou, 2012). Consequently, several studies have found that there is a home advantage in the Olympic Games (Balmer et al., 2003), which means that despite playing by the same rules, not all athletes play games in a homogeneous environment. However, these findings notwithstanding, studies of the conditions under which the differences of cultural values amongst countries may be significant remain scarce. For example, individualistic nations and their residents may be liable to identify themselves with a sports team, while collectivistic cultures and their residents may not (Gau & Kim, 2011). Training regimens may then be modified to account for these cultural differences in order to help Olympic athletes maximize their performance in competition. In light of this, this study is intended to suggest a new indicator for explaining medal performance by positing that a function of differences among cultures may affect Olympic medal performance.
This study attempts to extend the rationale of cultural distance into the context of international sports games. Hofstede (1980) defined cultural distance as a unique measure to describe and gauge differences across cultures (e.g., House et al., 2004). Higher cultural distance implies higher dynamic adjustment costs in order to conform to the new cultural setting (Newman & Nollen, 1996). For example, cultural distance negatively affects the development of international alliances (Lew et al., 2016), knowledge spillover (Powell, 2017), exit decision (Sousa & Tan, 2015), and export performance (Azar & Drogendijk, 2016). Therefore, we suggest that greater national culture distance between participating and host country negatively influences the participating country’s medal performance at the Olympic Games.
Our study contributes to the extant literature in several ways. First, we contribute to the relatively under-explored literature: cultural distance toward international sports performance. This study links the framework of cultural distance to the literature on the international sports event. Specifically, we establish a link between the cultural distance of two countries and medal performance by suggesting that cultural distance can be considered a new predictor for performance at the Olympic Games. Second, our results have practical implications for sports management. We confirm the country-level effect of cultural distance on medal performance in an international sports event and thus contribute to the existing studies on sports management from a cross-cultural perspective. Given the cultural distance between host and participating countries, disadvantages stemming from a national cultural distance must be alleviated. The article is structured in the following manner. In the next section, we hypothesize and develop the theoretical explanation for the effects of national cultural distance on medal performance at the Olympic Games. We then describe the methodology designed to test this explanation. We also present the results. In the final section, we discuss our findings.
Literature Review
Olympics Medal Performance
It has been widely accepted that a largely populated and economically developed nation makes it possible for its athletes to better perform in the Olympics because they can often afford to train athletes better, to provide better medical care and scientific training, and to send a large group of athletes to the Olympics (Andreff, 2001; Bernard & Busse, 2004; Bian, 2005; Vagenas & Vlachokyriakou, 2012). Successful sporting performance is also generated from national wealth in a nation since a wealthy country can allocate a more significant amount of resources to the development of sporting infrastructure (Hoffmann et al., 2004). Therefore, it is not surprising that the Olympic medal performances of the Chinese team have improved with its fast economic growth, and the 2008 Beijing Games proved it, with the Chinese team topping the medal standings with 100 medals for the first time. Bernard and Busse (2004) found that a nation’s economic resources play an essential role in Olympic medals winning by investigating the Olympics’ performance from 1960 to 1996. Moosa and Smith (2004) also explained why the medal performance at the 2000 Sydney Olympics was quite similar to the previous Olympic Games through population size and GDP.
However, population size and economic growth are not enough to explain and predict the Olympics medal performance. Fortunately, it has been verified that the impact of home advantage and political structure on the medal performance at international sports events exists. Home advantage as one of the psychological effects has been studied (Ball, 1972; Bernard & Busse, 2004; Bian, 2005; Forrest et al., 2010; Grimes et al., 1974; Johnson & Ali, 2004). It has been empirically verified that home advantage significantly impacts the number of medals a nation can make at the Olympics. Indeed, the hosting country is generally allowed to participate in all events, thus increasing the chances of winning medals. Moreover, the athletes from the home country can be emotionally supported by the group of home spectators. For example, compared to the 1984 Games, South Korea doubled its medal performance at the 1988 Games hosted in Seoul. China also won the most medals in the 2008 Games held in China. Tcha (2004) argued a strongly centralized government tends to allow its resources to improve the country’s sporting performance. Especially, socialist governments tend to channel a more significant proportion of national resources into coach development and training facilities since the Olympics can be seen as a vehicle for enhancing national pride (De Bosscher et al., 2009). Sports policy in these types of countries would significantly contribute to the success of international sports.
With a systematic study on the variability of competitive performance in various sports, Malcata and Hopkins (2014) proposed that environmental conditions partially affected medal performance in competitive sports. The environment here refers to the microenvironment of the venue, not the local social and cultural environment. For instance, Greenleaf et al. (2011) argued that housing is a factor influencing Olympics medal performance. For further study, De Bosscher et al. (2016) classified factors determining top-level success in sports into micro-level and macro-level. Specifically, the social and cultural context where people live, such as economic welfare, population, and geographic variation, has been demonstrated to significantly impact national game success.
Cultural Distance
Defined and developed by Hofstede (1980), cultural distance measures describe and gauge a function of differences amongst cultures (e.g., House et al., 2004). Hofstede’s cultural dimensions are considered a well-known framework to understand the differences of cultural values and communication norms among countries by measuring how similar or different one culture is from the other culture. For this reason, this framework is used to grasp the differences in values rooted in national culture even among organizations. For example, Zeng et al. (2013) found that multinational enterprises (MNEs) expanding into dissimilar cultures tend to be entrenched in their past experiences and thus suffer from incorrect learning without the understanding of the new culture. Specifically, the more significant cultural distance between the home and host country is, the more difficult it is for MNEs to gain legitimacy in the host country, which explains why the MNE subsidiary in the host country undergoes liability of foreignness (Zeng et al., 2013).
Given that cultural distance is calculated from the difference between host and guest, we argue that the concept of cultural distance is not only limited to business research but also can be more widely applied to other research fields (e.g., Malik, 2021; Malik et al., 2021; Malik & Zhao, 2013). In this paper, we attempt to explain whether the discussion on cultural distance can be extended beyond a business setting to explaining Olympic medal performance. Athletes may have some obstacles from the cultural difference when competing in the Olympic Games, as though MNEs face these obstacles in the host country (Guest, 2007). For instance, interpersonal stress from other players or spectators can increase foreign players’ chance of getting distracted easily and making a mistake during an event, thereby lowering their performance (Hoffmann et al., 2004). Also, Choi et al. (2019) show a negative correlation between nations’ linguistic distance and Olympic Games outcomes.
Given that athletes seek to maintain their physical and mental state when competing in overseas games, it is crucial for athletes to experience an environment similar to their own country for high performance (Roy et al., 2012). In line with this thinking, athletes competing overseas should spend extra time and energy adapting to the local circumstances that differ from their accustomed conditions for training and competition. It is presumed that different cultural environment between participating countries and host countries impedes medal performance. Therefore, we focus on how cultural distance affects Olympic competition outcomes.
This paper aims to extend the discussion of home advantage from a cross-cultural perspective. Cultural distance, calculated by Kogut and Singh (1988), based on four value dimensions—power distance, individualism distance, masculinity distance, and uncertainty avoidance distance—developed by Hofstede (1980), led us to the hypothesis that Olympic medal-winning performance would differ depending on the cultural distance between the host country and participating countries.
First, power distance (vs. closeness) reflects the degree to which lower-ranking individuals react to higher-ranking ones. Hofstede (1980) suggested that people with a high power distance tend to follow bureaucracy and that higher-ranking individuals are respected. On the other hand, individuals are more likely to pursue an equally distributed power in societies with a low power distance. Therefore, athletes in societies with a high power distance are more likely to perceive the relationship between themselves and their coaches as being within a hierarchical system. Second, the individualism (vs. collectivism) dimension considers the extent to which societies are loosely integrated into groups. Thus a person’s self-image is usually defined as “I”, rather than “We.” For example, athletes from a nation with individualism-prevailing culture tend to focus on their individual achievements, and thus, attaining their goals weigh heavily with them rather than team achievements. Third, masculinity (vs. femininity) is referred to as tough (vs. tender) so that masculine environments induce people to pursue achievement, assertiveness, and even material rewards. In contrast, femininity tends to perceive cooperation or modesty as a virtue. For an illustration, athletes become exposed to masculine moods, which keep them excited or even angered. It is also conducive to their morale. Finally, uncertainty avoidance refers to the extent to which people are tolerant of future uncertainty. Therefore, nations with a strong uncertainty avoidance index are more likely to be uncomfortable with the unknown and thus attempt to minimize the occurrence of the unknown and seek to guarantee certainty by behaving in a strict manner such as rules, laws, and regulations. On the contrary, countries displaying weak uncertainty avoidance tend to tolerate being unstructured and accept changeable environments.
We argue that the cultural gap between athletes’ home country and Olympic host country might create stress and tension and thus undermine morale. For instance, athletes from equal countries might feel uncomfortable adapting to a relatively authoritative country regarding power distance. This might bring on more conflict with the organizers and officials of the Games. And professional athletes fundamentally may seek to minimize uncertain situations by keeping training and preparing hard for good results. These athletes might be thwarted by the culture of unpunctuality or unpredictable preparations in the hosting counties. Therefore, the liability of foreignness caused by each dimension of cultural distance may hamper athletes from achieving.
In other words, the cultural distance measured in sub-dimensional features (i.e., power distance, individualism-collectivism distance, masculinity-femininity distance, and uncertainty avoidance distance) increases the uncertainty and emotional burden to athletes. In the same vein, we expect that a composite measure of cultural distance aggravates the disadvantage of athletes from culturally remote counties. It thus represents an invisible cost to participating in culturally unfamiliar countries. Framed differently, based on cultural familiarity theory, countries participating in the Olympics held in a host country that is culturally close to them would win more medals since the participating countries may have “home-similar” advantages in the host country.
Method
Data Collection
We obtained the medal data from the official website of the International Olympic Committee. The data consists of two main components: the Olympic medal counts and cultural distance indicators. 1 Since the original cultural distance indicators only cover 55 countries (Kogut & Singh, 1988), we used both an extended version developed by Palisto (2012) covering 101 countries and a Hofstede Insights webpage providing their cultural survey tool based on Hofstede’s dimensional constructs. 2 As a result, our final sample covers 116 countries, based on 14 Summer Olympic Games over from 1960 to 2016. It is sensible to exclude the Olympic Games before 1960 and after 2016 for the following reason. The medal performance of socialist countries may have been overvalued before the 1960s. Compared to recent Games, participating countries before 1960 were restricted to only specific ones. Furthermore, the 2020 COVID-19 pandemic outbreak postponed the Summer Olympics—before then, only world wars have led to the cancellation of the Olympics. Based on protocols at the 2020 Olympics, all participants needed to take two negative tests before they arrived in Tokyo. They were additionally required always to wear masks and keep social distancing. Moreover, players were confined to their accommodations. In addition to these constraints, participants had to compete in their events in accordance with new rules. These conditions may have made even athletes with similar cultures feel unfamiliar. In sum, the Olympic Games before 1960 and after 2016 are not homogeneous with samples we focus on in our paper. We decided, therefore, to consider the 14 Summer Games between 1960 and 2016. As a result, a total of 1,302 observations (countries) were analyzed.
Measurements
The cultural distance was measured with four items and a composite distance index using a Euclidian distance measure. 3 The Euclidian distance between two countries A and B was calculated as

where
Although the measure of cultural distance framework has become more varied, especially Hofstede’s six dimensions, which consist of existing four dimensions with added two new dimensions (Hofstede et al., 2010), we used the original four-dimensional constructs developed by Hofstede (1980)—power distance, individualism distance, masculinity distance, and uncertainty avoidance distance. Of course, the four original dimensions have been criticized, with detractors questioning the representativeness and outdatedness of his sample (Brewer & Venaik, 2011). But the two additional dimensions—long-term orientation and indulgence versus restraint—throw doubt on whether the six dimensions are more suitable for cross-cultural studies than the four dimensions, as the two new dimensions are not highly correlated with the four original dimensions (Beugelsdijk et al., 2018). Hofstede did not even conduct any factor analysis. Later studies found that a three-factor structure best fits the data on 62 countries, explaining 72% of the variation across all six dimensions (see Beugelsdijk et al., 2018).
Meanwhile, some find it improper and imprecise to use a composite cultural distance index introduced by Kogut and Singh (1988). The dimensions are conceptually different and unsuitable for decision-making (Kirkman et al., 2006). Others dispute that the composite index is still worthwhile and valuable in terms of tractability (Cuypers et al., 2018). Although it may always be an arguable point, many distance research still utilizes the Kogut and Singh cultural distance index. Thus, we used both the four original individual dimensions and their composite ones. The country table with individual sub-cultural construct is included in Table A1 in the Appendix.
We included country-level controls that might affect international sports performance based on past research (Forrest et al., 2010). National-level economic resources are a critical antecedent for sports performance (Bernard & Busse, 2004). Therefore, we consider the GDP per capita and population. Our primary source for population and GDP is the World Bank database. Historically, socialist countries have supported the Olympic Games as a propaganda tool. Therefore, we control socialist country such as the Soviet bloc and other countries which are (or were) operating as “planned” economies (Forrest et al., 2010). We also added the home advantage variable to control for home advantage, coded as 1 for game-hosting country and 0 otherwise. We can also expect the country-level team size to influence medal-winning performance. Thus, we included team size. Lastly, we consider the geographic distance between the participating and host country. Prior research shows that since the geographic distance between countries can increase risks and influence performance, it is crucial to consider physical distance in cross-cultural research (Tung, 2010). Thus, our research model can explore the distinct net effect of cultural distance. Finally, Olympics opening year dummies were included in every regression to capture year-specific effects. The negative coefficients of the year dummy variable might indicate that more and more countries participate in the Olympic Games, and thus the unequal distribution of medal performance is alleviated (see Table A2 in the Appendix).
Analysis and Results
The share of all medals (gold + silver + bronze) won by each nation was analyzed using two different methods. First, we test our research question by fitting multilevel regression to explain how country-level cultural contexts influence performance in the Games. The multilevel model enables us to account for clustering, that is, non-independence of observations within the same countries. This suggests that there may be the intra-class correlation (ICC) among countries to be used for cross-national comparisons (Bickel, 2007). Since an ICC value larger than .10 indicates that the analysis model violates the assumption of independent observation (Bickel, 2007), we conducted multilevel model estimation by using the “xtmixed” command in Stata after checking the ICC value from our sample is .826. Therefore, it also offers an improvement over the option of aggregating the data to the country-level (Stephan et al., 2015). Second, the traditional analysis of the t-test is used to compare the medal-winning performance of the focal country while participating in Games in culturally similar and different countries.
The summary statistics and correlations are presented in Table 1. The regression results for the impact of country-level cultural distance on medal performance are displayed in Table 2. Model 1, Model 2, Model 3, and Model 4 showed whether power distance, individualism distance, masculinity distance, and uncertainty avoidance distance negatively influence medal performance, respectively. The results show that masculinity and uncertainty avoidance distance are negatively associated with medal share. Specifically, masculinity distance (b = −0.007, p < .01) and uncertainty avoidance distance (b = −0.002, p < .1; marginally significant) have a significantly negative impact on medal share, while power distance and individualism distance also has a negative impact on medal share, but not significant. Model 5 confirmed our expectation that a composite cultural distance index has a significantly negative impact on medal performance (b = −0.002, p < .05).
Summary of Variables and Correlation.

p < .1. **p < .05. ***p < .01.
Multilevel Regression for the Summer Olympic Games.

Note. p-Values are in parentheses.
p < .1. **p <.05. ***p < .01
These results generally support the hypothesis that the liability of foreignness a nation may experience caused by cultural distance can negatively affect winning an Olympic medal. The effects of controls on medal performance are also generally aligned with the findings in past research. For example, country-level economic resources such as GDP per capita and population are positively associated with medal share. Socialist countries, home advantage, and team size are also found to boost medal-winning performance.
To interpret this result intuitively, we plotted the marginal effects (“marginsplot” command in Stata), as shown in Figure 1 (Meyer et al., 2017), which presents the effect of cultural distance on the probabilities of medal-winning performance in Table 2. It shows that masculinity distance, uncertainty avoidance distance, and the composite index of cultural distance are statistically significant and covers over 100% of the observations. Our subsequent analyses are mean value comparisons when the focal country participates in culturally close and distant countries in the Summer Olympic Games. Figure 2 indicates an expected increase of 0.29%, 0.37%, 0.29%, and 0.24% for respective totals of all, gold, silver, and bronze medals when the focal country participates in a culturally similar (i.e., low cultural distance gap = 1) country compared with a case 1 standard deviation apart (i.e., low cultural distance gap = 0; p < .01 by t-test). Overall, our results from the multilevel regression and t-test analyses show that cultural distance is an economically effective and statistically significant antecedent for national-level Olympic Summer Games performance.
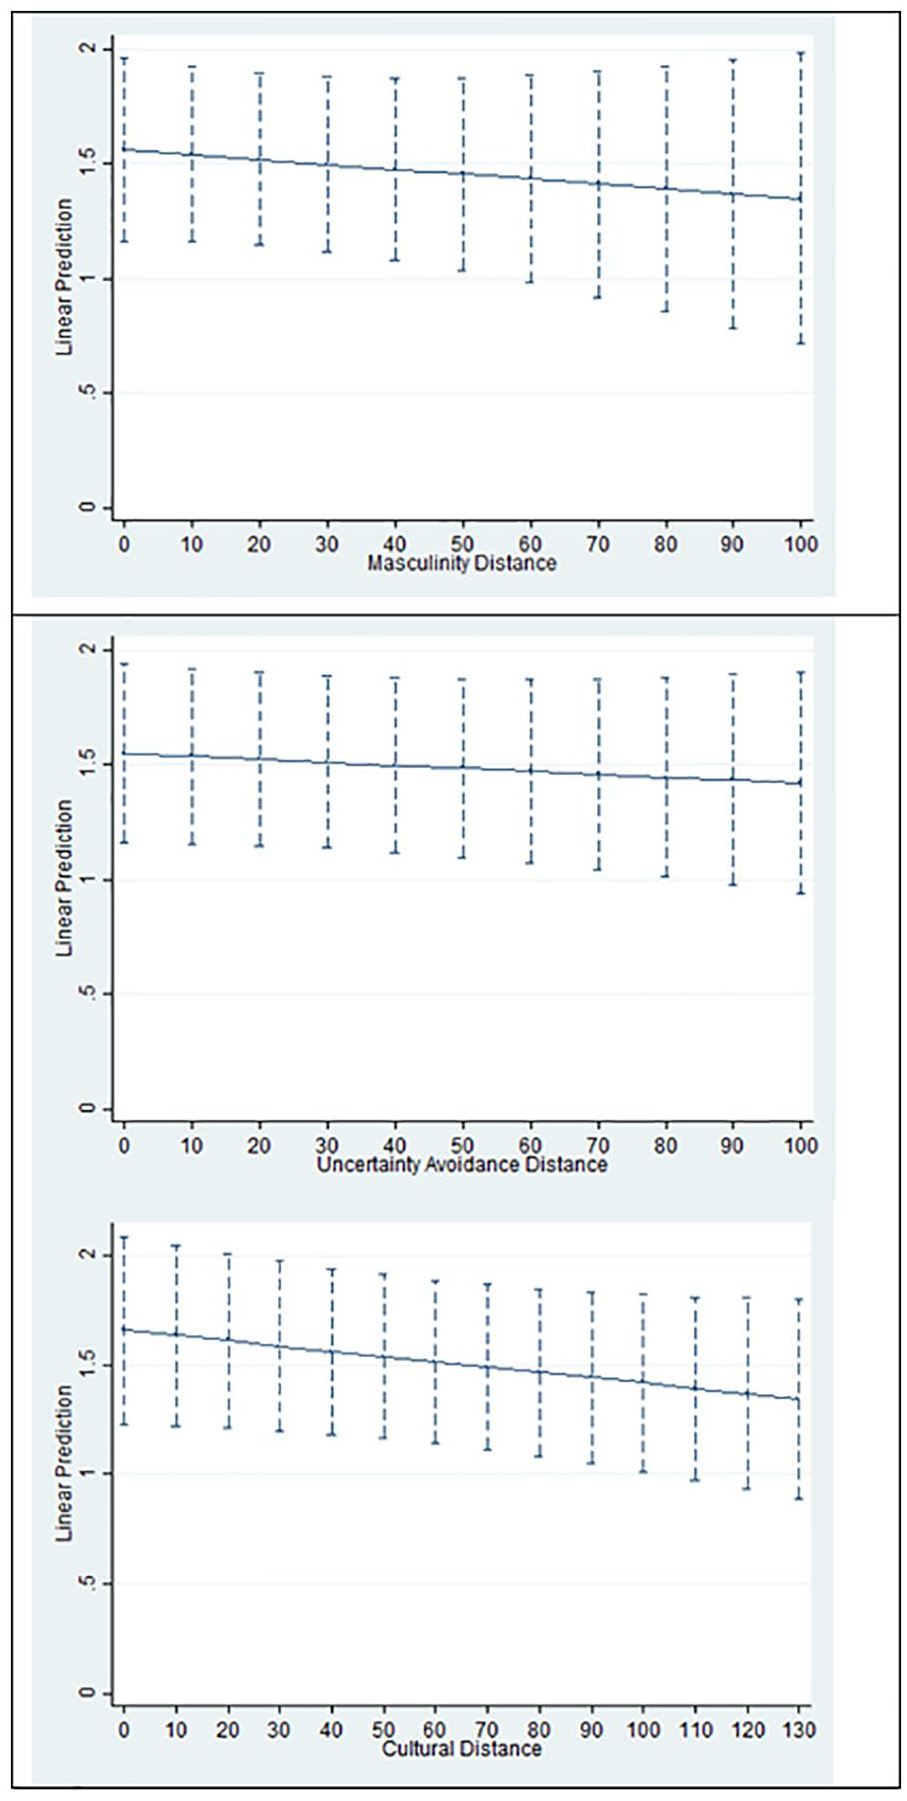
The marginal effects of masculinity distance, uncertainty avoidance distance, and cultural distance on the probabilities of all medal shares in the summer Olympic Games.

Mean comparison for all, gold, silver, and bronze medal shares.
Discussion
This study extends the existing discussion on “distance liability” in international business from a cross-cultural perspective. Cultural distance is typically used in business contexts, especially when MNEs develop entry strategies to alleviate the liability of foreignness on the overseas market (Zeng et al., 2013). In this study, we obtained sub-cultural distance measures based on Hofstede (1980) and then linked them with the medal outcome of the summer Olympic Games. Formerly, the research on identifying the factors of competitive sports outcomes mainly focused on countries’ internal ability (Bernard & Busse, 2004; Bian, 2005; Forrest et al., 2010). However, we measured cultural distance as an external factor measured by the cultural characteristics between the host and participating country and found that the longer cultural distance, the less likely it is for the participating countries to win medals in the Olympic Games. In other words, the cultural distance between the host country and the participating one negatively influences medal-winning performance. Specifically, the participating-host gap in power distance and individualism distance is not significant. In contrast, the gap measured by masculinity distance and uncertainty avoidance distance is highly and negatively associated with medal performance. We believe that this separation on cultural distance has practical implications for policymakers of sports administrations because our results can be applied to predict international sports outcomes. Our results imply that considering specific sub-culture dimensions might be important in establishing a sports policy for government or competitive strategy for national coach boards.
The results of post estimation indicate that the increase of 10 units of cultural distance might reduce 2% of medal share. Our findings can be understood more intuitively. For example, the value of the cultural distance between South Korea-China and South Korea-United Kingdom was 64.5 and 94.3, respectively. Our model predicts that after excluding the effect of geographic distance between the countries, South Korea must have performed worse in the 2012 London Olympics than in the 2008 Beijing Olympics. In reality, South Korea won 32 medals in the Beijing Olympics while winning 28 medals in the London Olympics.
However, cultural distance on the medal performance in the Winter Olympics does not indicate significant results. 4 We believe that this can be attributed to the Winter Olympics’ unique characteristics compared to the Summer, such as some distinct features of the host countries, the size of the games, and the concentration of winning medals. First, the cities that want to host the Olympics should evaluate the best probable weather conditions for natural snow and artificial snowmaking. Even bidding cities should care about their weather conditions to play host, with the global climate getting warmer. Specifically, Winter Olympics have been held in only 13 countries, from the first Games at Chamonix, France, in 1924 to the upcoming Games in Beijing, China, in 2022. Therefore, we expect that home advantage in the host nation is different compared to the Summer Olympics. Second, the Winter Olympics are different from the Summer Olympics concerning the size of games and individual teams. A total of 10,903 athletes from 206 countries participated, and there were 974 medals at stake in 28 sports across 42 disciplines in the 2016 Rio Summer Olympics, while a total of 2,925 athletes from 93 countries participated and there were 306 medals at stake in 7 sports across 15 disciplines in the 2018 Pyeong Chang Winter Olympic Games. Moreover, the size of individual teams at the Winter Olympics is relatively small compared to the Summer Olympics. For example, 92 countries participated in the 2018 PyeongChang Olympic Games. Participating nations brought the largest athlete delegation in Winter Olympics history, but 41 countries competed in the Olympics with fewer than five athletes. Finally, when it comes to winning medals, the numbers of countries are smaller; even concerning winning gold, only 36 countries earned gold medals in the Winter Games versus 106 countries in the Summer Olympics. Furthermore, only 44 countries have ever won a medal of any type in the Winter Olympics, compared with 147 countries that have won a medal in the Summer. Therefore, we believe that this condition makes it more tricky for us to interpret the impact of cultural distance on the medal performance in the Winter Games.
Limitations and Future Research
There are still limitations to this study. First, we could not measure the cultural distance of all countries participating in the Olympics. For instance, Belarus was excluded from the sample in this study despite winning two gold medals and one silver medal in the 2018 Pyeong Chang Olympic Games because it was a country that Hofstede did not measure. Second, the critiques of Hofstede’s cultural dimensions notwithstanding, we followed his dated analysis without revision. Lastly, we did not consider the likelihood of athletes’ individual features such as multicultural background, age, and foreign experience. It means that cultural traits can be created and developed from both the micro-level and macro-level. For example, South Korea (19.7) has a cultural distance from Canada (71.4), but the distance can be much closer to each other personally. Yu-na Kim, an Olympic medalist in figure skating, had been trained in Toronto and by her coach from Canada from a young age. These conditions may help her understand and mitigate the cultural differences between the two nations.
Therefore, this study raises several questions and the necessity of future research. First, we examined only four value dimensions of culture measured by Hofstede (1980), some of which have been criticized for cultural biases (Harzing & Hofstede, 1996) that may not be relevant to sports games given individual competition. Therefore, future studies using other cultural distance measurements (e.g., Schwartz & Sagiv, 1995) may provide more realistic insights on the impact of culture on medal performance. Second, we used the concept of national cultural distance in this study in order to explore the influence of national culture on medal performance in sports games. However, individual perceptions of athletes are pretty likely to be different from national cultural distances. Therefore, new cultural distance considering individual perceptions might help us better understand cultures’ impact and make the cultural distance an accurate predictor variable on medal performance.
Footnotes
Appendix
Multilevel Regression for the Summer Olympic Games, Including Year Dummies.

| DV: All medal share | Model 1 | Model 2 | Model 3 | Model 4 | Model 5 |
|---|---|---|---|---|---|
| Power distance | 0.001 (0.379) | ||||
| Individualism distance | –0.001 (0.282) | ||||
| Masculinity distance | –0.007*** (0.007) | ||||
| Uncertainty avoidance distance | –0.002* (0.058) | ||||
| Cultural distance (composite) | –0.002** (0.042) | ||||
| GDP(log) | 0.155*** (0.003) | 0.155*** (0.003) | 0.152*** (0.003) | 0.155*** (0.003) | 0.154*** (0.003) |
| Socialist country | 0.566*** (0.000) | 0.562*** (0.000) | 0.540*** (0.000) | 0.546*** (0.000) | 0.548*** (0.000) |
| Distance(log) | 0.035 (0.561) | 0.038 (0.522) | 0.033 (0.572) | 0.034 (0.565) | 0.038 (0.52) |
| Team size | 0.008*** (0.000) | 0.008*** (0.000) | 0.008*** (0.000) | 0.008*** (0.000) | 0.008*** (0.000) |
| Population | 0.316*** (0.000) | 0.313*** (0.000) | 0.309*** (0.000) | 0.315*** (0.000) | 0.311*** (0.000) |
| Home advantage | 0.682** (0.011) | 0.633** (0.018) | 0.546** (0.043) | 0.594** (0.027) | 0.551** (0.043) |
| Year = 1964 | –0.074 (0.606 | –0.092 (0.523) | 0.089 (0.566) | –0.054 (0.706) | –0.05 (0.727) |
| Year = 1968 | –0.165 (0.235) | –0.18 (0.197) | –0.154 (0.266) | –0.158 (0.253) | –0.175 (0.206) |
| Year = 1972 | –0.462*** (0.001) | –0.452*** (0.001) | –0.458*** (0.001) | –0.455*** (0.001) | –0.449*** (0.002) |
| Year = 1976 | –0.605*** (0.000) | –0.589*** (0.000) | –0.643*** (0.000) | –0.591*** (0.000) | –0.586*** (0.000) |
| Year = 1980 | –0.543*** (0.005 | –0.534*** (0.005) | –0.530*** (0.005) | –0.487*** (0.01) | –0.502*** (0.008) |
| Year = 1984 | –0.407** (0.016 | –0.371** (0.029) | –0.414** (0.014) | –0.390** (0.021) | –0.360** (0.033) |
| Year = 1988 | –0.858*** (0.000) | –0.875*** (0.000) | –0.892*** (0.000) | –0.851*** (0.000) | –0.877*** (0.000) |
| Year = 1992 | –0.782*** (0.000) | –0.795*** (0.000) | –0.815*** (0.000) | –0.773*** (0.000) | –0.798*** (0.000) |
| Year = 1996 | –0.898*** (0.000) | –0.858*** (0.000) | –0.898*** (0.000) | –0.878*** (0.000) | –0.843*** (0.000) |
| Year = 2000 | –0.966*** (0.000) | –0.924*** (0.000) | –0.964*** (0.000) | –0.948*** (0.000) | –0.911*** (0.000) |
| Year = 2004 | –1.005*** (0.000) | –1.026*** (0.000) | –1.034*** (0.000) | –0.975*** (0.000) | –1.013*** (0.000) |
| Year = 2008 | –1.150*** (0.000) | –1.167*** (0.000) | –1.141*** (0.000) | –1.113*** (0.000) | –1.141*** (0.000) |
| Year = 2012 | –1.171*** (0.000) | –1.125*** (0.000) | –1.142*** (0.000) | –1.124*** (0.000) | –1.095*** (0.000) |
| Year = 2016 | –1.214*** (0.000) | –1.238*** (0.000) | –1.257*** (0.000) | –1.222*** (0.000) | –1.254*** (0.000) |
| Constant | –7.763*** (0.000) | –7.631*** (0.000) | –7.383*** (0.000) | –7.653*** (0.000) | –7.490*** (0.000) |
| N | 1,302 | 1,302 | 1,302 | 1,302 | 1,302 |
| χ2 | 429.527 | 429.9388 | 436.678 | 432.9822 | 433.6463 |
Note. p-Values are in parentheses; 1960 is the reference year.
p < .1. **p < .05. ***p < .01.
Declaration of Conflicting Interests
The author(s) declared no potential conflicts of interest with respect to the research, authorship, and/or publication of this article.
Funding
The author(s) disclosed receipt of the following financial support for the research, authorship, and/or publication of this article: This work was supported by the research fund of Hanyang University (HY-2021).