
Abstract
For many years, academics have actively debated the connection between efficiency and fiscal decentralization. The impact of fiscal decentralization and other elements on sustainable economic development has been disregarded in a number of studies. Thus, the purpose of this study is to examine how fiscal decentralization affects China’s long-term economic growth from 2005 to 2016, taking into account a number of important control variables. We employ quarterly time series data and suitable econometrics methods (such as Bootstrapped Quantile Regression) for long-run relationships in order to examine the case of the Chinese economy. We also track changes in the variables over time, which is helpful for the empirical evidence. The long-term relationships between the selected variables are validated by the panel cointegration tests. Sustainable economic development is mostly influenced by fiscal decentralization. Using innovation as a control variable helps China’s economy grow. Moreover, the findings verify that financial risk, the interaction of fiscal decentralization and innovation, and the interactive term of fiscal decentralization and financial risk, all lead to a decline in China’s economic progress. These findings appear to have credible policy implications.
Key Insights
The study examines how fiscal decentralization affects China’s long-term economic growth from 2005 to 2016, taking into account several important control variables.
Sustainable economic development is mostly influenced by fiscal decentralization.
Using innovation as a control variable helps China’s economy grow.
Financial risk, the interaction of fiscal decentralization and innovation, and the interactive term of fiscal decentralization and financial risk all lead to a decline in China’s economic progress.
The findings validate the long-term relationships between the selected variables and provide credible policy implications.
The study highlights the importance of fiscal decentralization, innovation, and financial risk in shaping China’s sustainable economic development.
Introduction
Over the past few decades, decentralization has occurred in many economies, from the developed to the developing (T. T. T. Thanh et al., 2022; Wang et al., 2021). Patterns of fiscal decentralization may be one of the most important determinants of economic growth (Martinez-Vazquez & McNab, 2003). The authorities may redistribute national or regional revenues or expenditures based on fiscal decentralization. Decentralization is based on the degree to which local governments are able, without interference from the federal government, to manage their constituents’ earnings and expenditures in light of unique regional circumstances (Martinez-Vazquez & McNab, 1997; Umar et al., 2021). Furthermore, institutional politics, economic and social considerations, and national history influence the extent to which fiscal decentralization is practiced in a given country. It follows that fiscal decentralization has been a worldwide trend for the past three decades (Tiron-Tudor et al., 2022; Tufail et al., 2021).
Expenditure decentralization is a crucial part of fiscal decentralization, as it allows local governments to take responsibility for essential services. These services include basic education and healthcare, national security, and waste disposal. In China, local administrations rely on decentralized spending and intergovernmental grants as primary revenue sources (Cheng et al., 2020). Rural local governments in developing nations, where agriculture is the only economic endeavor, sometimes lack the requisite revenue base to self-finance their given budget commitments (Ji et al., 2021; Karim et al., 2022). When a local government’s spending obligations exceed the local government’s ability to collect taxes, the government provide subsidies to local government to help in bridging the gap. China uses intergovernmental transfers to achieve horizontal fiscal decentralization or parity in the amount of money each province or municipality spends per person. Horizontal fiscal decentralization may harm economic growth since it is partly funded by taxes that distort economic activity (Jin & Rider, 2020; M. H. Shah et al., 2021). In addition, decentralization has a negative consequences on economic wellbeing because of the distortionary nature of the grants themselves.
Overview of China’s fiscal system
China is a centralized state with a unitary government composed of five tiers, the highest of which is the central government (A. Shah & Shen, 2006). China’s fiscal decentralization development has unfolded gradually. In 1978, as part of the market and budgetary reforms, authority over resources and decision-making was decentralized from the central government to local governments, state-owned businesses, private businesses, and individuals. Interestingly, China’s fiscal structure prioritizes local autonomy over provincial control. According to Zhang and Zou (1998), if power is split among too many municipalities, it will be difficult for them to take on regionally beneficial infrastructure projects. Slower economic development could result from insufficient funding for infrastructure initiatives that would positively impact the economy as a whole. Following China’s early fiscal reforms, unrestricted decentralization and negotiations among the main and local governments about retaining revenue cause a reduction in national revenues. China’s tax-sharing system revisions of 1994 attempted to resolve these concerns. The reforms have resulted in the federal government receiving the highest share of tax revenue. Low-return taxes, such as those on meat, are typically the responsibility of individual municipalities (Bansal & Kumar, 2021; Dorfleitner & Grebler, 2022; Hmaittane et al., 2019). The Chinese intergovernmental fiscal system is characterized by private and local borrowing, highly decentralized expenditures, and centralized revenues. Local governments in China are only allowed to borrow with the consent of the central government, yet practically all of them are nevertheless borrowing “off the books” (Jin & Rider, 2020). However, unrestrained expenditure done by the local authorities due to budgetary limitations could enhance short-term economic growth. These limitations may connect to economic instability, which eventually reduce the overall development (Umar et al., 2021).
Furthermore, extra-budgetary finance by local governments is an identified irregularity in China’s fiscal system. Extra-budgetary financing creates a parallel fiscal path that is legal and permitted within the legislative framework of China’s fiscal system. In the 1980s and 1990s, extra-budgeted funds expanded significantly, catching up to and surpassing budgetary amounts by 1991 (Yarovaya et al., 2021). Several policy changes have begun reducing the use of extra-budgetary amounts in favor of those items that are inside the budget (Shambaugh, 2017). The percentage of total spending that goes on items outside the budget fell to around 16% in 2005. Extra-budgetary revenues and off-budget funds have a positive relationship with local government revenues. Such arrangement can significantly affect regional differences in provincial spending per person in China (C.-H. Chen, 2004; Polívka & Dvořáková, 2023). This is because both funds are collected from the same tax base.
To the best of our knowledge, there is a lack of studies which have explored the impact of fiscal decentralization on China’s sustainable economic development experience. To address the said issue, we gathered the sample quarterly data from 2005-Q1 to 2016-Q4 and used various econometric techniques. Particularly, we use the Bootstrapped Quantile Regression (BSQREG) technique. Furthermore, we have incorporated the interaction terms of fiscal decentralization and innovation (FID × INV) and fiscal decentralization and financial risk (FID × FRK).
The remaining sections of this study is as follows. Section “Literature Review” discusses the recent literature. Section “Theoretical Framework and Model Specification” outlines the theoretical aspects and model specifications. Section “Econometric Methodology” describes the econometric methods. Section “Results” presents the results. Section “Discussion” elaborates discussion. Lastly, section “Conclusion” concludes and provide brief policy implications.
Literature Review
The term “decentralization” refers to the delegation of authority to regional or local governments, as defined by (Martinez-Vazquez & McNab, 2003). Moreover, the authors identified two distinct waves of fiscal decentralization theory. The first generation highlights the advantages of regional economic efficiency and resource allocation. According to Oates (1972), decentralizing of political-fiscal powers, along with being close to residents, individuals, and institutions, can lead to increased efficiency, better service delivery, and a more prosperous economy at regional and national levels. According to Tiebout (1956), decentralization of authority allows for a more precise matching of supply and demand for products and services. Based on these arguments, Morgan (2002) argued that a reduction in both economic and democratic deficits results from decentralization and political authority. The second generation looks to decentralization to further and sustain market growth (Martinez-Vazquez & McNab, 2003). Intergovernmental systems, as proposed by Weingast (1995) and Blejer and Ter-Minassian (2002), can motivate local governments to promote markets. This presupposes that decentralization can enhance efficiency and resource allocation and maintain the growth of markets, all of which are crucial to economic expansion. Prud'Homme (1995) challenged this view, claiming that a country’s level of development is more important to the success of decentralization and that countries on the transitional stage could have the lack of capacity and supplies to counter the newly formed enticements following decentralization. The findings of Kyriacou et al. (2017) are inline with the hypothesis that fiscal decentralization boosts the quality of governance which subsequently improves fiscal decentralization’s outcomes. According to Rodríguez-Pose and Muštra (2022), regions with multiple decentralized local governments that practice high-quality governance and are surrounded by other regions that practice the same encourage competitive learning processes. Even if the decentralization growth effect is still up for debate, S. D. Thanh and Canh (2020) research also provides confidence in the second-generation fiscal decentralization approach, which also places a premium on market maintenance and expansion as strong institutional frameworks (Jin & Rider, 2020).
Canavire-Bacarreza et al. (2020) pointed out that localized heterogeneity can be linked to aspirations for fiscal decentralization and autonomy which consequently decree preferences for diverse public service and public benefit. Intergovernmental to local levels transfers allow higher growth and lesser fiscal imbalances. In support of this view, Ganaie et al. (2018) argued that the structure of India’s public institutions makes centralized revenue collection more efficient in the case of taxes. Although decentralized spending is more effective, evidence suggests that spending decisions made locally produce better results.
Besides fiscal decentralization, innovation plays an important role in the economic development of countries (Ni et al., 2022). In the previous studies, using the model proposed by Romer (1986) and used GMM tool, Ulku (2004) investigated the connection between R&D, innovation, and growth among 30 OECD and non-OECD countries. The study analyzed data from 1981 to 1997 to examine the hypothesized relationship between R&D spending and innovation rates and the subsequent impact on GDP per capita. The findings show that innovations boost GDP per capita in both established and developing economies. The other major takeaway is that only advanced OECD countries can raise their innovation rate by spending on research and development and that OECD nations depend on one another for innovation security, with some nations relying on the expertise of others to guarantee their success. Additionally, innovations are produced endogenously within an economy and contribute to economic growth. Still, the assumption of fixed innovation yields is not sustained, suggesting that innovations only temporarily increase output and do not account for the economy’s seemingly endless expansion. Additionally, research on the relationship between innovation and economic growth has been done by Pessoa (2007), focusing on the influence that spending on research and development in the situations of Sweden and Ireland has had in this relationship. The findings did prove the relationship between R&D and growth. Innovation related policies should account for the growth process by considering variables other than R&D spending. In another study, Westmore (2013) used a panel model with data from 19 OECD nations from 1980 to 2008 to inquire about the connection between innovation and economic growth. The empirical findings show that tax incentives, governmental funding for R&D, and patent protection all work together to spur private-sector innovation. No causal relationship between these initiatives and overall productivity expansion has been established. Petrariu et al. (2013) used a panel model to examine the link between economic growth and innovation in the countries of Central and Eastern Europe. According to their research, the primary factor in an economy’s readiness to innovate is the amount of money it spends on R&D.
Economic development is also vulnerable to financial risk. To begin, financial risk may have a negative effect on growth. Financing constraints are connected with sluggish economic conditions (Galor & Zeira, 1993; Sehrawat & Giri, 2018; P. Su et al., 2023), and the literature has also exposed that financial risk can also makes it worse to get financing, which subsequently hinders growth. By utilizing the data from African countries, Ibrahim and Alagidede (2018) conducted empirical research and found that the correlation between economic growth and financial development is nonlinear. There is a strong correlation between financial growth and economic expansion, but financial markets are insensitive to economic expansion below a certain estimated threshold. Indirectly, financial risk can impact economic growth through its impact on the use of renewable energy sources (Akbar et al., 2020). For instance, a steadily improving financial development system results from lowered risk associated with finance and make access to loan easy. This boosts investments in renewable energy and encourages the implementation of green technologies (Z. Chen et al., 2022; Liang et al., 2022; Yousaf et al., 2022), making it easier to obtain investment opportunities and encouraging entrepreneurship (Berger, 2022; Ferrat et al., 2022; Gao et al., 2021; Ielasi et al., 2018; Klapper et al., 2006; Munemo, 2017).
The concept of sustainable development is becoming one of the most important notions, particularly in modern economic literature, where it is necessary to find a balance between economic growth, social interaction, and environmental protection. To evaluate the progress of said factors, the United Nations has built a framework known as “Sustainable Development Goals (SDGs).” According to the research, fiscal policies, institutional quality, and effective governance are some of the key elements to attaining SDGs (Khan et al., 2023; Ozili, 2024). On the one perspectives, fiscal decentralization can help to strengthen the distribution of resources. Similarly, from the other perspective, the structural development of fiscal decentralization can promote sustainability. Researchers have also emphasized that fiscal instruments, e.g., green taxes, environmental funds, etc., play an important part in the integration of sustainability goals as suggested by SDGs (R. Liu et al., 2022). Therefore, it is worth studying fiscal decentralization as a strategic tool to foster growth and protect the institutional environment, which eventually advances sustainable development.
Theoretical Framework and Model Specification
The race to the top strategy is bolstered by the possibility that fiscal decentralization may enhance economic development by increasing economic efficiency. According to Oates (1972), local governments are better prepared to deal with economic challenges and are held more accountable to the public when fiscal decentralization is in place. Economic growth and fiscal decentralization are backed by four arguments. To start with, there’s the diversification hypothesis, which argues that it’s useless to provide the same amount of public goods to every state and city in the country since it ignores people’s individual preferences (Agarwal, 2019). Another point is that decentralized governments are always looking for new ways to innovate in order to minimize costs and enhance product quality. This helps to increase economic growth and producer efficiency. Third, decentralization changes who is responsible for what according to the productivity enhancement hypothesis (Amagoh & Amin, 2012). With these incentives in place, local governments are more likely to consider citizen priorities and come up with innovative solutions. Decentralized political system fosters democratic ideals, which in turn enhance progress and long-term economic prosperity. This is the final political justification (Thieben, 2005).
On the other hand, fiscal decentralization may impair local economic progress, which favors a race-to-the-bottom approach and has three sets of reasoning against high decentralization (Thieben, 2005). First, fiscal decentralization exacerbates regional imbalances since poorer regions can only afford to create a smaller amount of public goods using their resources, whereas wealthier regions can produce a larger amount using greater incomes (Z. Liu et al., 2018; Umar et al., 2021). Regional inequality can hinder economic growth. Second, due to their greater impact than at the federal level, fiscal decentralization makes it simple for interested groups to influence local government decision-making (Thieben, 2005). Third, decentralization can impair long-term economic growth since it is harder for the centralized government to stabilize (Bardhan & Mookherjee, 2000). The following Model 1 tests the decentralization of sustainable economic development, which is given below:

GDP represents sustainable economic development; FID indicates fiscal decentralization; FRI denotes financial risk, and INV represents Innovation. In this study, sustainable economic development is proxied by gross domestic product (GDP), which represents the economic dimension of sustainability. The choice of GDP as a proxy is primarily based on its wide availability, reliability, and consistent quarterly data coverage for China during the study period (2005–2016). Although GDP mainly reflects economic performance and does not fully capture the environmental and social dimensions of sustainability, it remains a widely used indicator in empirical research examining long-term economic growth and development. Due to the lack of comprehensive quarterly data on environmental and social indicators, GDP serves as the most suitable measure for the purpose of this analysis.
In addition, this study challenges the conventional time series methodology by incorporating the interactive variable of fiscal decentralization and innovation (INV) into a empirical model and investigates the effect of fiscal decentralization on sustainable economic development. The Model 1 is extended to Model 2, which is given below:

Moreover, to check the effect of fiscal decentralization in the presence of another interaction term, the combination of fiscal decentralization and financial risk is used. We hypothesized that the link among fiscal decentralization and financial risk is weakening with the high financial risk in a country. Simply put, the race to bottom tactic relies on a country’s financial improvement. A nation’s ability to meet its financial commitments, whether domestic, foreign, or international, is a key indicator of its financial risk. The financial risk index is obtained from the PRS Group’s International Country Risk Guide (ICRG), which uses a 0 to 100 scale, where a higher score indicates lower financial risk. The index comprises several subcomponents, including foreign debt as a percentage of GDP, foreign debt service as a percentage of exports of goods and services, current account balance as a percentage of exports, and international liquidity (months of import cover). In conclusion, a more stable financial system means a more productive economy that can more easily service its debt. In addition, countries with stable exchange rates are more likely to attract international investment since they pose less financial risk. So, including the FID, we designed Model 3 in the following way:

Notably, by allowing local governments more autonomy over their budgets and making smarter decisions about how to allocate resources, fiscal decentralization could spark a race to top that dramatically boosts economic development that can be sustained over time. So, FID should have a beneficial effect on GDP. Instead, fiscal decentralization encompasses both revenue and expenditure, making it a complete system. This research quantifies fiscal decentralization via index derived from the government expenditures and revenues. It measures how much of the government goes toward specific expenses in the budget and how much goes toward general revenues. This index is calculated using PCA using the aforementioned indicators. All the variables are standardized to ensure comparability. Moreover, the PCA extracted orthogonal components, and the first principal component, which captured the largest proportion of total variance, is selected to represent the fiscal decentralization index. Lastly, component loadings are derived to show the the principal component, and weights are calculated based on these loadings to construct the index. The corresponding loading scores are presented in Table 1 for reference and transparency.
Principal Component Loadings.

Source. Own.
The details of other variables are presented in Table 2.
Variables and data sources.

Source. Own.
Econometric Methodology
ADF Stationarity Test
To ensure the consistency of the data, we apply stationarity as a transformational tool. Not being stationary prevents using a variable in modeling and forecasting where such phenomena as trends, random walks, and cycles are present. Non-stationary data analysis might produce inaccurate estimates by implying a relationship between variables where none exists. More reliable and precise estimates can be obtained by transforming data into stationary. The unit root test of the ADF has been implemented. Moreover, we apply the Schwartz Information Criterion (SIC) in the analysis. By using the ADF test, we may determine whether or not a series is stationary by comparing it to two alternative hypotheses: (H0) non-stationary, and (H1) stationary. The ADF test relies on the following regression equation:

Cointegration Test
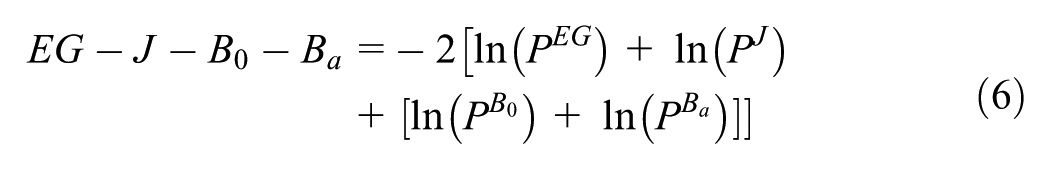
We incorporate Bayer and Hanck approach for cointegration test (Bayer & Hanck, 2013) to check if two variables in a model are truly cointegrated. One of its main advantages over other cointegration methods is that it can efficiently produce results for time series with different integration orders. Because it can draw on several different cointegration methods, the test is superior to alternative methods. This examination was created by drawing on the methods of the Johansen (J), Engle–Granger (EG), Boswijk (Bo), and Banerjee (Ba) exams. All of the variables must be in a stationary state before the BH test can be used. The equation for the BH test can be written as follows:

Quantile Regression
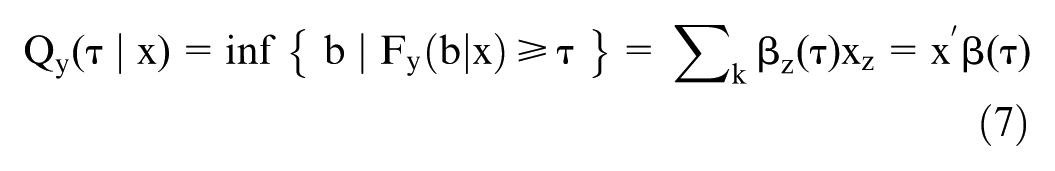
Quantile regression is a variant of regression that focuses on the association between a certain quantile of the dependent variable and an explanatory variable or factors. One of the primary goals of normal regression is to represent the mean of a continuous response variable as a linear function of one or more explanatory variables. Quantile regression can be used as an alternate for least-squares modeling. The following expression elaborates the conditional quantile regression function of Y, where Y is the dependent variable (GDP), and X is the set of all possible explanatory variables (FID, FRK, INV, FIDI, and FIDF).
The conditional distribution function

Results
This section presents the empirical results and explanation of the econometric methods used. Table 3 displays the descriptive statistics. The complete range of values is shown by the obtained estimations. Also, they saw a distinct gap between the numbers in each range, which they interpreted as an indication of an unusual pattern of observations. Variables’ (GDP, FID, INV, FRK, FID × INV, and FID × FRK) behavior across the given time frame is also confirmed by this study’s evaluation of standard deviation significance. The effects of skewness and kurtosis, two indicators of non-normal distribution, on the study are also examined. Data normalcy is of paramount importance in this study, hence the Jarque and Bera (1987) normalcy test was used. The calculated statistics are higher than the crucial values at the1%, 5%, and 10% levels, as shown in the findings. It follows that the relevant variables’ non-linearity properties must be correct, and the null hypothesis must be rejected.
Descriptive Statistics.

Source. Own.
We use the ADF tests for unit root to avoid this problem since it is well-known that most time series data contains a unit root. Table 4 shows the level and first-differenced test results for all variables. The findings demonstrate that there is a unit root at the level for all four variables. At 10%, 5%, and 1%, every variable—FID, FIDFRK, FIDINV, FRK, GDP, and INV—becomes stationary when we take the initial difference into account. Once we verified that this condition was satisfied, we applied the cointegration method to the data.
Unit Root Test.
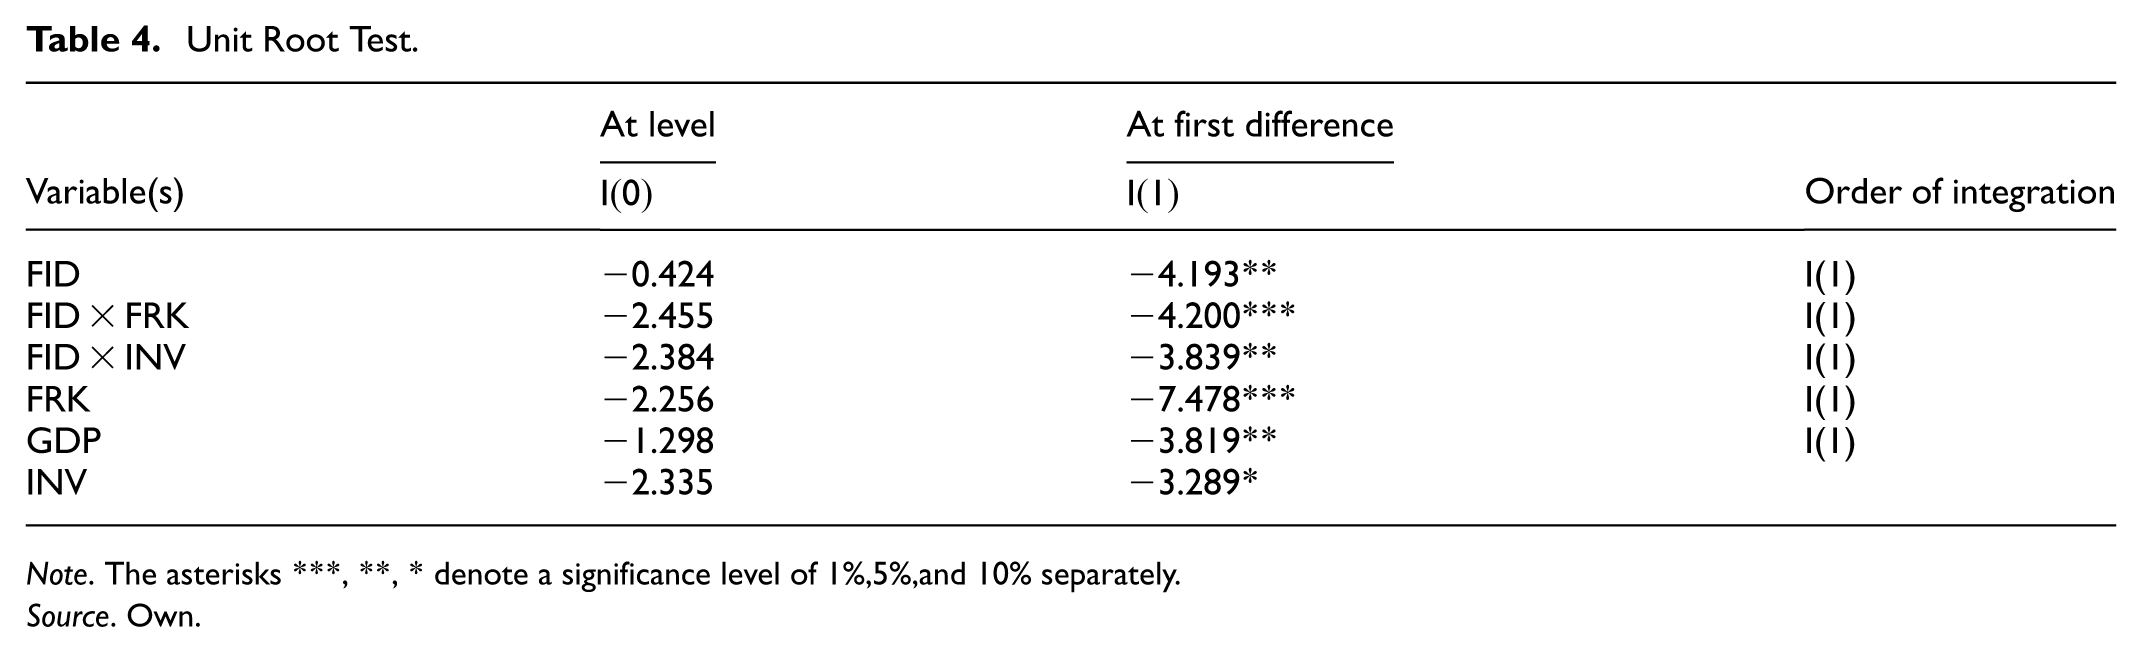
Note. The asterisks ***, **, * denote a significance level of 1%,5%,and 10% separately.
Source. Own.
Tackling the issue of unit root, we further proceeded with our analysis and applied the most suitable econometric technique for cointegration called Bayer–Hank cointegration. Table 5 provides the long-run cointegration association among sustainable economic development, fiscal decentralization, financial risk, and Innovation, the interaction term of FD and Innovation, and the interaction term of fiscal decentralization and FRK. The Bayer–Hank cointegration confirmed for all the three models a long-run cointegrating relationship between the targeted variables in the china case.
Bayer–Hanck (2013) Cointegration Test.
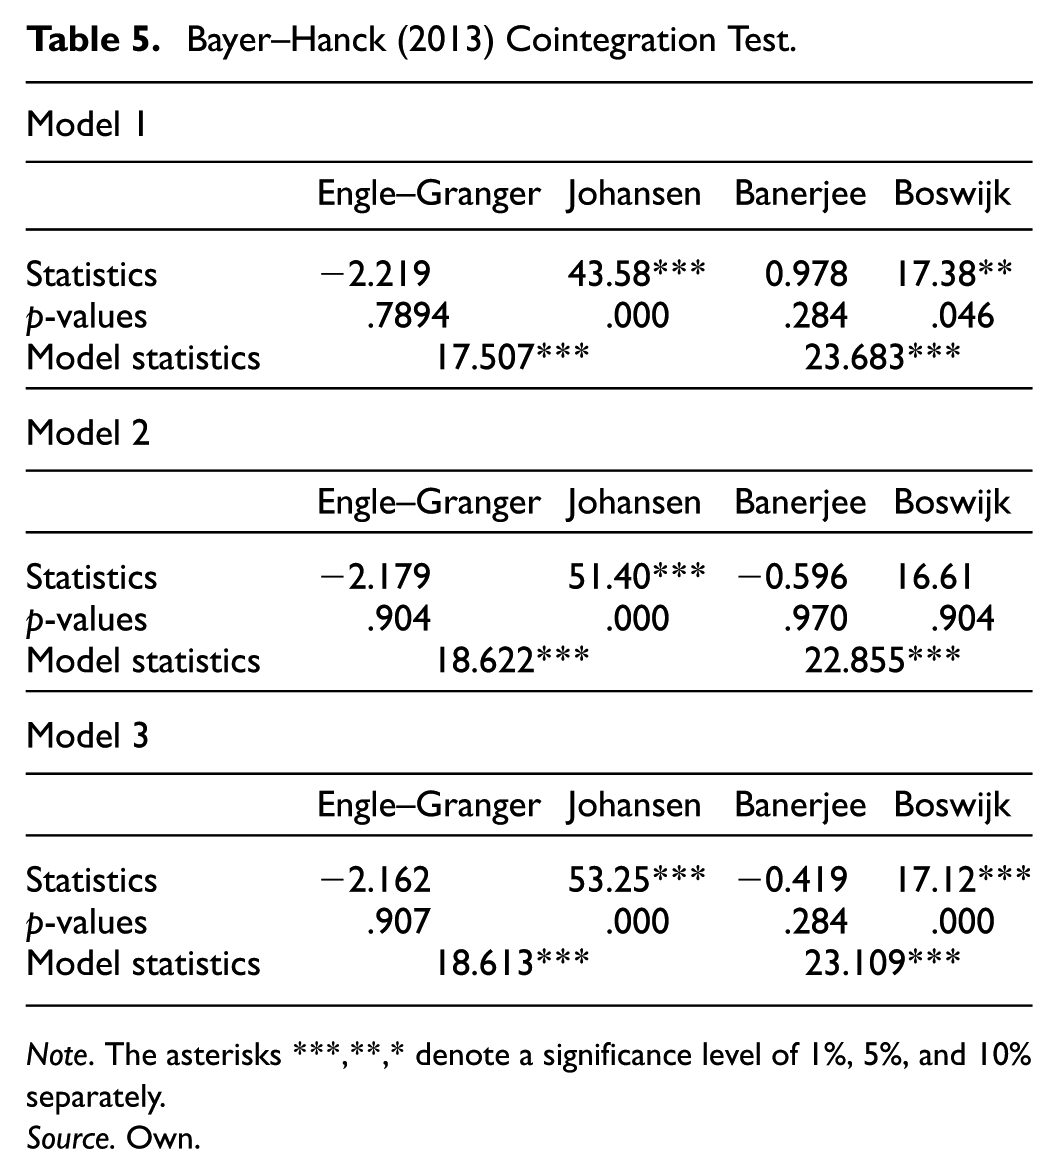
Note. The asterisks ***,**,* denote a significance level of 1%, 5%, and 10% separately.
Source. Own.
We use an advanced and suitable methodology called Bootstrapped Quantile Regression (BSQREG) after we prove the long-run Cointegration between the variables. When it comes to processing non-linear, irregular data and providing statistical estimates at a specified quantile, this technique is better to others. The rationale to apply the BSQREG method lies in its ability to analyze the heterogeneous relationships between different points, not merely focusing on the mean values. It is widely applied, particularly in the field of financial development and environmental performance, because data used in the said field are usually nonlinear/outliers in nature. Crucially, the BSQREG technique is best suited to the current study, as it spins around fiscal decentralization and institutional quality.
The expected results of the approaches that were discussed are shown in Table 6. All three of the selected models show that FID significantly improves GDP concentrations, according to the collected data. Empirical research shows that GDP is significantly affected by each quantile of FID. In particular, the FID improves GDP for all quantiles (Q0.25, Q0.50, Q0.75, and Q0.90) displayed in Models 1, 2, and 3. Fiscal decentralization raises GDP by 0.248%, 0.518%, 0.719%, and 0.719% at the 25th, 50th, and 75th quantiles of the distribution, respectively, according to Model 1. Moreover, the 25th, 50th, 75th, and 90th quantiles all exhibit increases of 0.223%, 0.489%, 0.657%, and 0.575%, respectively, for every 1% increase in FID in Model 2. There is a 0.216% rise at the 25th quantile, 0.516% increase at the 50th quantile, 0.632% increase at the 75th quantile, and 0.668% increase at the 90th quantile in Model 3. It is well-known that China endorses fiscal decentralization, and the country’s achievements in this area are quite outstanding. Provinces and municipalities in China now have more spending freedom thanks to fiscal autonomy. By luring in large-scale, locally-based investments, fiscal decentralization boosts China’s economic growth. These investments in local markets not only meet a need in the labor market, but they also entice business communities. Furthermore, research has demonstrated that fiscal decentralization helps the Chinese economy thrive by making regional resource distribution more efficient. The long-term health of the economy will be positively impacted by fiscal decentralization if it leads to better infrastructure investment or more efficient allocation of resources, say, more funding for industries with high productivity and less for those with poor productivity. Other studies (Szarowská, 2022; S. D. Thanh & Canh, 2020) came to similar conclusions.
Bootstrapped Quantile Regression: BSQREG Results.

Source. Own.
In the case of financial risk, it is found that all three models have a negative and statistically significant link with sustainable economic development across all the quantiles. The first model shows that the 25th, 50th, 75th, and 90th quantiles will see a reduction of 0.482%, 0.009%, 0.010%, and 0.013% in response to a 1% rise in financial risk, respectively. The second model shows that the 25th, 50th, 75th, and 90th quantiles will all see a decline of 0.009%, 0.009%, 0.015%, and 0.020% as a result of a 1% increase in FRK, respectively. Lastly, in Model 3, the 25th, 50th, 75th, and 90th quantiles all show the same decline, with values of 0.009%, 0.009%, 0.015%, and 0.020%, respectively. This finding makes sense given the various forms that heightened financial risk can take, such as bank failures, asset price volatility, and a reduction in market liquidity (Lobato et al., 2021). When a country’s payment and settlement system is disrupted to this extent, it can have a domino effect on the economy as a whole. As a result of their interdependence, the financial system also has an impact on the real economy’s substantial monetary risk. It has the potential to impose high macroeconomic costs due to the potential impact on production, consumption, and investment, which could impede macroeconomic goals like growth and development. Similar findings were found by F. Chen et al. (2021), Naqvi et al. (2021), and Rizvi et al. (2022).
A positive and statistically significant association is seen across all three models for innovation and sustainable economic development. According to Model 1 (Figure 1), the 25th, 50th, 75th, and 90th quantiles of GDP increase by 0.005%, 0.482%, and 0.481%, respectively, for every 1% increase in Innovation. An additional finding from Model 2 is that for every 1% rise in INV, the 25th, 50th, 75th, and 90th quantiles all see increases of 0.051%, 0.492%, 0.439%, and 0.387%, respectively. Model 3 also shows a comparable improvement, with quantile values of 0.493%, 0.482%, 0.442%, and 0.406%, respectively, at the 25th, 50th, 75th, and 90th quantiles. This finding lends credence to the argument that innovation is key to China’s long-term economic growth. In 2015, the National Science and Technology Conference aimed to encourage the scientific and technological community by bolstering their capacity for independent Innovation. Because of technological advancement, the industrial structure of China, an important player in the global economy, has been shifting, creating new employment opportunities (Ielasi et al., 2018; Jiang et al., 2023; Mello et al., 2019). For instance, the “WeChat Employment Impact Report” provides empirical proof that the company’s public platforms, mini-programs, corporate, and payments have resulted in new positions in software engineering, product management, digital content creation, and business administration. More than 2 million new employment have been produced annually by WeChat since 2014. A “National Emerging Industry Venture Capital Guidance Fund” worth 40 billion Yuan has also been established by the State Council to promote entrepreneurship and Innovation and stabilize the labor market. So, against the backdrop of the new normal, Innovation has also given rise to new prospects and a straight path for economic development. Similar results were found by C.-W. Su et al. (2022).
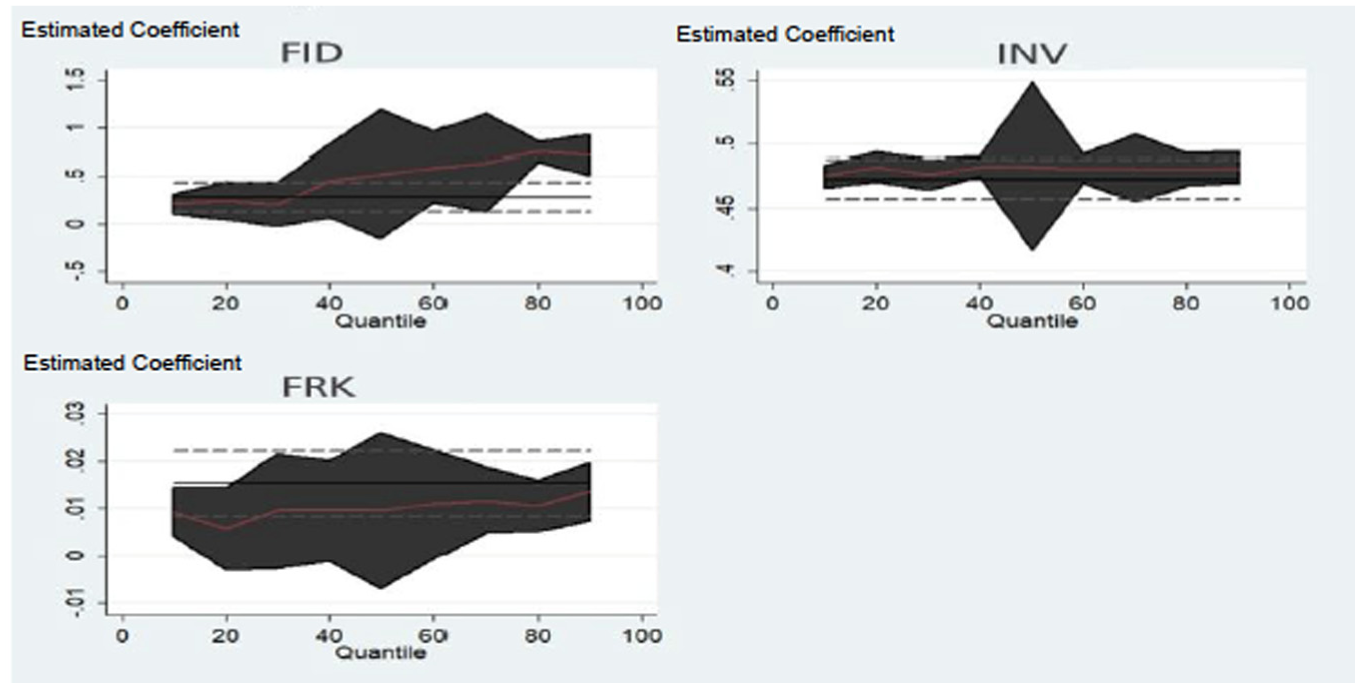
Graphical presentation of BSQREG (Model 1).
Additionally, for Model 2 (Figure 2), we have included the word for innovation and fiscal decentralization that interacts. Sustainable economic development drops −0.014% at the 25th quantile and −0.005% at the 50th quantile for every 1% increase in FID × INV. Interestingly, when looking at the opposite side of the coin for the same model, we see that the 50th and 90th quantiles of GDP will increase by 0.023% and 0.047%, respectively, in response to a 1% increase in FID × INV. During China’s ta initial stage of fiscal decentralization, mismanagement was common. As a result of this phenomenon, the race to the bottom strategy is harmful to the environment and wasteful of local resources (M. H. Shah et al., 2021). At the same time, the local public of the economy, especially in rural China, is not accepting of introducing new technology. This is because integrating novel technologies calls for high-level methods, human resources, and expertise. However, eventually, the local government learns how to use the local fiscal expenditure, and it accepts the race to the top approach. With such a phenomenon, it welcomes new technology. After that point, the country’s economic growth accelerates dramatically.
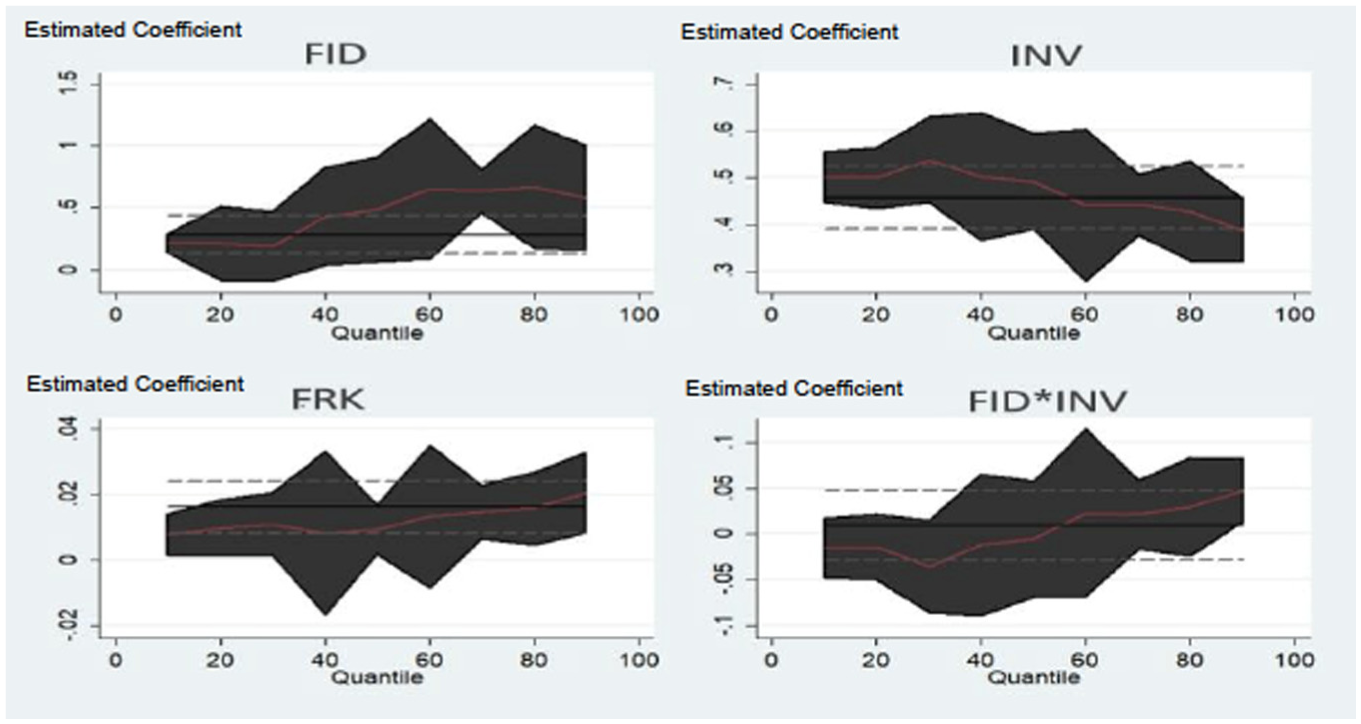
Graphical presentation of BSQREG (Model 2).
The last variable, the interactive term of FID and financial risk (FID × FRK), significantly negatively affects GDP. It is observed in Model 3 (Figure 3) that a 1% increase in FID × FRK will reduce −0.001%, −0.000%, −0.003%, and −0.007% sustainable economic development in the 25th, 50th, 75th, and 90th quantiles. If fiscal decentralization has a negative impact on economic growth, a “race to the bottom” approach may be implemented in response to an increase in a country’s financial risk profile. This conclusion is likely influenced by China’s contentious history between its central and local governments, inefficient use of resources at the local level, and the resulting financial risks. It is reasonable to suppose that lingering financial tensions will have a chilling effect on China’s fiscal decentralization initiative’s ability to slow the country’s economic development. Similar results have been reported by Xia et al. (2022).

Graphical presentation of BSQREG (Model 3).
Even though the estimation results of the BSQREG technique are effective in dealing with nonlinear data, this research used quantile regression to verify the empirical findings of the prior estimate to check for robustness. The selection of quantile regression for a robust check is based on several reasons. Firstly, both bootstrapped quantile regression and quantile regression share a common framework that allows estimating the relationships across different points (quantiles), thus capturing the heterogeneous effects that mean-based models such as ARDL, FMOLS, and DOLS can overlook. Secondly, quantile regression even provides robustness against outliers and non-normal error distributions, therefore making it more suitable for statistical data characterized by volatility and skewness. Lastly, unlike ARDL, FMOLS, and DOLS, which are focused primarily on average effects, quantile regression ensures that the results are consistent across the entire distribution of the dependent variable and thus strengthens the validity of our findings. Tables 7 individually show the projected outcomes for the estimators above. This research noticed the impact of FID on the GDP and other control variables of china in the estimated results of the robustness tests.
Quantile Regression (Robustness Test).

Source. Own.
Discussion
The empirical outcomes confirmed that FID and INV significantly positively affect GDP. While FRK, FIDI, and FIDF have been found to have a negative relationship with the sustainable economic development of the China economy. This is statistically significant at the 10%, 5%, and 1% levels. So, the robustness test results support the BSQREG approach’s empirical findings.
The interaction term between fiscal decentralization and innovation (FID × INV) has shown different signs across the quantiles and therefore demonstrates that the impact on sustainable economic development varies across the GDP distribution. The correlation between the two is negative at lower quantiles, which indicates that the local governments might not have been efficient in their administration and prepared to apply technological skills to efficiently use fiscal resources in supporting innovation-based growth at the early levels. Nonetheless, the positive correlation at higher quantiles suggests that, as time goes by, the enhanced fiscal management, greater coordination of fiscal and innovation policies, and enhanced technological advantages of various regions have enabled local governments to allocate their resources more effectively. These findings suggest that the success of fiscal decentralization in stimulating growth based on innovation is relative to the maturity of local institutions and the capacity to execute innovation policies successfully.
According to the empirical findings, fiscal decentralization helps to promote sustainable economic growth when it is combined with a high level of innovative capacity, which can be described as a race to the top, whereby local governments compete to enhance their efficiency, stimulate innovation, and bring productive investment. On the other hand, fiscal decentralization in combination with the high financial risk will cause the deterioration of the economic progress, which will be a race to the bottom. Local governments in these situations can put short-term revenue creation or hazardous financial conduct over long-run growth goals. These results have shown that although fiscal decentralization can also develop healthy interregional competition and growth driven by innovation, effective financial governance and risk management are all that is needed to avoid downward competition that diminishes sustainability over the long term.
Conclusion
This study contributes to the current body of knowledge by examining the effect of fiscal decentralization on sustainable economic development while accounting for significant control variables that have been overlooked in earlier studies. We investigate the long-run influence that fiscal decentralization has had on China’s economic development from 2005-Q1 to 2016-Q4 using the most relevant and up-to-date econometric methodologies, together with Bootstrapped Quantile Regression (BSQREG). The findings show that foreign direct investment and innovation benefit economic growth. However, financial risk is detrimental to economic progress. In addition, the negative effect and slowing of economic development for the chosen China country are validated by the interaction term of fiscal decentralization with innovation and fiscal decentralization and financial risk.
Policy Recommendations
The policymakers should prioritize a more harmonious fit between decentralized expenditure and revenue to maximize the decentralization’s effect on the economy. Considering the institutional capability of local governments and the level of economic development, it is crucial to identify an ideal configuration of decentralization measures related to revenue/expenditures. In addition, it is important to identify the characteristics of the decentralized revenues that will be used to fund the local expenditures. Throughout China, tax policy closely tracked local government spending and mirrored citizen preferences. Some Chinese regions, however, exhibit only a weak link between the aforementioned metrics. Financial and political independence for municipalities is proposed to boost social and economic development and the standard of public services. In addition, our research highlighted the significance of increased financial sustainability—achievable through fiscal rule adjustments, improved debt management frameworks, and well-targeted intergovernmental transfers – in driving economic development. Moreover, fostering innovation at the local-level requires concrete policy actions such as tax incentives for innovative enterprises, the establishment of local innovation funds, and capacity-building programs for local administrations to strengthen their governance and capabilities to implementation project.
Limitations and Future Guidelines
Finally, this study is not free from limitations, and based on them, we propose some future recommendations. The most recent data was initially intended to be what we included in this study. However, due to data restraints, we instead cover 2005-Q1 through 2016-Q4. Also, it would be wise to consider carrying out future research that considers one of the most recent changes, such as the COVID-19 economic crisis. Because we concentrated mostly on China, a panel of other countries should be emphasized in the future. The findings of this study can be applied to future gatherings of nations with similar demographics, including Brazil, Russia, India, and others.
Footnotes
Ethical Considerations
Ethical approval was not required for this study as it is based exclusively on secondary firm-level data that is publicly available and does not involve human participants or any sensitive personal information.
Consent to Participate
This study did not involve human subjects; therefore, informed consent was not required.
Consent for Publication
This study does not include any individual person’s data in any form (including individual details, images, or videos); therefore, consent for publication is not required.
Funding
The authors disclosed receipt of the following financial support for the research, authorship, and/or publication of this article: The open access of this research was funded by Excellence Project 2025 at the Faculty of Informatics and Management, University of Hradec Kralove, Czechia.
Declaration of Conflicting Interests
The authors declared no potential conflicts of interest with respect to the research, authorship, and/or publication of this article.
Data Availability Statement
The datasets generated during and/or analysed during the current study are available at the websites of IMF (https://www.imf.org/en/Data), World Bank (https://data.worldbank.org/), and PRS Group (![]() ).
).