
Abstract
The energy crisis, resource depletion, competition, and waste reduction challenges have pushed organizations to embrace sustainable practices. Green Lean Six Sigma adoption (GLSA) is crucial for sustainability. However, various factors impact GLSA, including driving forces (DFs), barriers, and enablers. This study aims to analyze and model how these factors affect GLSA by collecting data from 207 respondents and using Partial Least Square Structural Equation Modeling (PLS-SEM). The findings reveal that government-related barriers have a significant negative impact on GLSA. In contrast, industry, cost, and energy-related DFs, government policies/legislation, and capability/capacity-related enablers have a positive effect. Based on the findings, an adoption strategy for Green Lean Six Sigma is proposed. These insights are valuable for managers and policymakers struggling to promote GLS in the construction industry. This study contributes to the GLS literature by analyzing the quantitative influence of barriers, DFs, and enablers on GLSA and suggesting an adoption strategy. This study highlights the need for targeted government policies and industry initiatives to overcome barriers and leverage enablers for successful GLSA implementation in construction projects, thereby enhancing sustainability and operational efficiency.
Introduction
The construction industry is characterized by its dynamic and multifaceted nature, encompassing various activities from residential buildings to large-scale infrastructure projects (Boadu et al., 2020). This sector requires extensive coordination among various stakeholders, including architects, engineers, contractors, and laborers (Abidin et al., 2013). It is heavily influenced by economic conditions, regulatory frameworks, and technological advancements (Q. Chen et al., 2021). Additionally, the construction industry is known for its cyclical nature, with periods of high demand often followed by downturns, and it places a strong emphasis on safety, sustainability, and efficiency in project execution (Yan & Chen, 2022). The construction sector is attributed to large-scale carbon footprints, waste, environmental degradation, and intensive resource utilization. Globally, 40% of energy-related emissions are attributed to the construction industry S. Chen et al. (2023). In addition, 32% of nonrenewable and renewable resources, 40% of raw materials, and 40% of all solid waste are linked with the construction industry (Guan et al., 2020). According to the UN Environment Program (2023), “The buildings and construction sector is by far the largest emitter of greenhouse gases, accounting for 37% of global emissions”. The carbon emission of the construction sector of developing countries is higher than developed countries (Oke et al., 2024). Pakistan is a developing economy with the fifth most populous country globally. It has plenty of natural resources, which are under stress due to the growing population, housing and infrastructure needs, and lack of policies for planning and development. The industry contributes 20% of Pakistan’s GDP, 12% of which comes from the construction sector (Iqbal et al., 2021). Executing One Belt One Road (OBOR) has elevated the significance of the construction industry. Million dollars are already invested in the infrastructure needs of the China-Pakistan Economic Corridor (CPEC). These investments that support GDP also pose environmental threats. Pakistan is the 135th largest greenhouse gas (GHG) producing country (Iqbal et al., 2021). Pakistan ranks among the world’s most affected countries by climate-related extreme weather events, placing fifth in the Global Climate Risk Index 2020 (Eckstein et al., 2019) and faces multiple environmental challenges due to unsustainable construction practices (Iqbal et al., 2021). Construction firms are integrating different methods to address sustainability concerns. Green, Lean, Six Sigma (GLS) has the potential to address the issues of productivity, waste generation and sustainability (Farrukh et al., 2023).
Green, Lean, and Six Sigma are crucial to enhancing the construction sector’s sustainability (Banawi & Bilec, 2014). The integrated GLS adoption (GLSA) has recently attracted the attention of researchers and the industry (Mohan et al., 2025). Green construction defines, designs, and uses processes and environmentally friendly materials in contrast to conventional approaches that are solely profit-oriented (Sartori et al., 2021). The externalities of construction and demolition waste recycling, energy consumption, material production, and GHG emissions on the environment and society are managed throughout the Lifecycle from design, construction, operation, maintenance, renovation, to demolition (Medineckienė et al., 2010; Simion et al., 2013; Užšilaitytė & Martinaitis, 2010).
Lean Six Sigma (LSS) reduces waste and defects, enhancing organizational performance (Ishak et al., 2020). Previous research on combining Green and LSS reveals that many industries incorporate green practices to boost their environmental sustainability efforts (Cherrafi, Elfezazi, Govindan, et al., 2017; Rathi et al., 2023; V. Yadav et al., 2023). Despite earlier findings suggesting that Lean is a fundamental pillar for sustainability (Ali et al., 2021), practical applications of LSS reveal a deficiency in fully mitigating the adverse environmental impacts associated with operations (Rathi et al., 2023). To address this limitation, the integration of Green technology has proven effective, giving rise to a novel approach to sustainable development known as GLS (Cherrafi, Elfezazi, Govindan, et al., 2017). However, GLS adoption (GLSA) is a complicated and challenging objective (Thomas & Khanduja, 2022). Studies signify that approximately 40% of the GLS projects fail (Rathi, Kaswan et al., 2022). GLSA is more sluggish in developing economies than in developed countries (Kumar et al., 2016). Countries have different political, economic, and environmental conditions, building life cycles, rules and regulations, and construction infrastructure, influencing GLSA (Hussain et al., 2023). These factors indicate that GLSA cannot be identical in all regions, countries, or industries, and it is a prerequisite to analyze how GLSA can be promoted in a specific industry or country (Rathi, Singh et al., 2022; Thomas & Khanduja, 2022; V. Yadav et al., 2024).
Pakistan’s construction practitioners struggle to adopt GLS concepts to deliver eco-friendly, energy-efficient, and quality products (Hussain et al., 2019). Various factors, for example, strategies, critical success factors (CSF), enablers, driving forces, and barriers, impact GLSA (Kaswan & Rathi, 2019; Kumar et al., 2016; Mishra, 2022; Pandey et al., 2018). Analyzing these factors and how they regress GLSA is inevitable for the advancement of GLSA.
Plenty of research pays attention to barriers (Mohan et al., 2024; Thomas & Khanduja, 2022), drivers (Hussain et al., 2022), and enablers (Kaswan & Rathi, 2020; Pandey et al., 2018) of GLS. Most of the studies earlier are conducted in the manufacturing industry. The importance of these studies cannot be undermined, but a gap needs to be filled to empirically examine the impacts of driving forces (DFs), barriers and enablers on GLSA in the construction industry. Investigating these factors impact on GLSA can play an unerring role in developing a strategy to promote GLSA in the construction industry (Hussain et al., 2019; Hussain, He, Ahmad, Iqbal, & Nazneen, 2023; Hussain et al., 2022).
However, little is known about the impacts of DFs, barriers, and enablers on GLSA. The detailed investigation of DFs, enablers, and barriers will facilitate policymakers and construction managers to decide which DFs, enablers, and barriers are critical and significantly correlated with GLSA. For instance, Toktaş-Palut et al. (2014) evaluated the effects of barriers (negative) and benefits (positive) of e-procurement on its adoption decision. Darko et al. (2018) analyzed the quantitative impacts of strategies, DFs, and constraints on the adoption of green building technologies and found that government-associated constraints have a significant negative impact on green building technologies adoption (GBTA); company-associated motivating factors have a significant positive effect on GBTA; and promotional strategies “government regulations and standards” and “incentives and R&D support” have significant positive effect on GBTA. In short, the study highlighted the role of government in the promotion of GBTA.
In addition, although structural equation modeling (SEM) is widely used in different fields, its application in integrated GLSA is rare. In particular, this kind of study is unavailable from Pakistan’s Perspective. Studies earlier employed qualitative approaches to examine the interrelationships between GLS barriers (Hussain et al., 2019; Kumar et al., 2016; Thomas & Khanduja, 2022), enablers (Hussain et al., 2023; Kaswan & Rathi, 2019) or drivers (Hariyani & Mishra, 2022; Hussain et al., 2022) using qualitative approaches. Hussain et al. (2019 and 2023) suggested that future studies be carried out using SEM to empirically examine the effect of these factors on GLSA in the construction industry. Durdyev, Ismail et al. (2018) emphasize that to promote sustainable construction practices, barriers and drivers should be identified and analyzed to facilitate stakeholders to mitigate barriers and promote drivers for sustainable construction practices adoption.
Based on the above discussion, the objectives of the study are as follows:
To determine the influence of barriers, DFs and enablers on GLSA in the construction sector using PLS-SEM.
To develop a scheme to promote GLSA based on study findings
The study contributions are twofold: First, the outcomes of this study shed light on the categories of barriers and enablers that can facilitate industry professionals, researchers, companies other stakeholders with clarity of their role to participate and establish better policies to encourage GLSA. Second, the findings on DFs persuade the firms and governments toward GLSA. Similarly, the present research findings may assist companies, environmentalists, and GLS experts in favor of executing and promoting GLS by providing them preliminary information on basic building blocks for and obstacles to GLSA. The present study is unique, stimulating firms to switch from conventional practices toward competitive, cost-effective, customer-focused, and sustainable methods, for example, GLS. Theoretically, this study adds to GLS and construction management literature by presenting a framework that elucidates how different factors influence GLSA using a quantitative methodology, specifically from the perspective of the construction sector of a developing economy. In addition, an adoption scheme based on study findings is furnished to assist policymakers and practitioners.
Research Framework and Hypotheses Establishment
Research Framework
The research framework helps update existing knowledge. Prior studies in related sustainability domains have typically examined drivers, enablers, or barriers separately, and none has developed an integrated framework specifically for GLSA. To address this gap, we adapt elements from prior adoption studies in adjacent contexts (e.g., green building and e-procurement) to the GLSA setting and articulate a GLSA-specific framework. In particular, we draw on Aktas and Ozorhon (2015) and Darko et al. (2018) for the logic of grouping factors into barriers, drivers, and enablers, and on Toktaş-Palut et al. (2014) for the general sequencing of identifying barriers/drivers and then testing their effects. Figure 1 summarizes our GLSA-tailored framework.

Research framework.
According to the suggested framework, Barriers refer to obstacles, challenges, or impediments that hinder or obstruct the successful adoption of GLS practices within an organization (Thomas & Khanduja, 2022). In contrast, enablers and DFs encourage stakeholders to implement GLS. The enablers are the building blocks for GLSA, for example, the quality maturity level of the organization adopting GLS (Kaswan & Rathi, 2019). DFs are perceived motivations and expected benefits to adopt GLS (Hussain et al., 2022).
Our framework is grounded in Institutional Theory (external regulatory and normative pressures) and the Resource-Based View (internal capabilities), which together provide a consistent external-internal explanation of GLSA.
Although earlier studies have examined drivers, enablers, or barriers separately in related sustainability contexts for example (Darko et al., 2018; Toktaş-Palut et al., 2014), no prior research has developed an integrated framework that simultaneously captures these factors in the context of GLSA. In this study, drivers and enablers are modeled as distinct constructs for analytical clarity and comparability with related sustainability adoption studies. At the same time, we recognize that these categories are not fully independent. Enablers, such as organizational capability or infrastructure readiness, often act as prerequisites that make GLSA feasible, whereas drivers represent the expected benefits or motivating forces for GLSA. Conceptually, this suggests a causal chain where enablers facilitate GLSA, which in turn generates drivers. For parsimony, we model them in parallel, while we explicitly acknowledge their interdependence and recommend that future studies test mediation structures to capture these dynamics more precisely. The DFs, barriers, and enablers of GLSA for the construction sector are adopted from Hussain et al. (2022, 2019), and Hussain, He, Ahmad, Iqbal, and Nazneen (2023) respectively. Conceptually, Figure 2 presents the overall framework; empirically, we estimate three separate PLS-SEM models (barriers only, drivers only, enablers only) to isolate each group’s effect on GLSA.

Proposed model of the DFs, barriers, and enablers affecting GLSA.
According to Moursellas et al. (2024), enablers of sustainable supply chain practices positively influence the sustainability performance of small and medium enterprises. Miras-Rodríguez et al. (2015) assessed the impact of drivers and barriers on sustainability practices implementation in European manufacturing companies. They found barriers negatively and drivers positively influence sustainability practices. Kar and Jha (2021) examined the effects of barriers and enablers on sustainable materials management (MM) and reported barriers negatively, while drivers positively influence SMM in the construction industry. In addition, Karamat et al. (2019) reported that enablers and drivers positively, while barriers negatively influence knowledge management adoption in the healthcare system. Thus, this study proposes that drivers and enablers have positive, while barriers negatively influence GLSA.
Boundary condition: business cycle. Within our Institutional Theory + RBV lens, institutional pressures (e.g., policy stability, financing conditions) and firm resources (e.g., slack for capability investment) are cycle-sensitive. Accordingly, the strengths of barrier/driver/enabler paths may vary across expansion and contraction phases. We therefore treat the business cycle as a boundary condition to be tested with longitudinal data.
Hypotheses Development
This study tests three sets of hypotheses in three separate models, namely barriers, drivers, and enablers, to isolate each group’s effect on GLSA; barriers are theorized primarily via Institutional Theory, enablers via the Resource-Based View, and drivers capture perceived economic and institutional motivations. GLSA has recently gained attention to boosting sustainability and reducing cost, lead time, and waste in the construction sector (Banawi & Bilec, 2014; Hussain et al., 2023). Focusing on customer needs and expectations, GLSA enhances project quality, delivery speed, and overall customer satisfaction, providing a competitive advantage in the market (Shokri & Li, 2020). Literature reviews indicate that barriers make it hard for stakeholders to implement GLS, which means barriers negatively affect GLSA. Contrarily, DFs and enablers encourage stakeholders to adopt GLS, which means DFs and enablers positively influence GLSA (Darko, Chan, Gyamfi, et al., 2017; Hussain et al., 2023; Iqbal et al., 2022).
Barriers
A significant obstacle is the absence of governmental backing for sustainable construction practices, such as grants, loans, and training and works, to incentivize organizations toward eco-friendly initiatives. Cherrafi, Elfezazi, Garza-Reyes, et al. (2017) discussed Green and Lean barriers and reported a lack of government support to integrate Lean practices and a lack of expertise programs and training as the most significant barriers to Green and Lean adoption. Ghazilla et al. (2015) reported that organizational and technology-linked barriers are the most significant barriers to influencing Green manufacturing adoption in Malaysia. Mittal et al. (2016) identified that knowledge and information-related barriers negatively influence Lean and Green manufacturing systems. According to Shi et al. (2013), additional cost and increased time are economically linked barriers to green construction adoption in China.
Hence, based on the above literature, the following hypotheses are proposed.
DFs
Tokbolat et al. (2019) examined drivers for sustainable construction in Kazakhstan and found waste reduction, environmental protection, material efficiency, and energy conservation as the most important drivers. Bhattacharya et al. (2019) analyzed the benefits of Lean and Green integration in a review-based study. They reported environmental performance and waste reduction as the main drivers of Green and Lean integration. Darko et al. (2018) analyzed drivers for green construction in Ghana and stated organizational linked driving forces positively influence Green construction implementation. Noor et al. (2018) examined the drivers for Lean implementation and found increased competitiveness, improved planning, customer satisfaction, and improved operational processes as the major drivers for Lean adoption. Heckl et al. (2010) analyzed Six Sigma drivers in the financial service industry and found cost reduction an important driver of Six Sigma in the financial service industry. Dehdasht et al. (2020) conducted a study to examine the driver for Lean and Green construction implementation and found process optimization to be the most significant driver for Green and Lean implementation in Malaysia’s construction industry. Opoku et al. (2022) stated incentives for green designs as the most important driver for environmental sustainability in the construction projects of Ghana.
In keeping with our framework, we conceptualize drivers as perceived motivations and expected benefits that influence the decision to adopt GLSA rather than realized outcomes after adoption.
Hence, based on the above literature, the following hypotheses are proposed.
Enablers
Wong et al. (2016) analyzed the enablers and stated regulations by the government and government support and the establishment of standards are the enablers to support Green procurement in the construction sector of Hong Kong. G. Yadav and Desai (2017) analyzed Lean Six Sigma enablers from a generic perspective and found management engagement, efficient human resources and kaizen environment, and appropriate Lean Six Sigma staff selection as the main enablers to implementing Lean Six Sigma. Raval et al. (2018) analyzed LSS enablers in the manufacturing sector and found finance related enablers are significant in LSS implementation. Shibin et al. (2016) claimed organizational culture is an important enabler for flexible Green supply chain management in India. Raval et al. (2018) analyzed LSS enablers and found that team capability and capacity-linked enablers are very important. Kaswan and Rathi (2019) examined GLS enablers and found capability and capacity-associated enablers are the most significant. Raval et al. (2018) found that education linked enablers are very important for Lean Six Sigma adoption in the manufacturing industry.
Hence, based on the above literature, the following hypotheses are proposed.
The proposed hypotheses are examined in this research, and the findings are of great value to comprehending the roles of various elements impeding or supporting GLSA. The proposed model is illustrated in Figure 2.
Research Methodology
PLS-SEM has been acknowledged by many researchers and is used in several studies and disciplines, such as sociology, engineering, and management sciences (Byrne, 2016). It is a widely used methodology to assess multivariate models. PLS-SEM deals with two types of variables: latent and observable (Aibinu & Al-Lawati, 2010). Observable variables can be easily measured. Constructs are latent variables that cannot be measured directly. Hence, latent variables are measured indirectly through observable variables. PLS-SEM has an advantage over covariance-related SEM because it can manage small populations and non-normal data distribution. This feature of the PLS-SEM enhanced the acceptance of PLS-SEM in construction-related studies (Darko, 2019). This study analyzed the influences of different factors (DFs, barriers, enablers) on GLSA using PLS-SEM.
Instrument Development
During the initial phase of the study, important motivating factors (drivers) for GLSA were identified (Hussain et al., 2022). In the second phase, Hussain et al. (2019) explored 24 significant barriers to GLSA in Pakistan’s construction industry. In the third phase, Hussain et al. (2023) identified 16 key enablers to support GLSA in the same context. Table 1 summarizes the 15 constructs and their items used to assess the effects of drivers (DFs), barriers, and enablers on GLSA. The drivers, barriers, and enablers were adopted from prior studies Hussain, He, Ahmad, Iqbal, and Nazneen (2023), Kaswan and Rathi (2019), Hussain et al. (2019) and Darko et al. (2018), Hussain et al. (2023), and categorized following Shi et al. (2013), Darko et al. (2018), and Durdyev, Ismail et al. (2018). In addition, six domain experts were consulted through informal semi-structured interviews to refine factor categories (Hariyani & Mishra, 2022).
Constructs and Their Measurement.

A recognized scale for measuring GLSA does not yet exist. In this study, GLSA is conceptualized as the extent of organizational implementation of an integrated Green–Lean–Six Sigma methodology across projects and functions. Accordingly, we adapted and developed an initial six-item pool to capture firm-level implementation signals, such as inclusion of GLS considerations in specifications, GLS-oriented work practices, availability of internal GLS information and knowledge systems, and leadership support for GLSA, rather than single technology or material uptake. Because implementation unfolds within an institutional environment, the initial pool also included two institutionalization signals (policy enforcement and sector implementation guidance). To strengthen content coverage for a management-method construct, item domains were triangulated from the Lean, Six Sigma, and Green operations literatures (Shah & Ward, 2007; Zhu & Sarkis, 2004; Zu et al., 2008). The six-item pool underwent expert review with six practitioners for relevance and clarity, followed by a pilot test with 12 professionals (six from industry and six from academia) to refine wording and assess completion time (approximately 20–25 min). Negatively worded GLSA items (GLSA2 and GLSA3) were reverse-scored so that higher values consistently indicate a more favorable level of GLSA. During confirmatory factor analysis one item related to sector implementation guidance (GLSA6) fell below the loading threshold and was dropped. The final GLSA scale therefore contains five items (GLSA1–GLSA5), which are listed in Table 1, and its reliability and validity are reported in Section 3.
Questionnaire structure and scale format. Sample-based data collection using a questionnaire survey (QS) is widely used in GLS-related studies (Kaswan & Rathi, 2019) and is appropriate for attaining quantifiable objectives (Ackroyd & Hughes, 1992). QS also offers economy, convenience, and respondent anonymity (Darko, 2019). The final instrument comprised six parts: (i) study objectives and contact information; (ii) participant/organization details (e.g., organization type, role, education); (iii) GLSA items; (iv) barriers; (v) drivers (DFs); and (vi) enablers. All measurement items were assessed on five-point Likert scales: 1 = strongly disagree to 5 = strongly agree for GLSA, drivers, and enablers; and 1 = not critical to 5 = very critical for barriers (Dawes, 2008). Although QS surveys can face limitations such as response bias and low response rates, these were mitigated by targeting a reasonable and representative sample (Bamgbade et al., 2015). Following Durdyev, Zavadskas et al. (2018), the draft questionnaire was discussed with six experts to locate inconsistencies and ambiguities; adjustments were implemented based on their feedback before the pilot and final administration (Durdyev, Ismail et al., 2018).
Population and Sample
The survey respondents comprised professionals from the construction sector. The research team ensured that respondents were conversant with GLS philosophies. Initiated in the manufacturing domain, GLS is an emerging concept in the construction industry (Thomas & Khanduja, 2022). Thus, identifying and selecting respondents with GLS knowledge in the construction industry becomes challenging, especially in a developing economy. When faced with difficulties accessing the entire sample, nonprobability purposive sampling emerges as the preferred method due to its alignment with the representativeness of the theoretical framework (Zeng et al., 2022). Hence, this study employed a non-random sampling method because there was no sampling frame for this research. Nonprobability sampling has the advantage of attaining a representative sample, and it is suitable in a situation where probability sampling cannot be applied to choose the participants from the population (Taherdoost, 2016). In random sampling, the participants can be chosen based on their consent to participate in the study (Darko et al., 2018; Wilkins, 2011). Hence, a snowball sampling technique is utilized in the current research to achieve a valid sample size. This technique uses social or referral networks to collect and disseminate the details of respondents (Darko, 2019). It took approximately 3 months to finalize the potential respondents. The participants filled out a consent form and agreed to participate in the study. Respondents were selected based on their education and awareness about GLS. A suitable respondent was considered to have a Master Black Belt with knowledge of sustainable construction (Kaswan & Rathi, 2019).
Data Collection
A total of 456 questionnaires were emailed to potential respondents. We received 207 complete and usable responses (45% response rate). Supplemental Table S13 summarizes respondent characteristics. By organizational category, 32% were from construction firms, 39% from developers, and 28% from contractors. By role, 15.94% were construction managers, 14.01% architects, 15.46% project managers, 24.64% construction engineers, 15.46% contract managers, and 14.49% quantity surveyors. Experience levels were 1 to 5 years (22.71%), 6 to 10 years (28.02%), 11 to 15 years (25.60%), and >15 years (23.67%). Given the currently low penetration of GLSA in Pakistan’s construction sector, this sampling frame is appropriate for capturing informed judgments from practitioners with relevant responsibilities.
Data were collected via a structured questionnaire. Participation was voluntary and anonymous. To improve clarity and reduce response error, the instrument was developed through expert review and piloting (see Section 2.1), and negatively worded GLSA items were reverse-scored so that higher values consistently indicate a more favorable level of GLSA.
Sample Size and Statistical Power
We conducted an a priori power analysis for multiple regression (F-test of R2 increase) to determine an adequate sample for each PLS-SEM model, each of which includes five exogenous constructs predicting GLSA. Using α = .05 and desired power (1 −β) = .80, the minimum sample sizes are: f2 = 0.08 →N ≈ 172; f2 = 0.10 →N ≈ 140; f2 = 0.15 →N ≈ 97 (Cohen, 2013; Faul et al., 2009). Our final sample (N = 207) therefore provides power ≥ 0.80 to detect effects of approximately f2 ≥ 0.08 in all three models.
Consistent with recommendations for variance-based SEM, we emphasize explained variance and out-of-sample predictive assessment (PLS-Predict) rather than absolute global fit indices (Shmueli et al., 2019). We acknowledge that very small effects (e.g., f2 ≤ 0.05) may remain undetected at N = 207; we note this as a limitation and an avenue for future research.
In addition to the a priori power analysis, our sample satisfies the commonly cited 10-times rule in PLS-SEM. It exceeds (i) 10 times the largest number of structural paths pointing to the endogenous construct across our three models, which is five predictors of GLSA in the Drivers and Enablers models (threshold = 50), and (ii) 10 times the largest indicator block. Although all constructs are modeled reflectively (so this second criterion formally applies to formative blocks), we adopt a conservative check using the largest reflective block in our study, OLB with seven items in the Barriers model (threshold = 70). Our N = 207 exceeds both thresholds. The 10-times rule is a heuristic, so our primary justification remains the power analysis reported above.
Because GLS is nascent in Pakistan’s construction sector, a large, probability-based sampling frame of knowledgeable respondents is not yet feasible. We therefore used non-probability purposive sampling with snowballing to reach practitioners conversant with GLS concepts. This improves content relevance and comprehension but introduces selection bias toward relatively GLS-aware networks. Consequently, the findings are likely more representative of early adopters and should be generalized to the wider industry with caution. As discussed in our Limitations, probability-based or stratified designs targeting low-awareness firms would better capture the full distribution of views and may attenuate cost and energy drivers and amplify awareness and information barriers relative to our estimates.
Data Analysis
Confirmatory factor analysis (CFA) was used to examine the relationships between items and their corresponding constructs (Hair et al., 2011). The constructs and measurement items are listed in Table 1. Following Darko (2019), the measurement and structural models were specified, and reliability and validity were assessed prior to testing structural paths. Internal consistency reliability was evaluated using Cronbach’s alpha and composite reliability (CR); acceptable values were ≥.70 for both indices. Convergent validity was assessed via factor loadings (≥0.50) and average variance extracted (AVE ≥ 0.50; Fornell & Larcker, 1981; Hulland, 1999). Discriminant validity was examined using the Fornell–Larcker criterion (the square root of each construct’s AVE exceeding its correlations with other constructs) and the heterotrait–monotrait ratio, HTMT (<0.90; Henseler et al., 2015). Cross-loadings were also inspected to ensure each indicator loaded higher on its intended construct than on any alternative construct.
After establishing measurement quality, structural relationships were estimated and analyzed using bootstrapping (5,000 resamples) to obtain path coefficients, t-values, and p-values. In addition, out-of-sample predictive performance was examined by comparing PLS-SEM prediction errors with a linear model benchmark (LM) as reported in the Results. All analyses were conducted in SmartPLS 4.1.0.2.
To ensure analytical clarity and avoid multicollinearity among conceptually distinct construct groups, three independent PLS-SEM models were estimated. Specifically, one model examined the effects of barriers on GLSA, a second examined the effects of drivers, and a third tested the effects of enablers. This design isolates the unique influence of each category rather than combining them into a single integrated model. While barriers, drivers, and enablers are conceptually interrelated, they were operationalized and analyzed separately to provide clearer insights into their respective effects on GLSA. Because the dataset is cross-sectional (single wave), we did not estimate moderation by macroeconomic cycle proxies; instead, we discuss business-cycle contingencies conceptually and outline longitudinal tests in the Discussion. Complete measurement diagnostics and prediction outputs, including item-level statistics, HTMT matrices, cross-loadings, PLS-Predict tables, and respondent demographics, are provided in the Supplemental Material (Tables S1–S13).
Results
Barriers
Evaluation of Measurement Models
The first SEM model was estimated with barriers as exogenous constructs influencing GLSA. Items with CFA factor loadings below 0.50 were removed (Supplemental Material S1).
Reliability was satisfactory, with Cronbach’s alpha and composite reliability exceeding .70 for all constructs.
Convergent validity was established because all AVE values were at least 0.50 (Fornell & Larcker, 1981). Discriminant validity was supported in three ways: (i) the Fornell-Larcker matrix shows that the square root of each construct’s AVE exceeds its correlations with other constructs (Table 2), (ii) all HTMT ratios are below 0.90 (Supplemental Table S4), and (iii) each indicator loads more strongly on its own construct than on any other construct (cross-loadings, Supplemental Table S7). Discriminant validity by the Fornell–Larcker criterion is shown in Table 2.
Discriminant Validity Assessment (Fornell-Larcker Criterion) for Barriers Model.

Note. Diagonal elements (in bold) represent the square root of the average variance extracted (AVE). Off-diagonal elements are the correlations between constructs.
Evaluation of Structural Model
After confirming the measurement model, the structural model was evaluated (Figure 4). The barriers model explains R2 = .287 of GLSA. Q2_predict values are positive for all GLSA indicators (Supplemental Table S10), but modest in magnitude, ranging from 0.097 (GLSA2) to 0.215 (GLSA3), with GLSA1 and GLSA4 at 0.158 and GLSA5 at 0.166. In PLS-Predict, PLS-SEM_RMSE was lower than LM-RMSE for three indicators, equal for one, and slightly higher for one (Supplemental Table S10), which indicates medium predictive power at the construct level and uneven indicator-level prediction (Hair et al., 2021; Shmueli et al., 2019). This pattern suggests that adding contextual covariates or interactions may improve out-of-sample prediction for specific indicators.
With N = 207 and five predictors, statistical power is at least 0.80 for detecting effects of approximately f-squared ≥ 0.08. The mix of significant and non-significant paths is therefore consistent with effect-size magnitude rather than insufficient sample size (Figure 3).
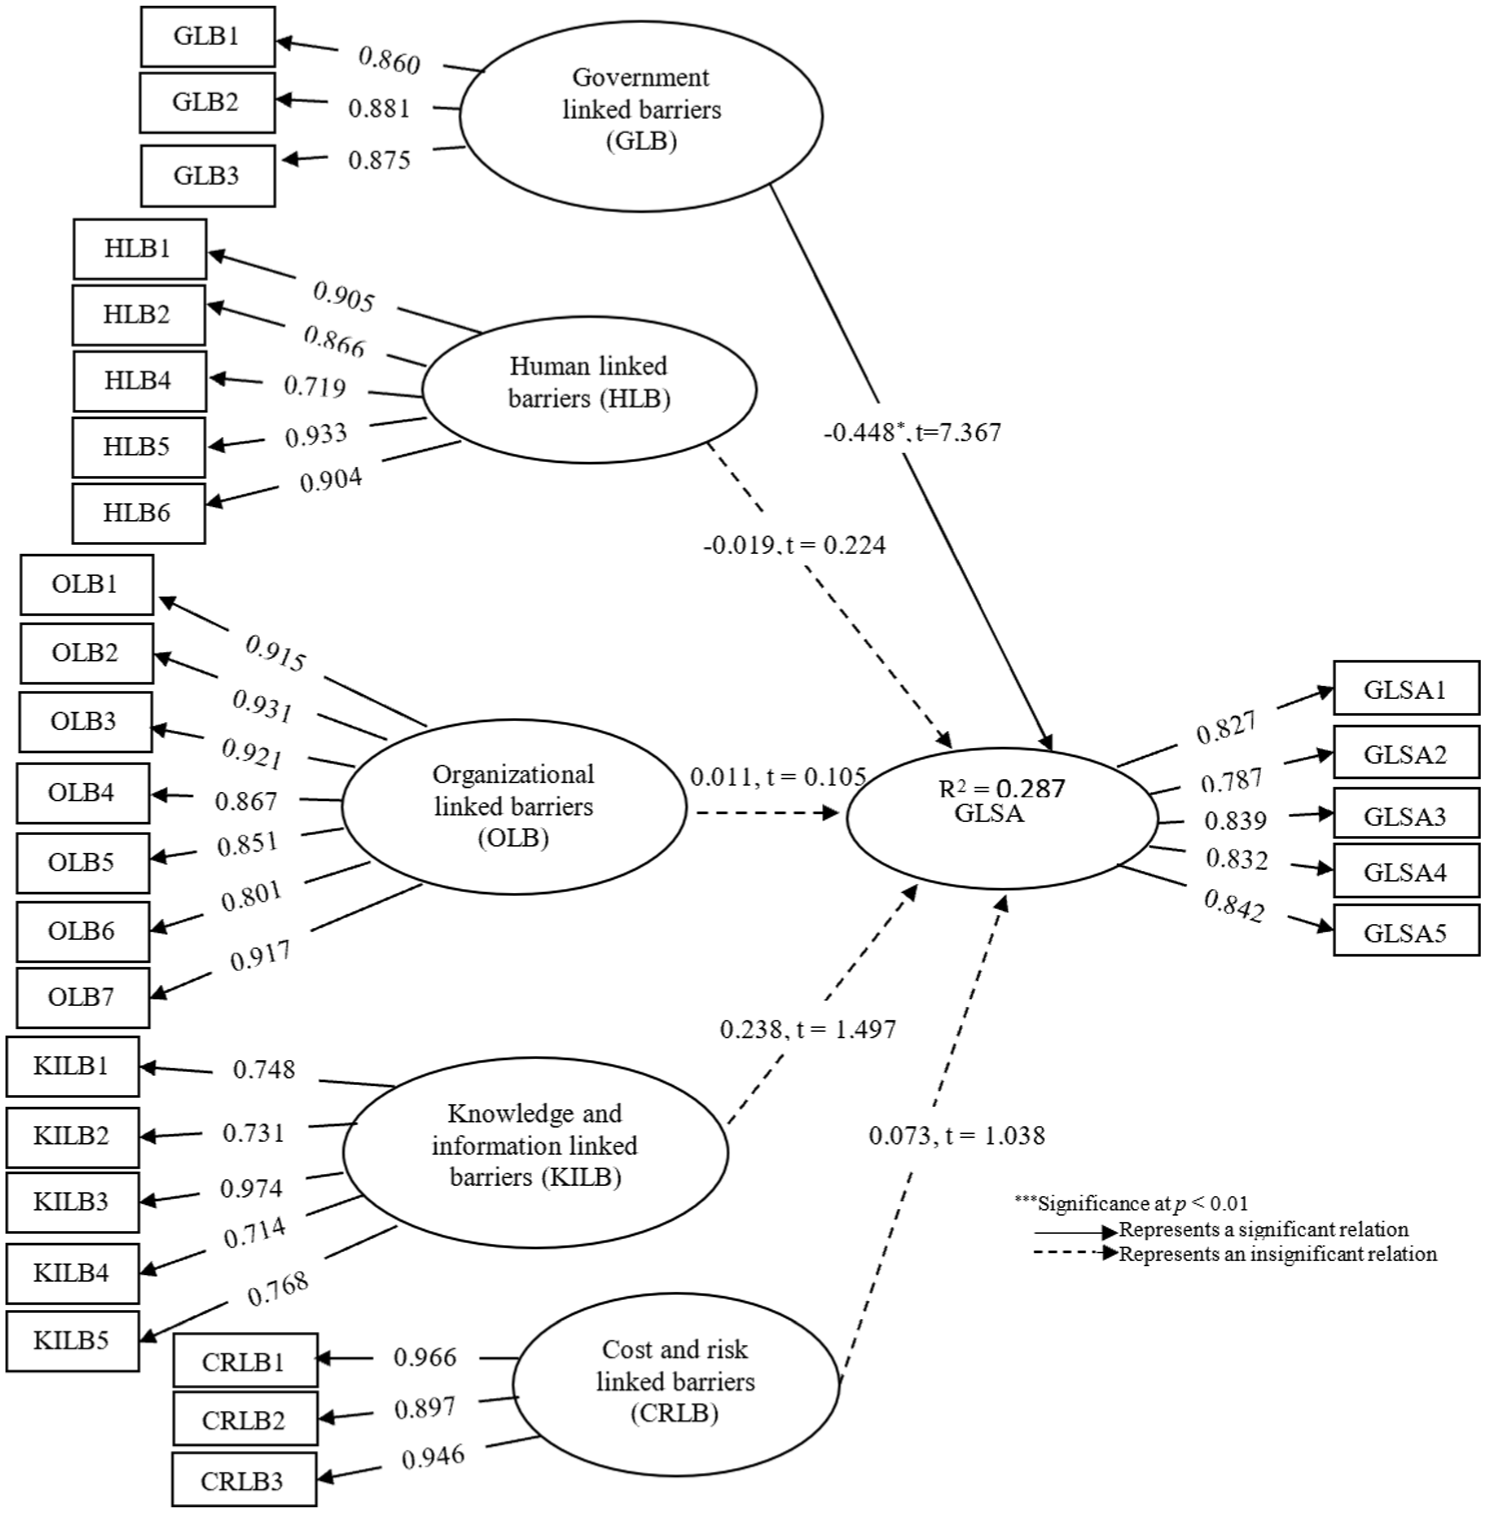
Structural model of barriers affecting GLSA.
Bootstrapping results (Table 3) show that the path from government-related barriers to GLSA is significant, with a coefficient of −0.448 (p < .01), representing a medium effect size (Cohen, 2013), supporting
Structural Model Assessment for Barriers.

Indicates p value < .01.
DFs
Evaluation of Measurement Model
The second SEM model was estimated with drivers (DFs) as exogenous constructs influencing GLSA. Items with CFA factor loadings below 0.50 were removed (Supplemental Table S1). Reliability was satisfactory, with Cronbach’s alpha and composite reliability exceeding .70 for all constructs. Convergent validity was established because all AVE values were at least 0.50 (Fornell & Larcker, 1981). Discriminant validity was supported in two ways: first, the Fornell-Larcker matrix shows that the square root of each construct’s AVE exceeds its correlations with other constructs (Table 4); second, all HTMT ratios are below 0.90 (Henseler et al., 2015; Supplemental Table S5). Cross-loading inspection further confirmed that each item loads more strongly on its intended construct than on any other (Supplemental Table S8). Discriminant validity by the Fornell–Larcker criterion is shown in Table 4.
Discriminant Validity Assessment (Fornell-Larcker Criterion) for Drivers Model.

Note: Diagonal elements (in bold) represent the square root of the average variance extracted (AVE). Off-diagonal elements are the correlations between constructs.
Evaluation of Structural Model
After confirming the measurement model, the structural model was evaluated (Figure 4). The drivers model explains R2 = 0.494 of GLSA. Q2_predict values are positive for all GLSA indicators (Supplemental Table S11) and are moderate in magnitude: GLSA1 = 0.361, GLSA2 = 0.300, GLSA3 = 0.323, GLSA4 = 0.300, and GLSA5 = 0.279. In PLS-Predict, PLS-SEM_RMSE is lower than LM-RMSE for all indicators (Supplemental Table S11), indicating high out-of-sample predictive power (Hair et al., 2021; Shmueli et al., 2019). Among indicators, GLSA5 has the lowest Q2_predict, indicating comparatively weaker predictive relevance for that item. With N = 207 and five predictors, statistical power is at least 0.80 for detecting effects of about f-squared ≥ 0.08. Bootstrapping results (Table 5) show that cost and energy-related drivers (
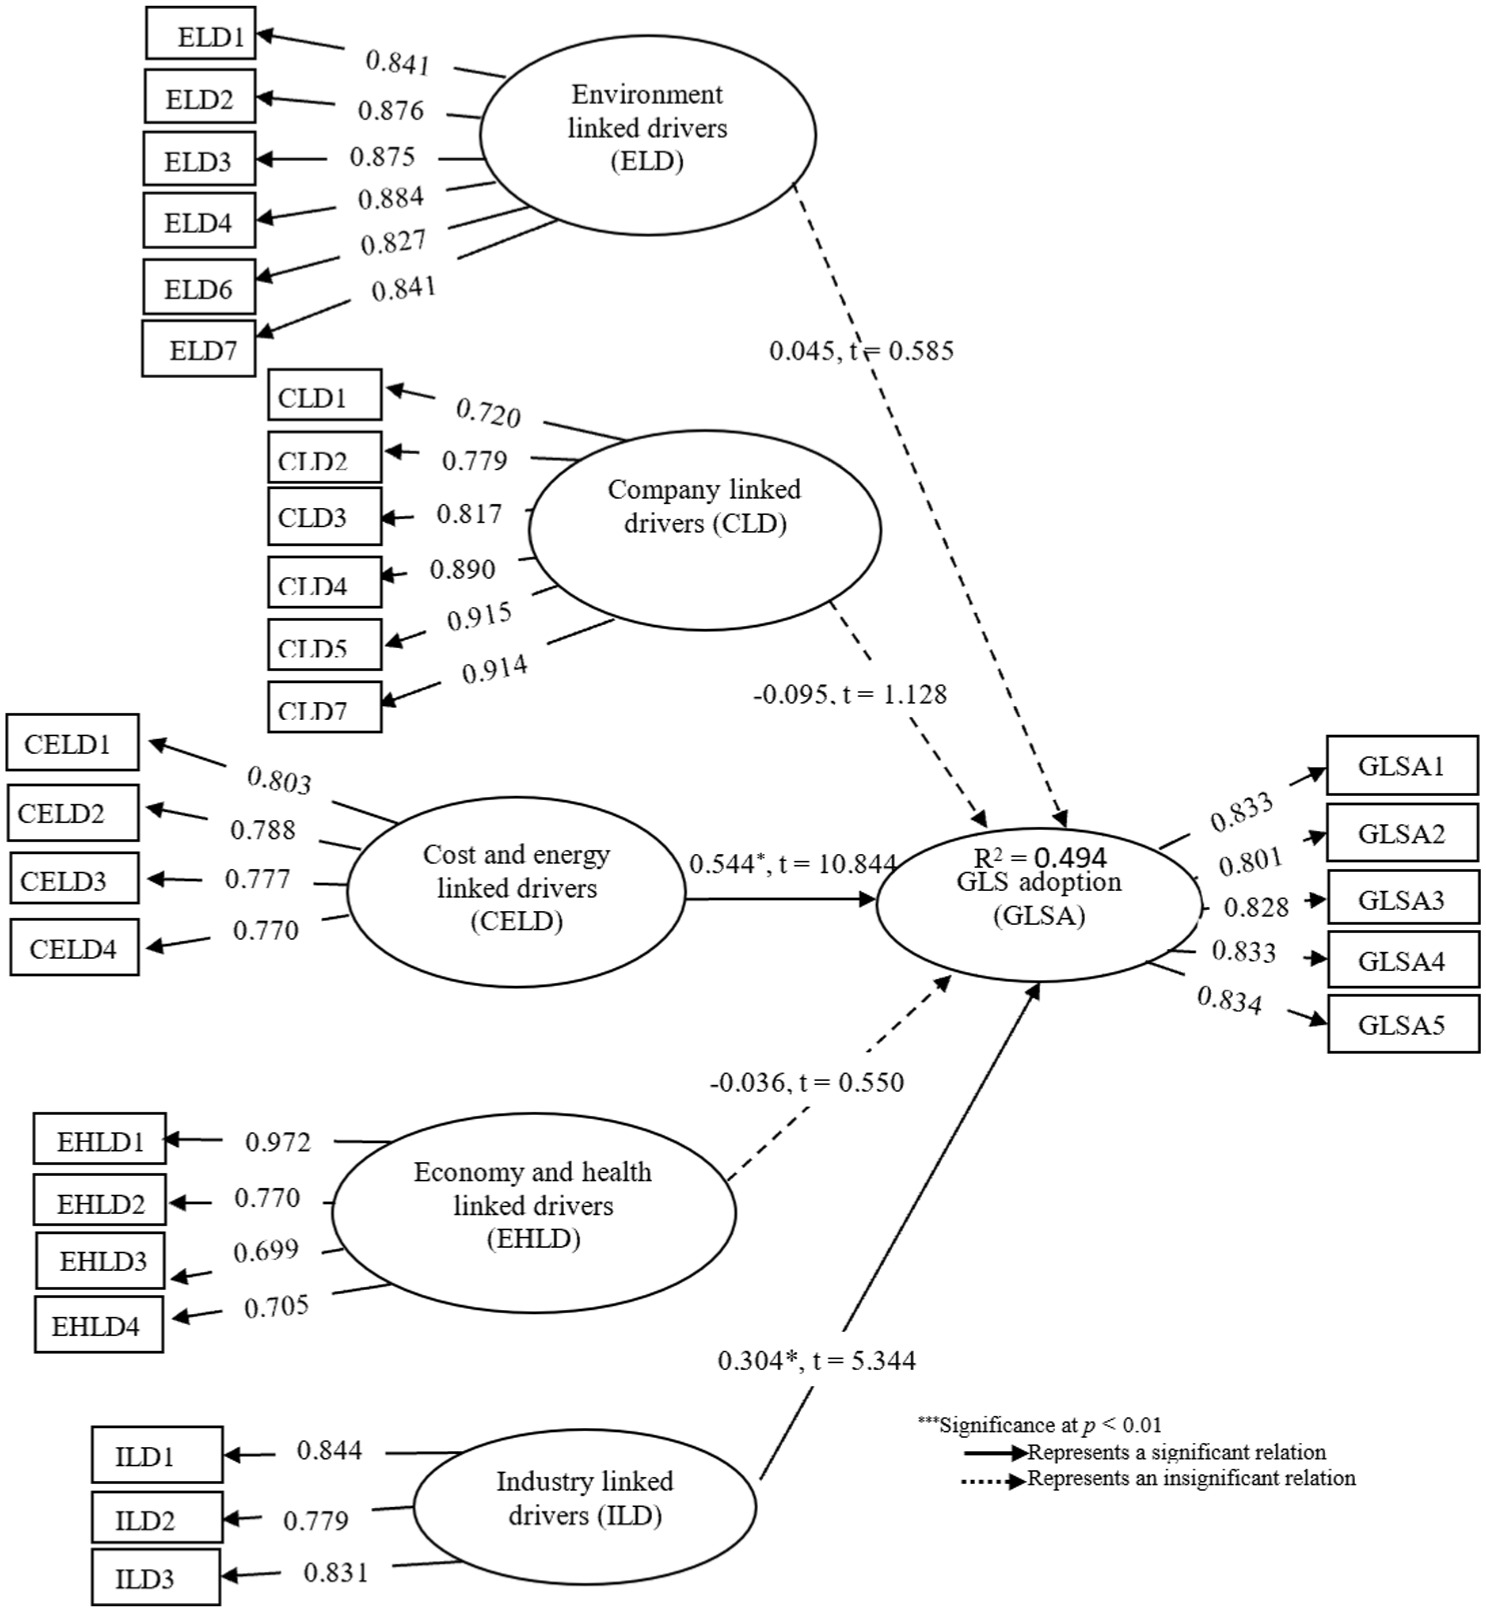
Structural equation model of DFs affecting GLSA.
Structural Model Assessment for DFs.

Indicates p value < .01.
Enablers
Evaluation of the Measurement Model
The third SEM model was estimated with enablers as exogenous constructs influencing GLSA. The measurement model assessment results are presented in Supplemental Table S3 and Figure 5. Items with CFA factor loadings below 0.50 were removed; Supplemental Table S3 reports the retained indicators. Reliability was satisfactory, with Cronbach’s alpha and composite reliability above .70 for all constructs. Convergent validity was established because all AVE values were at least 0.50 (Fornell & Larcker, 1981). Discriminant validity was supported in two ways: first, the Fornell-Larcker matrix shows that the square root of each construct’s AVE exceeds its correlations with other constructs (Table 6); second, all HTMT ratios are below 0.90 (Henseler et al., 2015; Supplemental Table S6). Cross-loading inspection further confirmed that each indicator loads most strongly on its intended construct (Supplemental Table S9). Discriminant validity by the Fornell–Larcker criterion is shown in Table 6.

Structural equation model of enablers affecting GLSA.
Discriminant Validity Assessment (Fornell-Larcker Criterion) for Enablers Model.
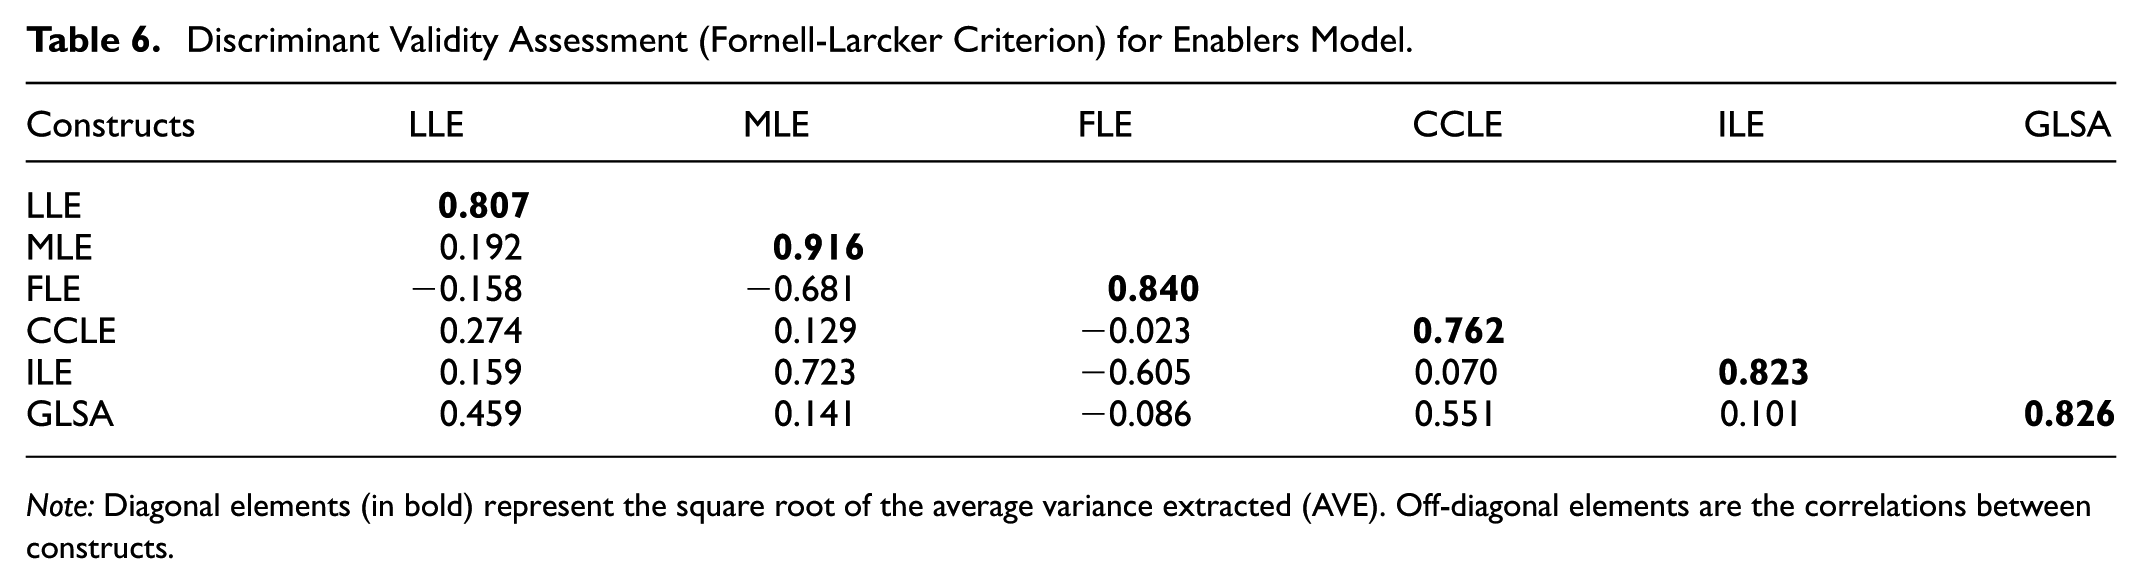
Note: Diagonal elements (in bold) represent the square root of the average variance extracted (AVE). Off-diagonal elements are the correlations between constructs.
Evaluation of Structural Model
After confirming the measurement model, the structural model was evaluated. The enablers model explains R2 = .407 of GLSA. Q2_predict values are positive for all GLSA indicators (Supplemental Table S12) and are small to moderate in magnitude: GLSA1 = 0.231, GLSA2 = 0.190, GLSA3 = 0.292, GLSA4 = 0.304, and GLSA5 = 0.195. In PLS-Predict, PLS-SEM_RMSE is lower than LM-RMSE for every indicator (0.962 vs. 1.019 for GLSA1; 1.062 vs. 1.108 for GLSA2; 0.921 vs. 0.957 for GLSA3; 0.919 vs. 0.951 for GLSA4; 1.038 vs. 1.080 for GLSA5), indicating high out-of-sample predictive power (Hair et al., 2021; Shmueli et al., 2019). The Q2_predict profile also shows relatively weaker indicator-level prediction for GLSA2 and GLSA5 compared with GLSA3 and GLSA4, suggesting that adding contextual covariates or interactions could further improve prediction for those items. With N = 207 and five predictors, statistical power is at least 0.80 for detecting effects of about f-squared ≥ 0.08.
Bootstrapping results (Table 7) show that legislation and policies-linked enablers (
Structural Model Assessment for Enablers Model.

Indicates p value < .01.
Discussion
To interpret the findings, this study adopts a dual theory lens: Institutional Theory and the Resource-Based View (RBV). Institutional Theory highlights the role of external institutional pressures such as regulations, policies, and industry norms in shaping GLSA. RBV emphasizes the firm-level resources and capabilities that enable adoption. By integrating these two perspectives, the study provides a consistent external-internal explanation of GLSA across the three separate models estimated (barriers, drivers, and enablers). This avoids theoretical fragmentation and directly addresses the need to explain how institutional pressures and firm resources interact.
Business-cycle contingency. The cyclical nature of the construction industry further contextualizes our results. In contractions, tighter liquidity and policy uncertainty can magnify coercive gaps (government-linked barriers) and heighten the salience of cost/energy efficiency as drivers; in expansions, greater resource slack typically strengthens the translation of capability/capacity enablers into GLSA. At the same time, boom-period schedule pressure can crowd out process-improvement projects, making net effects phase-dependent rather than uniform. Because our data are cross-sectional, we treat the business cycle as a boundary condition and outline longitudinal tests to evaluate these time-contingent relationships in future research.
Barriers
The PLS-SEM outcomes show that government-linked barriers (β = –0.448***, p < .01) significantly and negatively affect GLSA in Pakistan’s construction sector. This finding indicates that the greater the government-linked barriers, the lower the adoption of GLS. Institutional Theory (DiMaggio & Powell, 1983) supports this result, as it posits that regulatory pressures and government policies shape organizational behavior. In Pakistan, the lack of stable policies, incentives, and enforcement regulations creates institutional voids that discourage organizations from adopting sustainable practices (Khanna & Palepu, 1997). This aligns with earlier research in developing economies (Darko et al., 2018; Kundi & Shah, 2009), where weak governance structures were found to hinder sustainability initiatives. For example, Kundi and Shah (2009) highlighted unstable political and legal environments, along with insufficient government support, as key barriers to e-Business adoption in Pakistan.
The strong effect of government-linked barriers contrasts with findings from developed economies (Ahmed et al., 2023), where robust regulatory frameworks and coercive pressures drive green adoption. This divergence underscores the context-dependent nature of barriers, emphasizing that institutional weaknesses in developing economies amplify government-related obstacles. Similar results were reported in Ghana, where Darko et al. (2018) found government barriers to be the most critical in hindering GBTA, while Mathiyazhagan et al. (2013) observed that limited government support impedes the implementation of environmentally friendly policies.
Government-related barriers typically stem from the absence of regulations, guidelines, and incentives (Hussain et al., 2019). Without government mandates, firms lack the motivation to adopt GLS practices, particularly because of the high upfront investments required (Kumar et al., 2016). Other barriers commonly cited include the lack of incentives, weak demand for green products, and insufficient green building codes (Darko, Chan, Ameyaw, et al., 2017). The absence of environmental policies and public awareness campaigns exacerbates this issue, reducing the urgency for firms to pursue GLS adoption.
Interestingly, other barrier categories human-linked, organizational-linked, knowledge- and information-linked, and cost- and risk-linked were not significant. The barriers-only model suggests that, in Pakistan, institutional voids overshadow firm-level constraints. From an RBV perspective, this does not mean that organizational resources and capabilities are unimportant, but rather that their effectiveness is conditional on supportive external environments. When institutional support is weak, even firms with adequate resources may be unable to overcome adoption barriers. This perspective reconciles the apparent contradiction: RBV remains relevant for explaining enablers, but its influence is contingent on the presence of enabling institutional conditions. Similar non-significant findings have been reported elsewhere; for instance, Darko et al. (2018) found knowledge barriers to be insignificant for green technology adoption in Ghana, while Djokoto et al. (2014) reported cost- and risk-related barriers to be unimportant in green construction.
Pakistan’s political instability (with a stability index of –2.4, indicating a weak governance environment) further compounds these challenges (The Global Economy, 2017). Policy inconsistency discourages long-term planning and forces firms to focus on short-term profitability rather than sustainability. This finding aligns with Hussain et al. (2019), who noted that government-linked barriers have the strongest driving power in hindering GLSA, while other barriers remain secondary. Taken together, these findings emphasize the critical role of government stability and consistent policies in fostering GLSA, particularly in developing economies where financial constraints and weak institutions prevail.
DFs
According to the PLS-SEM outcomes, cost- and energy-linked drivers (β = .544***, p < .01) and industry-linked drivers (β = .304***, p < .01) are the most significant determinants of GLSA in Pakistan’s construction sector. These findings highlight the critical role of economic and institutional motivations in shaping sustainability adoption. From an Institutional Theory perspective, cost and energy-related drivers reflect coercive pressures, where firms respond to financial incentives, resource efficiency demands, and rising energy costs. Similarly, industry-related drivers reflect normative pressures, as firms align with sectoral practices, competitive benchmarks, and stakeholder expectations. Government policies and industry associations can thus promote GLSA by providing mechanisms such as tax rebates, incentive schemes, training initiatives, and funding for eco-technology development. Similar observations were made by Tunji-Olayeni et al. (2020) and Liu et al. (2012), who found that government incentives strongly promoted sustainable construction in Nigeria and China.
The dominance of cost and energy-related drivers also reflects the practical realities of Pakistan’s construction sector, where persistent energy shortages (Ahmad et al., 2020), make efficiency improvements a direct economic necessity. Prior studies support this interpretation: Bhattacharya et al. (2019) identified energy savings as a primary benefit of Lean and Green integration, while Tafazzoli et al. (2020) and de Freitas et al. (2017) emphasized cost savings and reduced lead times as core outcomes of Lean Six Sigma implementation. Costa et al. (2018), similarly reported that reduced inventory levels improved both operational efficiency and financial performance. Collectively, these studies show that GLSA adoption is strongly motivated by visible economic returns, which align with institutional incentives in developing contexts.
In contrast, environment-, health-, economy-, and company-linked drivers were not significant in this study. This divergence from findings in more developed contexts (Aigbavboa et al., 2016; Debrah et al., 2023; Ghazilla et al., 2015), where such drivers are often central, reflects the conditional nature of RBV. While firms may possess resources or capabilities to pursue environmental and social sustainability, their deployment is constrained in weak institutional environments where financial resources are scarce, regulatory enforcement is limited, and consumer demand for sustainable solutions is low. As a result, profit imperatives and short-term survival strategies overshadow normative sustainability motivations. This explains why RBV-linked resources do not translate into significant environmental or health drivers in Pakistan, whereas cost and industry-related drivers supported by stronger institutional logics dominate.
Enablers
The PLS-SEM results show that legislation- and policy-linked enablers (β = .329***, p < .01) and capability- and capacity-linked enablers (β = .459***, p < .01) are the most critical factors encouraging GLSA in Pakistan’s construction sector. These findings emphasize the dual importance of external regulatory frameworks and internal organizational readiness in driving sustainability-oriented transformations. From an Institutional Theory perspective, legislation and policies represent coercive pressures that provide the structural environment for adoption. From an RBV perspective, capability and capacity enablers validate the central proposition that firm-specific resources and organizational maturity are essential for implementing GLSA. Importantly, the limited effect of other enablers demonstrates that RBV’s impact is conditional: resources are valuable only when aligned with supportive institutional conditions.
The prominence of legislation and policy-linked enablers aligns with earlier results showing that government-linked barriers and industry-linked drivers significantly affect GLSA. Coherent and enforceable policies can mitigate resistance and create a favorable environment for adoption. Industry-linked drivers, such as government incentives, complement policy enablers by providing tax rebates, training opportunities, and mandates for sustainable practices, offsetting common barriers such as institutional instability. These interrelations reinforce the consistency of the findings and strengthen their reliability. Prior studies (Liu et al., 2012; Marhani et al., 2013; Mathiyazhagan et al., 2013), report similar dynamics, but limited attention has been given to the government’s role as a positive enabler of GLSA in Pakistan’s construction sector. Hussain et al. (2019) also highlighted the insufficient focus on the links between government support, political stability, and the adoption of GLS practices.
However, policy formulation alone is insufficient without enforcement. As Ahmad et al. (2020) noted, weak enforcement has hindered brownfield redevelopment in Pakistan. The absence of localized systems to monitor ecological costs, reported by Hussain et al. (2019), also reflects broader governance gaps. Effective GLSA therefore requires not only the creation of robust regulations but also their consistent enforcement across political cycles. Policy instability and frequent changes of administration reduce stakeholder confidence in long-term sustainability investments.
In addition to policy support, capability and capacity-linked enablers emerged as the strongest predictors of GLSA. Prior studies (Antony et al., 2012; Banihashemi et al., 2017; Goeke & Offodile, 2005; Kaswan & Rathi, 2019; Soti et al., 2010) highlight the importance of organizational maturity, technical expertise, and cultural readiness in enabling Lean and Green adoption. Kaswan and Rathi (2019) found that quality maturity and organizational capability were vital in India’s manufacturing sector, while Thakkar et al. (2008) and Soti et al. (2010) showed that poor internal readiness and resistance to change often result in failed sustainability initiatives. For Pakistan’s construction industry, building a culture that emphasizes quality and environmental performance is essential to translate policy enablers into successful GLSA practices.
By contrast, financial management, education, and management collaboration-related enablers did not significantly influence GLSA in this study. This suggests that, within Pakistan’s institutional landscape, top-down policy interventions are perceived as more effective than bottom-up initiatives. Limited financial incentives, weak training systems, and fragmented collaboration platforms further explain the low impact of these enablers. Public institutions therefore need to complement regulatory frameworks with targeted investments in capacity-building, technical education, and cross-industry collaboration to prepare the sector for effective GLS implementation.
In summary, these findings suggest that a synchronized approach involving strict legislation, supportive policies, and internal organizational readiness is essential for promoting GLSA in Pakistan’s construction sector. Government interventions through fiscal incentives, regulatory mandates, and public–private partnerships provide the external push, while organizational capabilities and cultural change ensure effective implementation and the long-term sustainability of these practices.
We synthesize the findings from all three models into an evidence-weighted adoption scheme, presented in Figure 6 and detailed in Section 4.6.

Scheme to facilitate GLSA.
Theoretical Implication
This study makes several theoretical contributions by applying a dual-theory lens to explain GLSA in Pakistan’s construction sector. First, it extends Institutional Theory by demonstrating that weak regulatory environments do not merely fail to promote adoption but actively function as barriers. Government-linked barriers illustrate how institutional voids, policy inconsistency, lack of enforcement, and political instability create coercive gaps that discourage sustainability practices. At the same time, cost- and industry-linked drivers show that when coercive and normative pressures are present in the form of financial incentives, energy savings, and industry benchmarks, they can effectively motivate adoption. This highlights the context-dependent nature of institutional pressures, adding nuance to existing literature by showing how the absence or instability of institutions in developing economies amplifies barriers while weakening normative sustainability logics. Together, these insights extend the dual-theory lens by proposing time-contingent Institutional–RBV interactions, whereby business-cycle phases condition how institutional pressures and firm resources translate into GLSA.
Second, the findings enrich the Resource-Based View (RBV) by showing that firm-level resources and capabilities, particularly capability and capacity enablers, are necessary but not sufficient for GLSA. While RBV emphasizes the role of organizational readiness, this study demonstrates that the effectiveness of internal resources is conditional on supportive institutional environments. In weak institutional contexts, internal capabilities cannot fully offset government-linked voids, but when combined with coherent policies and regulatory enforcement, they become powerful enablers. This integration addresses prior contradictions in the literature by clarifying that RBV does not operate independently; rather, its impact is mediated and amplified by institutional conditions.
Third, by analyzing barriers, drivers, and enablers through three separate models, the study advances GLS adoption frameworks in sustainability research. Prior studies examined these categories in isolation; this study shows that their combined effects can be understood more coherently by embedding them within a dual-theory lens. The evidence that institutional voids overshadow internal barriers, that institutional incentives amplify economic drivers, and that RBV-linked resources are contingent on regulatory stability provides a more holistic understanding of GLSA dynamics in developing economies.
Overall, the study contributes to theory by integrating Institutional Theory and RBV into a unified framework that explains the external–internal interplay underlying GLSA. This dual-theory integration not only addresses calls to reduce theoretical fragmentation but also provides a transferable lens for examining sustainability adoption in other developing contexts.
Practical Implications
This section presents an evidence-weighted set of actions aligned with the constructs that were significant in our models and the synthesis in Figure 6. The focus is on (i) removing government-linked barriers, (ii) activating legislation/policies and capability/capacity enablers, and (iii) leveraging cost- and energy-related and industry-linked drivers. Recommendations are grouped by stakeholder.
Policy makers and regulators
Reduce regulatory uncertainty by issuing multi-year, GLS-relevant standards and codes with clear compliance timelines and stable enforcement mechanisms (addresses the significant government-linked barriers and the legislation/policies enabler).
Use targeted fiscal instruments (e.g., tax rebates, fee reductions, or accelerated depreciation) tied to verifiable GLS practices and outcomes rather than broad, untargeted subsidies (activates the legislation/policies enabler and strengthens cost/energy drivers).
Embed GLS criteria in public procurement and permitting (e.g., waste-management plans, energy-efficiency requirements, quality-assurance procedures), and fast-track compliant projects (mitigates government-linked barriers and amplifies industry-linked drivers).
Provide sector guidance through consolidated portals and periodic compliance audits to ensure consistent interpretation across agencies (reinforces the policies enabler).
Industry associations, clients, and supply-chain partners
Create sector benchmarks and recognition programs for cost and energy performance of projects; publish exemplars and price-book references to reduce perceived risk (leverages cost/energy and industry-linked drivers).
Include GLS capability criteria in pre-qualification and supplier development programs; run joint training with certification bodies (supports capability/capacity enabler and industry-linked drivers).
Promote standard contract clauses for lean construction, waste minimization, and quality control, and align incentives to measurable GLS outcomes (strengthens industry-linked drivers and internal capability deployment).
Firms and contractors
Build internal capability using a staged GLS maturity plan: form cross-functional teams, run pilot projects, measure cost/energy/quality outcomes, and scale successful practices (targets the capability/capacity enabler and the cost/energy driver).
Integrate GLS routines into existing management systems (e.g., quality and environmental management), and adopt basic data systems to track process waste, rework, and energy use (capability/capacity enabler).
Participate in collective procurement or framework agreements that improve access to GLS-conformant materials and technologies (amplifies industry-linked drivers and cost/energy gains).
Contextual actions (not significant in this study; apply only if local diagnostics show salience)
Awareness and information programs, management collaboration initiatives, financial management tools, education and training, or targeted R&D may be useful where firms exhibit specific knowledge gaps or coordination failures. Given that these constructs were not significant in our estimates, they should be treated as optional complements rather than primary levers.
Evidence-Weighted Adoption Scheme for GLSA
To align the roadmap with the empirical results, Figure 6 distinguishes between primary levers supported by this study and secondary items that were not statistically significant in our data but may matter in specific contexts. The primary levers are: (i) cost and energy-related drivers and industry-linked drivers (Drivers model) and (ii) legislation/policies-linked enablers and capability/capacity-linked enablers (Enablers model). The Barriers model indicates that government-linked barriers are the dominant impediment. Accordingly, the scheme prioritizes removing government-linked barriers and activating policy and capability enablers to unlock the two significant driver categories. Items that were not significant in our data (e.g., human-linked and organizational-linked barriers, and management collaboration, financial, and education enablers) are shown as contextual levers to be monitored and addressed only when a local diagnostic shows salience. This evidence-weighted sequence avoids implying equal importance across factors and offers a practical order of action: diagnose, remove the dominant government-linked barriers, activate legislation/policies and capability/capacity enablers, then scale GLS practices that deliver cost and energy gains supported by industry incentives. Operationally, drivers are identified up front, but promotion and scaling occur after government-linked barriers are mitigated and legislation/policies and capability/capacity enablers are activated.
Conclusion
This study achieved the objectives by investigating the impacts of DFs, barriers, and enablers on GLSA in the construction sector of a developing economy. A questionnaire survey was carried out to collect data from 207 experts from the construction industry. Collected data were analyzed with PLS-SEM, and findings show that government-linked barriers significantly negatively affect GLSA, while industry, cost, and energy-linked driving forces and capability, quality maturity, and government legislation/ policies linked enablers significantly positively affect GLSA. According to the findings, cost, energy, and industry-linked DFs emerged as the most important DFs for GLSA. As Pakistan faces an electricity crisis, the reduced energy cost will inspire firms to adopt GLS. Moreover, reduced life cycle cost, lead time, better relationships with the stakeholders, and CSR are the major DFs that drive companies toward GLSA. Based on study findings a GLS promotion strategy is proposed. This research contributes to sustainable development by illustrating the factors influencing GLSA. This comprehension equips firms and policymakers to establish specific solutions to mitigate the barriers. For instance, if government support emerged as a major obstacle, efforts can be made to form independent bodies to monitor and promote eco-friendly and quality-oriented construction practices. The analysis of DFs and enablers will enable the firms to analyze their strengths and weaknesses before adopting the GLS approach. While DFs will guide them about the expected benefits of implementing GLS.
Despite several contributions, the study has limitations. First, it focuses on one country and sector and uses non-probability purposive and snowball sampling of GLS-aware professionals, which likely tilts the sample toward early adopters and limits generalizability. Second, the cross-sectional design prevents causal inference and cannot capture business-cycle effects that may shift the salience of cost and policy factors. Third, GLSA was measured with adapted items from adjacent literatures and one indicator was dropped during CFA; developing and validating a dedicated GLSA scale is an important next step. Fourth, we estimated three separate models for barriers, drivers, and enablers; future work should test mediation chains in which enablers facilitate GLSA and GLSA generates perceived drivers. Finally, while PLS-Predict indicated acceptable out-of-sample performance overall, Q2_predict was low for some indicators, suggesting scope to improve prediction with additional covariates and contextual moderators. Future studies should use probability-based or stratified sampling that includes low-awareness firms, collect longitudinal data and objective implementation metrics, examine business-cycle contingencies, and extend analysis beyond construction and beyond Pakistan.
Supplemental Material
sj-docx-1-sgo-10.1177_21582440251389696 – Supplemental material for Drivers, Barriers and Enablers Influencing Green, Lean Six Sigma Adoption in the Construction Industry: A Developing Economy’s Perspective
Supplemental material, sj-docx-1-sgo-10.1177_21582440251389696 for Drivers, Barriers and Enablers Influencing Green, Lean Six Sigma Adoption in the Construction Industry: A Developing Economy’s Perspective by Kramat Hussain, Sun Huaping, Muhammad Waqas and Muzaffar Iqbal in SAGE Open
Footnotes
Acknowledgements
This manuscript is part of a Ph.D. study drafted to promote GLSA in Pakistan’s developing economy. The authors acknowledge that this article shares a similar background with other published manuscripts by the authors but with a different methodology and scope. The authors extend thanks to the construction professionals with GLS expertise who provided inputs in the questionnaire survey. Additionally, the authors are indebted to the respected editors and reviewers for providing concrete suggestions and comments to enhance the quality of the article.
Ethical Considerations
The ethics committee of the Bahuddin Zakariya Univeristy Multan (R382/23) approved the study.
Funding
The authors received no financial support for the research, authorship, and/or publication of this article.
Declaration of Conflicting Interests
The authors declared no potential conflicts of interest with respect to the research, authorship, and/or publication of this article.
Data Availability Statement
Data will be made available on request.
Supplemental Material
Supplemental material for this article is available online.
References
Supplementary Material
Please find the following supplemental material available below.
For Open Access articles published under a Creative Commons License, all supplemental material carries the same license as the article it is associated with.
For non-Open Access articles published, all supplemental material carries a non-exclusive license, and permission requests for re-use of supplemental material or any part of supplemental material shall be sent directly to the copyright owner as specified in the copyright notice associated with the article.