
Abstract
The widespread adoption of car-sharing has squeezed the market space of existing transportation modes. As similar transportation services, the market competition between car-sharing and taxis warrants significant attention. Current research examining their competitive advantage from a cost structure perspective often overlooks complex factors such as user preferences, multiple pricing models, and diverse application scenarios. This study utilizes Beijing taxi order records and GPS trajectory data. Applying a real-data-driven Monte Carlo method, it provides a more precise prediction and analysis of the competitive advantage between car-sharing and taxis across multiple travel scenarios under varying user preferences. Particularly, this paper includes the time cost of walking and bike-sharing connections when measuring the travel cost of car-sharing, and explores the travel cost advantages among car-sharing companies by selecting four car-sharing pricing methods. Our study found that overall car-sharing does offer some travel cost advantages over taxis. The advantages of car-sharing in specific scenarios such as peak periods, medium and long-distance trips, and recreational trips are significant, and the travel cost of car-sharing is about 15.76% lower than that of taxis, on average, while taxis only have a more significant travel cost advantage for short trips. This study is expected to provide guidance for the coordinated development of car-sharing and taxis.
Introduction
The emergence of car-sharing has expanded residents' travel options and is gradually exerting a substitution effect on existing urban transportation systems. With the maturing technologies such as new energy vehicles (NEVs) and autonomous driving, coupled with the growing awareness of green travel among residents, car-sharing is becoming a significant choice for residents' mobility, with its market growth potential continuously expanding (H. Guo et al., 2022; Narayanan et al., 2020). Notably, since 2020, the ongoing COVID-19 pandemic has shifted travel behavior toward more personalized travel modes (Liu et al., 2022; Yang et al., 2022). Survey data indicates that post-pandemic, the share of private car travel among Chinese residents rose from 48.4% to 60.2%, while demand for private cars in the US increased by 9,000 vehicles in July 2021 compared to the same period the previous year (C. Zhang, 2021). Car-sharing is recognized as an important solution for meeting residents' demand for personalized travel while simultaneously addressing social issues such as traffic congestion, road safety, and air pollution (Carroll et al., 2017; M. Li et al., 2021; Parvin et al., 2023). However, the broader adoption of car-sharing is disrupting the existing urban transportation ecosystem. As a similar type of service, car-sharing substitutes for the taxi market to a certain extent. Although traditional taxis hold a first-mover advantage, the competitive pressure from the emerging car-sharing industry on the taxi sector remains significant and cannot be overlooked (Cabral & Gohr, 2023). Investigating the respective competitive advantages and core application scenarios of car-sharing and taxis will be crucial for their future coordinated development.
It has also been demonstrated that targeted exploration of coordinated development strategies for car-sharing and taxis in different travel scenarios is necessary. First, clarifying the specific travel scenario conditions and boundaries where each mode holds a competitive advantage is conducive to mitigating malicious price competition to a certain extent. Compared to taxis, car-sharing offers more flexible pricing. Implementing low-price strategies is one important way for companies to enhance market acceptance of car-sharing (Ciari et al., 2015). However, such undifferentiated low-price strategies can potentially lead to malicious price competition. Clearly defining the travel scenarios where car-sharing possesses a cost advantage provides valuable reference for implementing differentiated strategies, thereby avoiding the adverse consequences of indiscriminate low pricing. Secondly, car-sharing is a capital-intensive and high-risk industry (Berger, 2019). A clear market positioning is crucial for its sustainable development. Starting in 2017, car-sharing entered a period of rapid expansion (Ma et al., 2017), leading to the establishment of numerous startups within a short timeframe (the number of car-sharing companies exceeded 1,000). However, beginning in the second half of 2018, a significant proportion of small and medium-sized enterprises faced broken capital chains (suffering average losses of 50–120 RMB per vehicle per day), leading to bankruptcies and market exits (Berger, 2019). Defining the specific scenario conditions and boundaries where car-sharing holds a competitive advantage will enable companies to focus on their target market, accelerating market expansion and achieving profitability. Last but not least, research into the competitive advantages of car-sharing and taxis facilitates a deeper understanding of users’ differential sensitivity to travel costs under varying conditions such as travel distance, time pressure, and trip purpose. This understanding provides valuable guidance for user travel decision-making.
Research on the coupled and coordinated development of urban transportation and user travel behavior decision-making has consistently been a focal topic in academia. Existing literature has analyzed the core competitive advantages and user profiles of car-sharing and taxis from dimensions such as service attributes (Taeihagh & Lim, 2019), technology enablement (Deryabina & Trubnikova, 2021), environmental policies (Echeverría et al., 2014; Tait et al., 2016), and travel costs. Among these, research from the perspective of travel costs, as a key driver of long-term user travel decisions, helps reveal the underlying mechanisms of competition between car-sharing and taxi markets under behavioral economics theory. However, research from this perspective remains relatively scarce and exhibits the following two significant shortcomings: (1) Most current relevant studies investigate user behavior regarding car-sharing and taxi usage based on the rational agent assumption. In reality, however, people’s travel mode choices are significantly influenced by individual preferences (Acheampong & Siiba, 2020; Kimiagari & Baei, 2024; Kimiagari et al., 2022). Generally, when the difference in travel costs between car-sharing and taxis is small, users often tend to choose their travel mode based on individual preferences rather than always opting for the lowest cost. Consequently, existing research has not adequately captured the influence of user preferences on long-term travel mode choices and the resulting deep-seated impact on the competitive-cooperative relationship between car-sharing and taxis. (2) There is a relative lack of research focusing on different pricing models for car-sharing. For instance, Hu et al. (2020) and Dong et al. (2020) developed travel cost calculation models for car-sharing and taxis based on different travel characteristics (such as trip distance and duration), comparing the cost advantages of the two modes. However, these studies only considered one pricing model used by BAIC Group’s car-sharing service in Beijing. Zieja et al. (2019) analyzed the travel cost of car-sharing using only one example from a car-sharing company in Warsaw, Poland. Although the distance-plus-time pricing model is commonly adopted by car-sharing services, specific pricing methods still vary across different companies. For example, Evcard employs a pricing model that charges a base fare for the first 30 min, with service fees per minute applied beyond that initial period. In contrast, Gofun uses a model that charges separate service fees per unit distance and per unit time. For companies, clarifying the travel cost advantages of car-sharing under different pricing models holds significant value for positioning their target users and niche markets (Magno, 2021).
Therefore, this study focuses on analyzing the competitive advantages of car-sharing and taxis across multiple travel scenarios from the perspective of travel costs, specifically considering user preferences and different pricing models, using Beijing, China, as a case study. Specifically, we utilize taxi order data and GPS trajectories from Beijing Municipality to simulate users' cumulative travel costs for car-sharing and taxis based on travel preferences. We then conduct a comparative analysis to determine the specific scenario conditions and boundaries under which each mode holds a competitive advantage across different pricing models. We categorize travel scenarios into Common cases and Special cases. Special cases are further subdivided into peak and off-peak travel, short-distance and medium-long-distance travel, and recreational and non-recreational travel. Subsequently, we simulate and compare the long-term cumulative travel costs for users under scenarios where they exhibit a preference for either car-sharing or taxis within these specific categories. The innovation of this paper lies in the first place in the combination of high-precision actual operation data and the Monte Carlo simulation method. The application of this method that combines large-scale real data with probability simulation in this problem is novel. Second, this study innovates in the research design by constructing a theoretical transmission chain of “travel service pricing, user cost structure and market competitiveness” through refined scene segmentation and a multi-dimensional, contextualized comparative analysis framework.
The current research contributes to the body of literature in several ways. First, this study incorporates user preferences into the analytical framework of travel cost competition between car-sharing and taxis through a real data-driven simulation approach. This enhances simulation accuracy and fidelity, providing a paradigm for subsequent research on multimodal travel patterns, adaptive pricing, and behavioral economics within the context of urban mobility. Real-world data inherently encompasses complex interactions, nonlinear relationships, and diverse user factors within actual systems—elements often difficult for purely theoretical models to capture precisely. Moreover, traditional models rely on modelers’ assumptions and simplifications, which may not fully align with reality. The real data-driven approach learns patterns and relationships directly from data, reducing bias introduced by subjective assumptions. It improves the consistency between model outputs and observed system behaviors, typically yielding higher credibility and reliability. Second, while car-sharing solutions are often portrayed in research as environmentally friendly and economical alternatives to private travel options like taxis, this study’s nuanced investigation into their dynamic competition under different pricing models and travel scenarios challenges the oversimplified narratives prevalent in existing literature. The findings provide a micro-theoretical foundation for designing dynamic pricing strategies for sharing economy enterprises and offer new evidence for market segmentation theory in transportation economics. Overall, this research holds significant implications for car-sharing enterprises in identifying target users and positioning themselves in advantageous competitive markets. It will also facilitate the coordinated and sustainable development of car-sharing and taxis.
Literature Review
Competition and Cooperation Between Car-Sharing and Taxis at Different Developmental Stages
The business model for taxis has matured in countries around the world (Bludyan, 2021). As the later entrant into the market, car-sharing forms different competitive and cooperative relationships with traditional taxis in different stages of its development. The following section reviews the competitive and cooperative relationship between car-sharing and taxis in the initial stage, the large-scale development stage and the refined operation stage of car-sharing.
The Initial Stage of Car-Sharing
In the very beginning, car-sharing did not constitute a threat to traditional taxis. It was an emerging business model in the transportation sector, arising from the globalization of the sharing economy (Heinrichs et al., 2017). Different from traditional taxis, and depending on the Internet, artificial intelligence (AI), etc., the car-sharing system provided users with a self-service pickup and return service through an online reservation platform (Cohen & Kietzmann, 2014). The services were diverse in terms of demand type (one-way or round-trip), parking location (free-floating or station-based), reservation horizon (in-advance or last-minute), relocation capability (passive active or no relocation), vehicle ownership (CC and P2P), and vehicle engine type (internal combustion engine or electric) (Illgen & Höck, 2019; Kaspi et al., 2014; Lee et al., 2016; Weikl & Bogenberger, 2015). However, as a new product in the travel market, traditional taxis and other transportation modes put some pressure on its promotion (Krueger et al., 2016). In the global market, car-sharing started earlier in some European countries (Germany, France, Switzerland, etc.) and the U.S. (Ciari et al., 2015; Schlüter & Weyer, 2019), but relatively later in China, Singapore and other countries (it was widely promoted only around 2017) (Wang et al., 2018). Determining how to integrate itself into the existing transportation system and how to change the inherent travel patterns of residents were the main challenges initially faced by car-sharing in this stage (Zheng et al., 2023).
The Large-Scale Development Stage of Car-Sharing
The car-sharing business model is gradually entering the large-scale development stage, having been recognized by the market. The goal of car-sharing companies at this stage is to expand rapidly to attain meaningful shares of the market (Cheng et al., 2019). Due to the large-scale “invasion” of the market by car-sharing, there is strong competition between car-sharing and traditional cabs at this stage (Liang et al., 2022). For example, with the support of governments and multiple other parties, car-sharing in countries such as France, the U.S., and Germany has expanded rapidly and occupied a certain market share, having a big impact on traditional cabs. The U.S. Zipcar car-sharing platform amassed 770,000 users in 2017, helping the company to be valued at $1.1 billion. Research shows that strong government policy, financial and technological support, and a positive consumer response to low-carbon transportation are the keys to the rapid development of car-sharing. For example, the French government not only introduced a series of policies, such as land concessions, parking concessions and subsidies for new-energy vehicles, but also provided capital loans to car-sharing companies to solve numerous problems for them and guarantee the smooth implementation of car-sharing projects (Vervaeke & Calabrese, 2015). The government of Toronto, Canada offered a 30% parking subsidy for car-sharing users (Ferrero et al., 2018; G. Guo & Li, 2022). In several cities in Italy, car-sharing users can park for free in paid parking lots in city centers. In contrast, while countries such as China and Poland also experienced a rapid rise in the scale of car-sharing development, it was still difficult for a large-scale market for car-sharing to be formed, due to consumers still having a relatively traditional concept of car consumption and an imperfect charging infrastructure (Deng et al., 2022). In these locations, car-sharing did not create strong market competition with traditional cabs at this stage, but instead became an effective complement to them (Barrington-Leigh & Millard-Ball, 2017).
The Refined Operation Stage of Car-Sharing
The relationship between car-sharing and traditional cabs at this stage remains primarily competitive, but focuses on cooperation and complementation at the same time. The total market share of an industry is limited. Car-sharing companies focus more on refining their operations, after scaling up, to enhance their existing market competitiveness, and the traditional taxi industry will actively pursue reforms to maintain its market advantage. On the one hand, with the innovative integration of car-sharing with advanced technologies such as automatic pilot (Mori et al., 2022), the market scale of car-sharing will increase. The global car-sharing market is expected to grow at a compounded annual growth rate (CAGR) of 24% and exceed $9 billion by 2026 (Silberer et al., 2022). On the other hand, the rapid development of new transportation modes such as car-sharing has also stimulated the traditional taxi industry to accelerate its own transformation. In China, for example, new-energy reforms and taxi platforms are the main tendencies (Y. Li et al., 2022). About a third of the taxis in Beijing, Shanghai and Zhengzhou have been replaced with new-energy vehicles (Qin, 2021). About 25 cities in China have already achieved integrated online and offline taxi operations (Xiao, 2022). The competition between car-sharing and taxis will remain fierce in the future, but finding opportunities to cooperate and coexist would be the most beneficial way forward.
Competitive Advantages of Car-Sharing and Taxis
Car-sharing and taxis, as important suppliers of personalized urban mobility services, each possess their own advantages. Their competitive landscape and user choice behavior have sparked extensive research. First, with its birth more than 120 years ago, the taxi business model has long been mature. With an obvious first-mover advantage, it is an integral part of the urban transportation system and residents’ daily travel. According to statistics from 2022, the number of Chinese taxis was about 1.4 million and the number of service trips 27.56 billion (Gong, 2022). Car-sharing is a concrete realization of the sharing economy in the urban transportation sector, and it differs significantly from taxis in terms of business models and user travel characteristics. Car-sharing adopts a service mode of online reservation and self-service pickup and return driving. Compared to taxis, car-sharing offers users the experience of a private car (but without the cost of purchasing one (Stinson et al., 2021)) and a higher degree of autonomy. The self-service driving feature of car-sharing avoids the negativity and extra costs associated with greedy taxi drivers intentionally taking passengers on detours (Feng et al., 2022), making for a higher level of user satisfaction with car-sharing. Next, a distinctive feature of car-sharing, relative to taxi travel, is segmented travel. Statistics show that about 68.9% of car-sharing orders have a stopping period of more than 15 min (Hu et al., 2020). The car-sharing model is becoming more and more popular among users (Silberer et al., 2022). Car2go’s statistics show that 22,000 car-sharing vehicles were put into service just in the U.S. in 2015, catering to over 1.5 million car-sharing members (Shaheen & Chan, 2016). The number of car-sharing users in China had exceeded 3.6 million by 2021 (Pei, 2019), and car-sharing systems are already operating in more than 3,150 cities in nearly 60 countries worldwide.
On the other hand, there are differences in pricing methods between car-sharing and taxis, which leads to differences in their travel costs under different travel scenarios, and also affects the competitive and cooperative relationship between them. In China, the pricing model for taxis is relatively fixed and is generally set by the government. Based on the mileage of the taxi order, taxis generally adopt a combination of a basic mileage fee, an extra mileage fee, and other charges (such as low-speed charges, idling charges and night-time charges). By contrast, the pricing model for car-sharing is more flexible (Turoń & Kubik, 2020), including the “time + mileage” pricing model, the “basic fee + time + mileage” pricing model, a pricing model based on hours only, etc. This variety of pricing methods lead to differences in travel costs for travelers, which affects users’ choice of transportation modes and the competitiveness of companies in different market segments. Earlier studies on the travel costs of car-sharing versus taxis showed that taxis’ scale advantage gave them a travel cost advantage (Wang et al., 2018). Hu et al. (2020) and Dong et al. (2020) provide in-depth discussions of the travel cost advantages of both modes. They construct travel cost comparison models for users, featuring spatial, temporal, and user travel characteristics. Based on the rational person hypothesis, their study finds that car-sharing has a bigger travel cost advantage for long, non-working-day trips, while taxis have an advantage for peak-hour and short-duration trips. Zieja et al. (2019) explore the travel cost profile of car-sharing and find it begins to have a travel cost advantage when users accumulate 10,000 km or more of travel per year. Furthermore, several studies have predicted the future costs of car-sharing trips, suggesting that self-driving technology will make car-sharing systems cheaper than taxis (H. Guo et al., 2022).
Overall, at the service attribute level, taxis hold a significant advantage in scenarios demanding travel convenience and time sensitivity, leveraging their mature on-demand response network (Cramer & Krueger, 2016) and the “hail-and-ride” service characteristic. In contrast, car-sharing demonstrates flexibility for short-to-medium distance flexible travel (Shaheen & Cohen, 2019) and multi-destination chained trips through its distributed station network and self-driving mode, while also meeting user preferences for private space and autonomous control (Becker et al., 2017). As technology enablement reshapes competitive boundaries, taxi systems have seen substantial improvements in operational efficiency through platforms achieving real-time demand matching (Haliem et al., 2021) and dynamic pricing via algorithm optimization. Car-sharing, propelled by Internet of Things (IoT) technology development, breaks free from fixed station constraints in the free-floating service model (Kortum et al., 2016), enabling keyless operation and smart navigation via apps, thereby continuously narrowing the convenience gap with traditional taxis. Furthermore, differences in cost structure constitute a core variable in the competitive landscape. Taxis employ a “distance + time” instant payment model, with prices incorporating the labor cost of professional drivers. Carsharing relies on a “time-based rental” mechanism, eliminating labor costs through user self-driving. However, both service types face spatiotemporal imbalance costs: taxis incur peak surcharges (Yao, 2017), while car-sharing requires users to bear pick-up/return time costs and station accessibility risks.
In summary, previous relevant studies have failed to systematically incorporate the dynamic impact mechanisms of user heterogeneous preferences on cumulative travel costs. They also lack systematic verification of how key scenario variables (such as travel distance, time period, and trip purpose) influence the cost advantage thresholds for car-sharing and taxis. Therefore, this paper employs a real data-driven Monte Carlo method to integrate user travel choice preferences into the long-term travel cost prediction and the analysis of competitive advantages between car-sharing and taxis. Furthermore, we subdivide three categories of travel scenarios: travel during peak hours versus off-peak hours, short-distance travel versus medium-to-long-distance travel, and leisure and entertainment travel versus non-leisure and entertainment travel, to compare the respective travel cost advantages of car-sharing and taxis. The results should provide guidance for users’ travel mode choices and for the market segmentation and coordinated development of car-sharing and taxis.
Data and Processing
The research data used in this paper cover 61,317 taxi orders and corresponding GPS trajectory data, from 12 administrative districts in Beijing, China (Shijingshan, Chaoyang, Fengtai, Haidian, Xicheng, Dongcheng, Changping, Miyun, Fangshan, Daxing, Shunyi, and Tongzhou). Table 1 lists the sample data fields included in a taxi order: order ID (desensitized), starting time, ending time, starting latitude and longitude, and ending latitude and longitude. The GPS trajectory data consist of four fields: order ID, time stamp, latitude and longitude of tracking points, and instantaneous speed.
Sample Data Fields for a Taxi Order.

Next, the taxi orders and trajectory data are preprocessed. First, based on the time and latitude and longitude of the start and end of each order, and the instantaneous speed of the tracking point of the corresponding trajectory data, we calculate the travel mileage, travel time, low-speed travel time (cumulative travel duration for instantaneous speed of less than 12 km/h), peak and off-peak travel time (peak hours are 7:00–9:00 and 17:00–19:00), and night travel time (23:00 (incl.) to 5:00 the next day (excl.)). Second, we mark whether the order is on a weekday (determined by the national legal weekdays) and match the functional zones in which the order starts and ends, using the API service provided by Amap. Finally, we delete 756 orders with missing trajectory data and 1,328 orders with travel time less than 5 min or travel mileage less than 500 m. After that, we are left with 59,233 valid cab orders (data examples are shown in Table 2).
Sample Taxi Order After Data Processing.

Next, the study area is divided into a latitude-longitude grid. First, we set each grid cell size as 1km×1km, referring to the common division criteria used for regional grids in existing studies, and divide the 12 administrative districts of Beijing into 7,962 grids of the same area. According to the starting latitude and longitude of the taxi orders, they are matched to the grids, and a total of 2,635 grids containing taxi orders are obtained. Due to the low numbers of taxi orders in some grids, there are insufficient data in those grids to simulate users’ long-term travel behavior. Therefore, we delete those grids with less than 30 orders. Thus, we obtain 1,397 grids as the study sample.
Methodology
The Monte Carlo simulation employs random sampling to model the behavior of complex real-world systems, estimating analytically intractable target variables through extensive repeated trials. This approach is particularly suitable for the complex simulation scenarios in this study, which incorporate user preferences and diverse travel contexts. Consequently, we employ a real data-driven Monte Carlo simulation method to more accurately predict cumulative travel costs under users’ car-sharing or taxi travel preferences. First, we explain the users’ travel preferences and travel scenarios.
Users’ Travel Preferences
When people choose a travel mode in a real-life scenario, they do not always do so based on the lowest cost, but more often on their individual preference for a specific travel mode. For example, users who prefer to travel by taxi will still prefer to travel by taxi even if it would be cheaper to use car-sharing for a certain trip. Similarly, users who prefer car-sharing are also likely to prefer to travel by car-sharing in most cases, even if it is not the lowest-cost option. In this paper, we construct a cumulative travel cost model for taxi or car-sharing based on user preferences, and compare and analyze the difference in travel costs between the two options over the long term.
Users’ Travel Scenarios
Users’ daily trips are generally stable, which means that different users have distinct characteristics in terms of travel time, travel mileage and travel purpose (Hao et al., 2021). For example, the percentage of users who travel for the purpose of commuting is as high as 51.92%. Some travelers tend to travel on weekdays, while others travel mainly on non-working days (P. Zhao & Cao, 2020). Besides, the differences in the spatial scope of daily activities of different users also lead them to have different travel characteristics. For example, some travelers mainly make short-distance trips, mainly concentrated in an area of 10 km or less. Some travelers mainly travel for commuting or recreation purposes. We construct multiple travel scenarios for users with different travel needs or travel characteristics, and explore the differences in the cumulative travel costs between taxis and car-sharing. Next, we provide the major travel scenarios discussed in our study.
Common case
Based on the distribution characteristics of all users in terms of travel time, travel mileage, and travel purpose when using taxis or car-sharing, the overall travel cost situation of users under various travel scenarios is considered. The study data used for these travel scenarios are all taxi orders (including all orders for travel time, travel mileage, and travel purpose) and the 1,397 grids obtained by matching, corresponding to those orders.
Special Cases
After looking at the general case, we focus on groups of users who tend to use taxis or car-sharing at specific travel times, for specific travel miles or for specific travel purposes. Specifically, we divide them up in the following three ways: peak versus off-peak travel, short-distance versus medium-long-distance travel, and recreational versus non-recreational travel.
① Peak travel and off-peak travel. These two travel scenarios are simulated to compare the cumulative travel costs between peak and off-peak hours for users with taxi or car-sharing travel preferences. The study data for this travel scenario application are the taxi orders with peak or off-peak start times, and the 728 and 874 grids obtained from those orders after matching, respectively.
② Short-distance travel and medium-long-distance travel. These two travel scenarios are simulated to compare the cumulative travel costs of users’ taxi and car-sharing travel preferences for short-haul and medium-to-long-haul trips. The study data for this simulation are filtered from taxi orders with travel mileages of less than 10 km and those of more than 10 km, respectively, matched to 834 and 774 grids, respectively.
③ Recreational travel and non-recreational travel. These travel scenarios are simulated to compare the cumulative travel costs of recreational and non-recreational trips, for users with taxi or car-sharing travel preferences. For the recreational side, we use those taxi orders with termination locations in one of the four functional zones of food service, shopping, sports and recreation, or tourist attraction, and the corresponding 707 grids. On the non-recreational side, we use those taxi orders with termination locations in any of the other functional zones, and the matched 914 grids.
A Simulation Framework for User Cumulative Travel Costs Based on Travel Preferences
We use the Monte Carlo method to simulate and measure the cumulative travel costs of users under taxi or car-sharing travel preferences. The measurement process is shown in Figure 1 and the steps are as follows:
Detailed explanations of each step are provided below.

Framework for simulating the cumulative travel costs of users.
Step 1: Random Sampling to Obtain a Sample of Users
Utilizing weighted sampling, one grid cell is randomly selected from all grid cells within the target study area. We assume that the travel demand of travelers within this area can be represented by the distribution of all historical taxi orders within that grid cell. We randomly select one grid cell from all grid cells as a traveler sample. Considering that travel characteristics of users in different areas exhibit significant differences due to factors such as locational influences, weighted sampling is conducted based on the population distribution of each administrative district to obtain a reasonable sample set. The probability of any administrative district grid cell being sampled is shown in Formula (1), where Nm represents the total population of the m-th administrative district.

Step 2: Simulate the User’s Trip Under a Taxi and Then a car-Sharing Travel Preference, Respectively, and Calculate the Corresponding Taxi Travel Cost and Car-Sharing Travel Cost
From the target grid cell, one taxi order meeting the travel condition criteria is sampled to represent a taxi trip, and its travel cost is simulated. Here, “meeting the travel condition criteria” refers to conforming to the multiple travel scenarios we have defined. In the Common Case, we employ a sampling strategy with replacement based on a uniform distribution for all orders within the target grid cell. In the Special Case, we employ a sampling strategy with replacement based on a uniform distribution for the corresponding order set within the target grid cell. Here, the “corresponding order set” refers to all orders belonging to the Special Case, such as all peak-hour orders or all short-distance orders, etc. The travel cost under taxi preference, Ctaxi, is given by Formula (2), whereas the travel cost under car-sharing preference, Csharing, is given by Formula (3).


Among these, represent the taxi flag-fall fare, driving fee, low-speed driving fee, night driving surcharge, and deadhead surcharge, respectively; represent the car-sharing pickup cost, rental cost, and drop-off cost, respectively.
Step 3: Calculate the cumulative travel cost of the user when the cumulative travel mileage reaches a threshold
We set the cumulative travel mileage thresholds as 1,000 km, 2,000 km, 3,000 km, …, 20,000 km, and calculate the cumulative travel cost for each user at the corresponding thresholds, for taxi and car-sharing travel preferences. UseriT and UserijS denote the cumulative travel costs of user i who has taxi and car-sharing travel preferences, respectively, as shown in Equations (4) and (5).


Step 4: Calculate the average cumulative travel cost for users with a taxi or car-sharing travel preference
Next, we repeat Steps 1 to 3 to obtain enough simulated data on the cumulative travel costs of users. We take the average of the cumulative travel costs of all users to represent the general level of long-term travel costs when users have a taxi or a car-sharing travel preference. CTC_Taxi and CTC_CS denote the average cumulative travel cost with a taxi and a car-sharing travel preference, respectively, as shown in Equations (6) and (7).


Some Details in the Simulation
Travel Cost Simulation Under Taxi Preference
We define the order cost of the kth preferred taxi trip for the ith user as

where Sk denotes the travel mileage of the kth order, s is the service mileage within the basic fee. The extra mileage fee (Cdrive) refers to the mileage fee (as shown in Equation (9)) that the user pays for a taxi trip that exceeds the basic service mileage. The low-speed fee (Clow-speed) is the cost incurred by the taxi for the cumulative time spent traveling at a low speed, and the unit price of that fee differs between the peak and off-peak travel periods (as shown in Equation (10)). The night-time fee (Cnight) is the additional charge for taking a taxi during the night hours (23:00 (incl.) to 5:00 (excl.) of the next day) (as shown in Equation (11)). The empty cruise fee (Cempty) refers to the additional charge for the portion of a one-way passenger trip that exceeds the city’s prescribed mileage (as shown in Equation (12)).


where Pdrive is the base unit price for mileage (the unit price per mile over the initial part of the trip).
Travel Cost Simulation Under Car-Sharing Preference
Based on the taxi orders obtained by sampling, we now simulate the pickup and return distances, pickup and return modes, and stopping times to get corresponding car-sharing order. In this paper, we consider the costs of picking up and returning car-sharing vehicles generated by either walking or riding (Hu et al., 2020).
The Cost of Picking Up or Returning a Car-Sharing Vehicle
Since the car-sharing pricing method does not impact the cost of picking up or returning a car-sharing vehicle, this cost is the same for all four car-sharing pricing models. Equation (13) gives the calculation of the cost of picking up a car-sharing vehicle (

where W = 1 if the pickup method is walking, otherwise W = 0. vwalk is the general walking speed,
The Cost of Renting a Car-Sharing Vehicle
Next, we will explain the car-sharing fee methods of Evcard, Gofun, Togo, and Dacheng, and the calculation of the rental cost when users travel by car-sharing.
Rental Costs of Evcard (
)
The pricing method of Evcard is to charge a basic fee for the base service time and an additional per-minute service fee for the portion of the service that exceeds the base service time (not counting mileage charges). Additionally, it is up to the user to voluntarily purchase deductible insurance (given the various risks involved in driving, users generally choose to purchase insurance, so we assume a priori that all users purchase deductible insurance). The calculation of

where

where tdrive is the total driving time for an order (including the time spent returning the car) and tstop is the stopping period for an order.
Rental Costs of Gofun (
)
Gofun adopts a “time + mileage” pricing method, that is, it charges a service fee per unit of mileage and a service fee per unit of time. It is voluntary for the user to purchase deductible insurance. The calculation is shown in Equation (16).

where
Rental Costs of Togo (
)
Togo also adopts a “time + mileage” pricing method, but differs from Gofun in its time pricing. For the time charge, there is a basic fee within the basic service time, and a separate service fee per minute beyond the basic service time (the fee per minute differs between day and night-time). Besides this, travel mileage is charged for on a per kilometer basis. Togo’s deductible insurance is included in its time and mileage fees and not charged for separately, as shown in Equation (17).

where
Rental Costs of Dacheng (
)
Dacheng’s pricing model only charges a time fee, based on the duration of the car-sharing rental, and not a mileage fee. It is up to the user to voluntarily purchase deductible insurance. The calculation is shown in Equation (18).

where
Results and Analysis
Parameter Elucidation
(1) The standard charges for taxis in Beijing are shown in Table 3.
(2) When the user travels to or from a car-sharing vehicle by walking, their walking speed vwalk is assumed to be a random number between 88 and 90 m/min based on the general walking speed of residents (1.48–1.51 m/s).
(3) Based on the average annual income level of Beijing residents, it is assumed that the cost of walking is a random number between 0.44 and 0.7 CNY/min.
(4) Based on the average speed of residents when riding a bike, a trip of 3 km can generally be completed within the base service time of the basic fare for a shared bike (30 mins). Therefore, we assume that the cost of a user choosing to rent a shared bike to travel to or from a car-sharing vehicle is 1.5 CNY (dtake<3 km).
(5) Based on the four car-sharing pricing methods, Table 4 lists the relevant parameters for the car-sharing travel cost calculations.
Beijing Taxi Fare Standard.

Parameters for Car-sharing Travel Cost Calculations.

Comparison of Cumulative Travel Costs of Car-Sharing and Taxis for the Common Case
Figure 2 shows the comparison of the cumulative travel costs of car-sharing and taxis, for the common case. To be specific, Figure 2(a) presents the cumulative user travel costs of taxis versus the four types of car-sharing (CTC_Taxi vs CTC_CS) as the cumulative travel mileage increases, and Figure 2(b) presents the mean difference (blue bar graph) and mean ratio (red line graph) between CTC_Taxi and CTC_CS for each 100 km of cumulative travel by the users. The overall difference in the users’ cumulative travel costs, between car-sharing and taxis, is significant. The cumulative travel costs are highest for Togo car-sharing, and get smaller for taxis, Dacheng cars-sharing, Evcard and Gofun, in turn. The travel cost advantage of Gofun is thus the most significant, at about 22% lower than that for taxis, per 100 km of cumulative user travel, as shown in Figure 2(b). This shows that car-sharing does seem to have some advantages compared to traditional taxis in terms of travel costs. Furthermore, the travel costs of car-sharing are influenced significantly by the pricing method used, with a large discrepancy in users’ cumulative travel costs seen for the different car-sharing pricing methods. For example, the cumulative travel cost of Togo is nearly 41% higher than that for Gofun for the same cumulative travel mileage of the users.
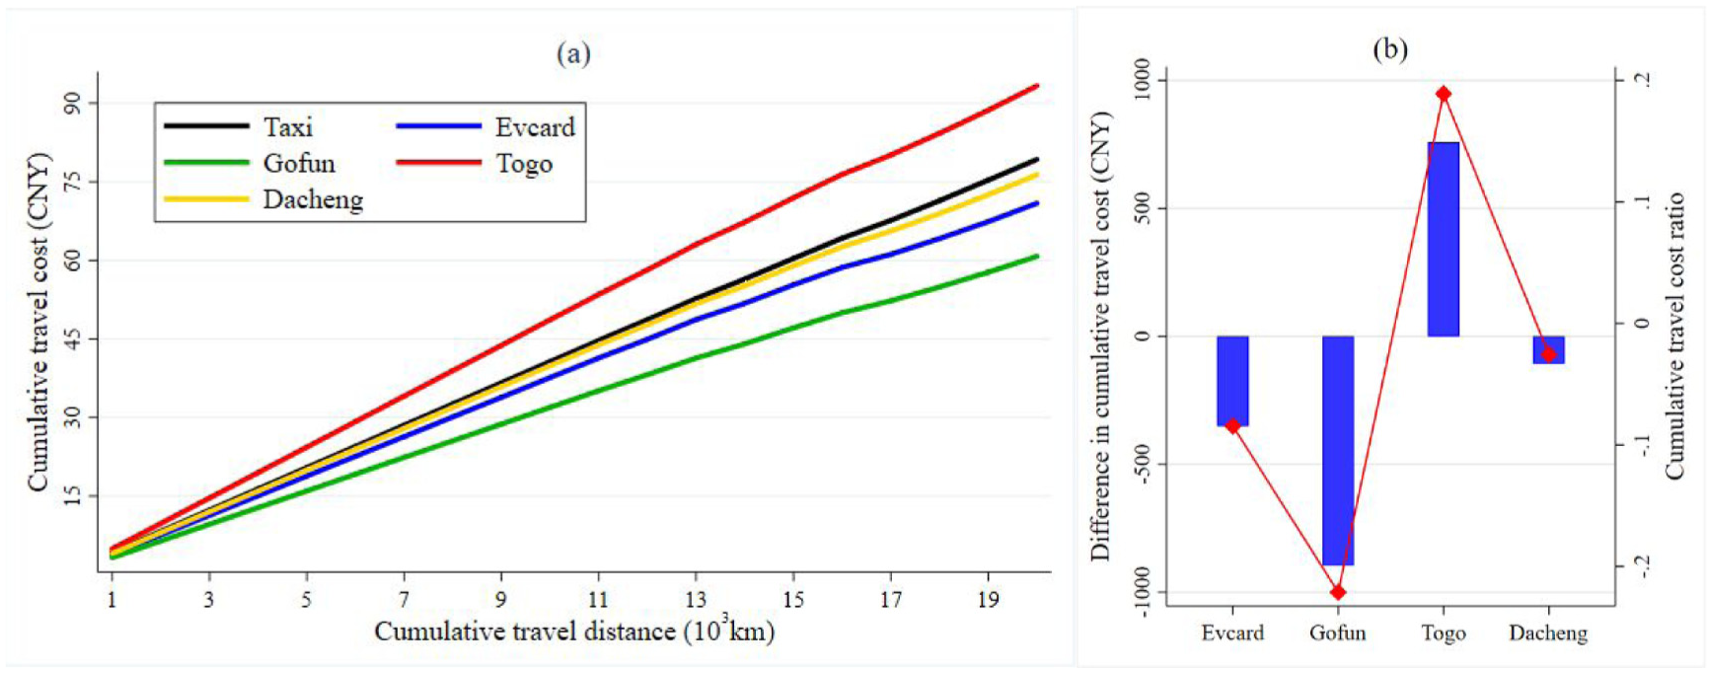
Comparison of cumulative travel costs of car-sharing and taxis for the common case (a) reports the changes in the cumulative travel cost of users as their cumulative travel mileage increases under different travel options, and (b) reports the relative travel costs per 100 km for each of the four types of car-sharing compared to taxis (on the left y-axis, it shows the difference between car-sharing and taxis for each 100 km, and on the right y-axis, it shows the ratio of the difference between car-sharing and taxis for each 100 km to the travel cost of taxis).
Comparison of Cumulative Travel Costs of Car-Sharing and Taxis for Special Cases
Next, we look at the simulation results for the cumulative travel costs of users under the various special cases listed earlier: peak and off-peak travel, short-distance and medium-long-distance travel, and recreational and non-recreational travel, which are shown in Figures 3 to 8.
Figures 3 and 4 illustrate the comparison of users’ cumulative travel costs for taxis and car-sharing for the peak and off-peak travel scenarios, respectively. It can be seen from Figure 3 that the cumulative travel cost of taxis is higher in the peak travel scenario, with car-sharing having a greater travel cost advantage. Taxis cost more than Togo, Dacheng, Evcard and Gofun, by about 2.5%, 18.7%, 24.1%, and 32.3% on average, respectively. However, in the off-peak travel scenario, the travel cost advantages of car-sharing are diminished. Evcard and Gofun still have a travel cost advantage over traditional taxis, but Togo no longer does, as shown in Figure 4(a). The travel costs of Evcard and Gofun are about 5.8% and 19.8% lower, on average, than those of taxis in this travel scenario, while Togo is on average about 22.6% more expensive than taxis.

Comparison of cumulative travel costs of car-sharing and taxis in the peak travel scenario (a) reports the changes in the cumulative travel cost of users as their cumulative travel mileage increases under different travel options, and (b) reports the relative travel costs per 100 km for each of the four types of car-sharing compared to taxis (on the left y-axis, it shows the difference between car-sharing and taxis for each 100 km, and on the right y-axis, it shows the ratio of the difference between car-sharing and taxis for each 100 km to the travel cost of taxis).

Comparison of cumulative travel costs of car-sharing and taxis in the off-peak travel scenario (a) reports the changes in the cumulative travel cost of users as their cumulative travel mileage increases under different travel options, and (b) reports the relative travel costs per 100 km for each of the four types of car-sharing compared to taxis (on the left y-axis, it shows the difference between car-sharing and taxis for each 100 km, and on the right y-axis, it shows the ratio of the difference between car-sharing and taxis for each 100 km to the travel cost of taxis).
Figures 5 and 6 illustrate the comparison of users’ cumulative travel costs when using taxis and car-sharing for the short-distance and medium-long-distance travel scenarios, respectively. On the whole, the cumulative travel costs of users in the short-distance travel scenario are almost twice those in the medium-long-distance travel scenario (compare Figure 5(a) with Figure 6(a)), also the difference between the travel costs of car-sharing and taxis is pronounced in both scenarios. Specifically, it can be seen from Figure 5 that the travel cost advantage of taxis is outstanding in the short-distance travel scenario. Taxis’ travel costs are approximately 42.7% lower than Togo’s and 23.5% lower than Evcard’s and Dacheng’s, for the same cumulative travel mileage of users. In contrast, in the medium-long-distance travel scenario, taxis become the most expensive option for travel. Car-sharing has the travel cost advantage, with Evcard and Gofun the most affordable travel options, being cheaper than taxis by about 35.6% and 39.9% respectively, for the same cumulative user travel mileage. Therefore, from a rational point of view, travel mileage should be an important consideration for users when choosing between taxis and car-sharing, especially for those who often make short trips.

Comparison of cumulative travel costs of car-sharing and taxis in the short-distance travel scenario (a) reports the changes in the cumulative travel cost of users as their cumulative travel mileage increases under different travel options, and (b) reports the relative travel costs per 100 km for each of the four types of car-sharing compared to taxis (on the left y-axis, it shows the difference between car-sharing and taxis for each 100 km, and on the right y-axis, it shows the ratio of the difference between car-sharing and taxis for each 100 km to the travel cost of taxis).

Comparison of cumulative travel costs of car-sharing and taxis in the medium-long-distance travel scenario (a) reports the changes in the cumulative travel cost of users as their cumulative travel mileage increases under different travel options, and (b) reports the relative travel costs per 100 km for each of the four types of car-sharing compared to taxis (on the left y-axis, it shows the difference between car-sharing and taxis for each 100 km, and on the right y-axis, it shows the ratio of the difference between car-sharing and taxis for each 100 km to the travel cost of taxis).
Figures 7 and 8 illustrate the comparison of users’ cumulative travel costs when using taxis and car-sharing, for the recreational and non-recreational travel scenarios, respectively. In both travel scenarios, taxis only have a cost advantage over Togo, and are at a competitive disadvantage compared to the other three types of car-sharing. As can be seen from the figure, the travel cost of taxis is about 20.6% lower than that of Togo, while Gofun, Evcard, and Dacheng are on average about 23.6%, 10.7%, and 4.1% cheaper than taxis, respectively. For cities like Beijing, which have rich tourism resources, the total number of tourists having leisure and entertainment as their main travel purposes amounts to hundreds of millions of trips each year. Car-sharing companies should pay attention to the potential market for car-sharing in tourist cities and aim to proactively meet the leisure and entertainment travel needs of users.

Comparison of cumulative travel costs of car-sharing and taxis in the recreational travel scenario (a) reports the changes in the cumulative travel cost of users as their cumulative travel mileage increases under different travel options, and (b) reports the relative travel costs per 100 km for each of the four types of car-sharing compared to taxis (on the left y-axis, it shows the difference between car-sharing and taxis for each 100 km, and on the right y-axis, it shows the ratio of the difference between car-sharing and taxis for each 100 km to the travel cost of taxis).

Comparison of cumulative travel costs of car-sharing and taxis in the non-recreational travel scenario (a) reports the changes in the cumulative travel cost of users as their cumulative travel mileage increases under different travel options, and (b) reports the relative travel costs per 100 km for each of the four types of car-sharing compared to taxis (on the left y-axis, it shows the difference between car-sharing and taxis for each 100 km, and on the right y-axis, it shows the ratio of the difference between car-sharing and taxis for each 100 km to the travel cost of taxis).
To summarize, there are two main characteristics of the cumulative travel costs of users’ taxi and car-sharing trips in the special travel scenarios studied.
(1) The travel cost advantages of car-sharing and taxis differ for the different travel scenarios, but the travel cost advantages of the four different types of car-sharing remain essentially the same. From Figures 3(a), 5(a) and 6(a), it is clear that taxis are more cost-effective for short-distance travel, while car-sharing is more cost-effective for peak period travel and medium-long-distance travel. However, for the four types of car-sharing, the travel costs basically go from Togo, to Dacheng, to Evcard, to Gofun, in descending order, across all scenarios.
However, the differences between the travel costs of the four types of car-sharing vary greatly across the travel scenarios. As shown in Figures 3 and 5, the differences in travel costs between Togo, Dacheng, Evcard, and Gofun in the peak travel scenario are about 16.2%, 5.4%, and 8.2%, respectively, while the travel costs of Dacheng and Evcard are almost the same in the short-distance travel scenario, while the travel cost differences between Evcard, Gofun, and Togo become larger (about 23.5%).
(2) Regardless of whether car-sharing or taxis have a greater travel cost advantage, the travel cost disparities between the two become larger, in each travel scenario, as the cumulative distance traveled by the user increases. According to Figures 3 to 8, it can be seen that the average difference in travel costs between taxis and car-sharing is about 15.76%, with the difference between taxis and Gofun being the largest (about 34.69%). Moreover, the differences in travel costs between the four types of car-sharing are also large. For example, Togo and Gofun have the largest difference in travel costs, at about 51.4%. Thus, it seems that users’ travel mode choice under short-term irrational preferences will have a greater impact on the cumulative travel cost over the long run.
Discussion
Car-sharing is one of the most representative products of sharing mobility. With the empowerment of technologies such as self-driving and new energy, the intelligent service level and low-carbon environmental performance of car-sharing will improve (Liu et al., 2022). However, as an innovative mode of travel, the emergence and development of car-sharing is bound to trigger competition with traditional transport modes. Therefore, clarifying each one’s competitive advantages and limitations in the market, and exploring proposals for their integration, will play an essential role in the future sustainable development of urban transportation systems. This paper takes car-sharing and taxis as the research objects, and compares and analyzes the travel cost advantages of the two transportation modes under multiple scenarios, from the perspective of long-term travel costs under user preferences. In the following, we will compare the results with those of previous studies, and discuss the competitive strategic options and integrated development solutions for car-sharing and taxis.
Comparison with Previous Practice
Regarding car-sharing and taxis, previous studies have mainly explored the competitive advantages of both business models from the perspective of their social value. It is widely believed that car-sharing has advantages in alleviating urban traffic congestion and air pollution (Deryabina & Trubnikova, 2021; Jain et al., 2022). For example, as the level of sharing services increases, Ke et al. (2019) argue that the car-sharing model will generate positive spillover effects that will effectively increase vehicle utilization and reduce the total number of urban cars. Meanwhile, Vélez and Plepys (2021) find that car-sharing influences residents’ travel habits and contributes to low-carbon urban transportation patterns. This study is an extension of the research of Dong et al. (2020) and Hu et al. (2020). Based on a comparative study of the travel costs of single car-sharing and taxi journeys, we construct an irrationality hypothesis and pay more attention to the cumulative effect of travel costs under different travel preferences of users. Besides, with the development of big data and the IoT, each car-sharing online platform uses a different pricing strategy, instead of there being uniform pricing (D. Zhao et al., 2022). In this paper, we extend a single car-sharing pricing method to multiple car-sharing pricing methods, quantify the differences in cumulative travel costs for users under these multiple car-sharing pricing methods, and provide a reference for users’ car-sharing choices.
However, the findings of this study regarding the competitive advantages of car-sharing and taxis differ somewhat from previous studies. We find that taxis have greater travel cost advantages in short-distance travel scenarios, while in medium-long-distance travel scenarios they gradually become less advantageous and car-sharing become more cost-effective. This is consistent with the findings of Dong et al. (2020). In fact, the travel cost advantages of the two modes are more relevant to the operating and pricing models. Compared to the self-service model of car-sharing, taxi cruising undoubtedly adds additional operating costs for drivers (Feng et al., 2022). Taxis partially pass on such costs to users, especially for medium-long-distance trips, through empty cruise fees (an empty cruise fee is added for trips greater than 15 km), increasing the travel costs of medium-long-distance users and reducing the competitiveness of taxis over those travel scenarios. Additionally, we find that car-sharing has a significant travel cost advantage over taxis for peak-period travel, but this seems inconsistent with (Hu et al., 2020), who finding that peak-hour trips in taxis are more cost-effective. This is primarily due to the different pricing methods of car-sharing selected for that study. Hu et al. (2020) selected the most representative “time + mileage” pricing method for car-sharing, while we selected various pricing methods, including the Evcard pricing method that is based on a basic fee, etc. As a whole, car-sharing is priced based on travel mileage and time, but differences in the pricing per mile and pricing per time make the travel costs of car-sharing sensitive to the mileage and time of an order in different ways. Traffic is more complex during peak hours than at other times, with residents having greater uncertainty about mileage and duration (due to waiting or detours due to traffic congestion or accidents). As a result, the multiple pricing methods of car-sharing produce differences in its travel cost effectiveness during peak travel.
Competitive Strategy Options for Car-Sharing and Taxis
On the one hand, clarifying the application scenarios in which car-sharing has cost advantages, and focusing on its competitive-advantage market, is conducive to its promotion and development. Although our study shows significant travel cost advantages for car-sharing in both peak and recreational travel scenarios, this comparative advantage does not yet seem to be understood by most residents, and the trust in and usage rates of car-sharing are low (Dias et al., 2017). Car-sharing companies should improve their platform designs and marketing programs in a targeted manner, highlighting the advantages of car-sharing in terms of travel costs, and create positive psychological expectations and attitudes towards car-sharing use among residents. On the other hand, implementing diverse and dynamic pricing strategies could create personalized incentives for users, and improve car-sharing utilization, which would also contribute to the coordinated development of car-sharing and other transportation modes. Currently, the utilization rate of car-sharing is still low (Boyaci et al., 2015), its functional value underutilized, and its potential for improving urban transportation and space utilization not obvious. The implementation of a scenario-based dynamic pricing strategy would not only provide price incentives based on users’ willingness to pay (Feng et al., 2022) and increase the utilization of car-sharing, but also reduce the pressure on urban traffic and better meet the growing travel demands of residents. For example, for peak periods and holidays, when travel demand surges, implementing dynamic pricing based on travel cost advantages would be beneficial in prompting a shift of some of the taxi demand to car-sharing, thereby reducing the pressure on taxi transportation and promoting the two modes’ coordinated development.
Nowadays, smart mobility platforms for services such as car-sharing are greatly impacting the market share of taxis. Taxis should rethink their core competencies, deepen industrial reform and effectively improve service quality in order to cope with the market pressure from new transportation modes. Statistically, Chinese taxis provided about 27.56 billion trips in 2022, down nearly 10 billion trips from 2019. From the results of our study, it can be seen that taxis do not have a travel cost advantage over car-sharing in many scenarios, such as medium-long-distance and peak travel (Figures 3 to 8). Confronted with severe market challenges, taxis should speed up the reform of their digital operations and implement a fare adjustment mechanism (Qian & Ukkusuri, 2017), deepen their advantages, and establish a dynamic monitoring and adjustment mechanism. Meanwhile, taxis’ scale and share of the urban transportation system should be re-planned so as to be gradually integrated into and developed alongside the new transportation modes. For example, based on the travel cost advantage of short-distance travel by taxis, suppliers should focus on the short-distance travel market. Regarding problems such as illegal taxi charges, the relevant departments should comprehensively consider operating costs, traffic conditions, etc. and perfect the dynamic adjustment of freight rates, strengthen the supervision of charges and irregularities. In short, taxis are still an important part of the urban transportation system, and accelerating industry reform and imposing stricter market regulation will be key to improving the competitiveness of taxis.
Practical Implication
This study empirically reveals the structural advantages in travel costs for carsharing and taxis across different travel scenarios. However, these advantages must be translated into actual competitiveness and promote orderly market development through refined policy design. It is recommended that policymakers innovate institutional supply in the following three aspects.
Construct a classified price regulation system to guide rational market competition. Given that taxis have a natural cost advantage in short-distance scenarios (due to the flag-fall pricing model), while carsharing holds a significant advantage in medium-to-long-distance/peak-hour travel (averaging 15.76% lower than taxis), differentiated management should be implemented: Introduce a short-distance mileage cap price for taxis (e.g., fixed charge within 5 km), and set a medium-to-long-distance fare ceiling for carsharing (referencing London's graded ride-hailing standards); Mandate service platforms to display real-time cost comparisons for multiple modes in typical travel scenarios (e.g., 10 km commute); Establish a dynamic adjustment mechanism for concession fees, linking carsharing operators' fee benchmarks to their vehicle utilization rate (e.g., fee reductions when utilization falls below 60%) to prevent market disruption from low-price dumping. Such policies can correct distorted price signals and encourage users to optimize choices based on true costs.
Implement coordinated road rights-carbon rights policies to amplify the external benefits of carsharing. To address the issue where carsharing’s peak-hour cost advantage is easily diluted by congestion (e.g., Gofun saves 34.69% but actual travel time increases), innovative traffic resource allocation mechanisms are needed, Grant new energy carsharing vehicles partial priority for bus lane rights (Malafe et al., 2022), allowing their use during off-peak hours; Include carsharing in urban congestion charge exemptions (emulating Singapore’s 2024 new regulations), while requiring traditional fuel-powered taxis to pay in full; Establish a user carbon account system, converting the emission reductions from carsharing trips into tradable credits redeemable for central district parking fees or rentals. Such coordinated design can transform the positive environmental externalities of carsharing into economically perceptible benefits for users, strengthening its competitive advantage.
Establish an algorithm transparency governance framework to ensure a fair competitive environment. Cost disparities caused by different pricing models (e.g., Togo being 41% higher than Gofun) exacerbate user decision-making difficulties due to the algorithmic black box, necessitating regulatory intervention, Mandate operators to open historical pricing databases for 6 core scenarios (peak/off-peak, short/medium-long distance, etc.); Introduce third-party algorithm auditing bodies to regularly test whether dynamic pricing models exhibit geographic discrimination or user profile-based surcharges; Develop a public-interest price comparison platform led by the government, integrating multi-operator data and providing real-time cost simulation services (drawing on Berlin’s MaaS platform experience). Empower users through data to reduce decision-making costs (Kimiagari & Baei, 2022) and prevent platforms from exploiting information asymmetry to implement monopoly pricing.
Conclusion
The global growth of the car-sharing industry has enriched the mobility of residents and triggered market competition with the traditional taxi industry. This study measures the cumulative travel costs of users’ car-sharing or taxi trips for the overall case and for various special cases (peak and off-peak travel, short-distance and medium-long-distance travel, and recreational and non-recreational travel), from the perspective of long-term use, and user preferences based on Monte Carlo simulations. Also, a comparative analysis of travel scenarios in which car-sharing or taxis have a competitive advantage under different car-sharing pricing methods is presented.
Based on this, we have found that car-sharing has a travel cost advantage over taxis, in general. Gofun has the largest travel cost advantage, being about 22% cheaper than taxis on average. The travel cost advantage of car-sharing is heavily influenced by the pricing model, with nearly a 41% difference found between Togo and Gofund’s travel costs. For the special cases, the travel cost advantages of car-sharing versus taxis are found to vary across travel scenarios. In general, taxis have a significant travel cost advantage for short-distance travel, while they are at a competitive disadvantage in the peak-hour and medium-long-distance travel scenarios. The travel costs of the four car-sharing pricing methods are highest for Togo, and then decrease for Dacheng, Evcard, and Gofun, respectively, with Dacheng, Evcard and Gofun having significant travel cost advantages for peak travel, medium-long-distance travel and recreational travel. Overall, car-sharing is about 15.76% cheaper than using taxis, on average. In particular, Gofun shows the most significant advantage, with travel costs approximately 34.69% lower than those of taxis.
By quantifying the travel costs of car-sharing and taxis under different travel scenarios, this study analyzes the travel markets in which car-sharing and taxis have respective competitive advantages, and proposes corresponding market competition strategies for the taxi and car-sharing companies. Our study will be of great reference value for car-sharing and taxi companies, for defining their core competitive markets and developing them in a coordinated manner. However, this paper still has some limitations in terms of the research process. It focuses on the competitive advantages of car-sharing and taxis from the perspective of travel cost. In fact, functional value and social value are also important factors that affect their competitiveness. Also, this paper explores the market competition between car-sharing and taxis using Beijing as an example, but the competitive situation may be different in other regions due to differences in their pricing methods based on the transportation development level and residents’ ability to consume such transportation modes. Therefore, in the future, we will further explore the competitive advantages of car-sharing and taxis in different cities, and based on other aspects such as functionality and service quality.
Footnotes
Funding
The authors disclosed receipt of the following financial support for the research, authorship, and/or publication of this article: This research is funded by the programs of the National Natural Science Foundation of China (Grant: 72374129), the Social Science Planning Project of Shandong Province (Grant: 25BGLJ05) and the National Natural Science Foundation for Young Scientists of China (Grant: 71904110).
Declaration of Conflicting Interests
The authors declared no potential conflicts of interest with respect to the research, authorship, and/or publication of this article.
Data Availability
The data that has been used is confidential.