
Abstract
This study examines how morphological changes in and around Hendek, Turkey’s medieval urban core affect place attachment. Archival maps, pictures, and aerial photography were evaluated to trace the city’s urban fabric and the role of commonly used public spaces in defining metropolitan identity. A standardized questionnaire and onsite observations were used in the mixed-methods study of 136 participants. IBM SPSS 25 evaluated quantitative data, while IBM SPSS AMOS used Structural Equation Modeling (SEM) with PATH analysis to explore key variable correlations. The findings show a considerable negative correlation between morphological change perceptions and place attachment, particularly in Hendek Square. Long-term residents had stronger emotional links to central public areas, while age, life stage, and use frequency affected attachment and change perceptions. Results indicate that urban morphological change may diminish collective memory and emotional relationships with the built environment. Thus, place attachment must be integrated into urban planning and regeneration strategies to create socially cohesive, inclusive, and resilient communities because people are more likely to protect and improve places they care about.
Plain Language Summary
This study looks at how changes in the physical structure of cities such as the redesign of streets, squares, and public spaces affect how people feel about where they live. We focused on open urban spaces like city centers, squares, and parks, as these places are where people often build strong memories and connections. To understand this relationship, we used old maps, photographs, and aerial images to see how the city has changed over time. We also observed public spaces, conducted interviews, and surveyed residents about their feelings of attachment to the city and its central square. We analyzed the results using statistical methods, including a detailed PATH analysis, to see how different factors influence people’s emotional connection to their city. The results showed that major physical changes in the city can weaken people’s sense of belonging and their emotional ties to their environment. However, these feelings are also shaped by other factors like social relationships, age, and how often people use public spaces. We also found that people who feel a strong attachment to a place are less likely to want big changes. The study shows why it is important for city planners and decision-makers to think about residents’ emotional connections to public spaces when planning new projects. By protecting the memories and identity tied to urban spaces, cities can become more livable, welcoming, and socially connected.
Introduction
Cities, as living entities, carry the traces of past experiences while transferring accumulated knowledge to shape the future (Lynch, 1960; Rossi, 1982). Comprising interconnected and adaptive elements, they function as complex systems (Batty, 2008). These networks manifest in everyday life as urban structures that define the spatial and social boundaries of human activity (Carmona et al., 2010).
Urban spaces are dynamic arenas where individuals live, work, and interact, collectively shaping cultural identities and fostering innovation despite various challenges (Relph, 1976; Tuan, 1977). The intergenerational transmission of memories and cultural practices significantly influences the formation and evolution of these spaces (Lewicka, 2008; Scannell & Gifford, 2010). This reciprocal relationship is evident as people shape their environments according to their needs and values, while urban settings, in turn, influence social behaviors and lifestyles (Alexander et al., 1977; Hidalgo & Hernández, 2001). Public spaces such as squares and streets, where individuals from diverse backgrounds intersect most frequently, are critical to understanding this interaction (Carr et al., 1992).
Historical memory embedded in urban artifacts, spatial forms, and collective rituals anchors city identity and guides its morphological continuity (Conzen, 2004; Whitehand, 2001). Göregenli (2010) emphasizes that environmental design research plays a vital role in producing legible and livable urban environments through appropriate standards. However, as Manzo and Perkins (2006) note, the fragmented nature of disciplines addressing place attachment hinders its integration into planning: planners prioritize spatial processes, community psychologists focus on collective aspects, and environmental psychologists emphasize individual experiences (Altman & Low, 1992).
Rapid urbanization, both globally and in Turkey, underscores the need for human-centered and inclusive urban design. The Habitat-III Declaration (2016) highlights the importance of cities that foster belonging, provide accessible green public spaces, and ensure cultural and social vitality. Spatial changes resulting from population growth and shifting demand should extend beyond building densities or volumetric adjustments; their impacts on daily life must be considered. Morphological analyses can help render these transformations legible within the framework of historical continuity (Conzen, 2004; Gospodini, 2004).
Purpose of the Study
In rapidly urbanizing countries such as Turkey, neoliberal planning approaches and increasing infrastructure demands accelerate urban transformation, raising critical questions about how changes in urban morphology affect residents’ spatial memory and emotional attachment to place. Historically and culturally significant structures often anchor urban memory and place-based identity; their removal or alteration disrupts continuity and reshapes relationships with the environment (Lewicka, 2008; Scannell & Gifford, 2010).
This study examines the impact of morphological change on urban belonging and place attachment through the case of Hendek, a district in Sakarya Province experiencing rapid development and substantial spatial transformation. Recent interventions—most notably the relocation of the clock tower—have provoked public concern over the erosion of historical identity and the loss of symbolic urban elements (Ujang & Zakariya, 2015). These debates highlight the critical role of urban morphology as both a spatial framework and a vessel of collective memory.
The research aims to provide empirical insight into the interaction between physical space and memory in shaping urban identity, offering implications for urban design, heritage conservation, and participatory planning practices.
Theoretical Framework
The theoretical framework provides the structural backbone of the study, guiding the research process, clarifying objectives, and enabling the effective use of existing knowledge (Salcedo Mosquera et al., 2022). It also aids in formulating research questions and minimizing potential pitfalls (Maxwell, 2013).
Urban Morphology
In the field of architecture, which encompasses a vast array of design and structural principles, the intricate concept of urban morphology intricately engages with and thoroughly examines the various aspects of the physical structure, including but not limited to the size, shape, and overall form, of both urban and rural settlements, thereby encompassing the essential components that contribute to the formation and shaping of the city itself, as well as the delineation of open and closed areas within the urban landscape, the specific parcels of land, the buildings and blocks that occupy these parcels, the diverse plan typologies associated with these structures, the systems that define the façades, the roads that facilitate movement, the nodal points that serve as critical intersections, the boundaries that outline the various zones, and the complex relationships that exist among all of these areas in relation to one another and their interactions with other settlement areas, including the variations in their functions.
Urban morphology emphasizes the relationships between cities’ physical features and the forces that shape them (Oliveira, 2016). Urban form also carries perceptual and symbolic meanings that shape how residents evaluate and experience the city (Nasar, 1998). Urban morphology studies how historical processes shape a city’s complex growth. Moudon (1997) describes urban morphology as the study of cities as dynamic human habitats that integrate social behaviors and spatial layouts.
This perspective promotes a holistic understanding of urban surroundings, encompassing its physical aspects and cultural, economic, and social influences. Urban morphology is treated differently by Larkham, who emphasizes city complexity. He highlights urban heterogeneity, which comprises a variety of architectural styles, land uses, and historical layers that tell the city’s story. This complexity explains how cities work and change and how architectural forms affect communities (Larkham, 2006; Moudon, 1997).
Urban morphology explains city transformations, yet its spatial layouts may ignore complicated social relationships. By stressing physical structures over social connections and culture, discipline may simplify complicated human-environment relationships. Historiographic conceptions of urban layouts ignore urban planning innovation and change. Urban morphology may sustain power relations and hinder inclusive urban development by supporting conventional city shapes. Social theory and urban studies can help designers and policymakers address social and economic issues outside city form, making cities more sustainable and enjoyable. Urban studies require understanding the complex interplay of agents and processes that shape cities across time.
This comprehensive approach keeps urban morphology relevant to current concerns and encourages inclusive urban landscape knowledge. Urban morphology studies cityscapes’ intricate physical fabric and plan changes. The area studies how social, economic, and cultural changes affect these ecosystems. Kubat and Topçu pioneered urban morphology in 2009 by studying the complex relationship between spatial structures and processes. The study of historical and contemporary urban morphologies reveals development trends, planning regulations, and community reactions to changing demands and difficulties. This research increases city understanding and changes urban planning and design to meet citizen needs.
A multifaceted approach that includes physical and social dimensions is essential for addressing the many and complex complexities of urban environments and promoting sustainable development for current and future generations. Integrating physical and social factors in urban morphology is essential for designing responsive urban planning strategies that meet community requirements.
Increasing attention to the relationship between morphological change and socio-spatial behavior is praiseworthy, but such research may overemphasize micro-level urban design changes. Critics argue that the influence of street networks and building types on walkability, safety, and social cohesion is often overstated. Economic conditions, cultural dynamics, and individual behaviors shape community relationships more than urban form. Advanced Geographic Information Systems (GIS) and urban analytics may simplify complicated social concerns into numbers and overlook crucial human experience. This analytical approach may also favor technical solutions above community-driven initiatives, fostering a greater sense of safety and coherence. Morphological changes are vital, but socio-economic and cultural settings are needed to understand urban dynamics.
Place Attachment
There are many research studies on place attachment, including those in geography, architecture, psychology, and others, that examine this phenomenon in relation to spatial dimensions ranging from intimate, small-scale environments like individual housing units and local neighborhoods to much larger, expansive areas that encompass entire areas. Community is crucial to establishing a sense of belonging since personal experiences, social interactions, and the environment shape this attachment.
Place attachment is a deep, positive emotional bond between individuals or groups and a place, both collectively (communities and social groups) and individually (personal experiences and sentiments). This tie comprises stakeholders, social interactions, and local associations. Urban planning and community development depend on this emotional tie’s impact on well-being and environmental participation (Cushing & Miller, 2019). Understanding place connection helps enhance urban difficulties and social cohesiveness (Devine-Wright, 2007). Recognition of place attachment can improve urban design and planning that prioritizes community needs and enhances community-environment linkages (Devine-Wright, 2007). Metropolitan residents’ community participation and well-being depend on place attachment (Fard & Paydar, 2024). Integrating this principle into urban planning can make cities more inclusive, sustainable, and emotionally engaging. Understanding place connection helps enhance urban difficulties and social cohesiveness (Devine-Wright, 2007; Cuba & Hummon, 1993). This emotional connection contributes to an individual's place-identity, which links self-concept with the physical and social environment (Proshansky et al., 1983).
Research shows that place attachment changes with demographic, functional, and cultural changes, especially in fast changing metropolitan areas (Manzo & Devine-Wright, 2021; Wiles et al., 2020). Some researchers suggest that place attachment remains consistent over time despite demographic, functional, or cultural changes, contrary to recent studies. This shows that people’s emotional attachments with their settings are strong and resilient, even throughout urban change (Hidalgo & Hernández, 2001). Despite rapid urban transformation, communal links and historical relevance tend to survive, offering a sense of continuity and belonging (Scannell & Gifford, 2010). Thus, the idea that place attachment is changeable may ignore people’s long-term relationships with their environment.
In their groundbreaking work, Scannell and Gifford (2010) proposed a tripartite model of place attachment, “Person—Process—Place”, which gives a formal framework for understanding people’s complex relationships with their environments. The approach is theoretically sound, but it may oversimplify place attachment’s complex emotional and psychological dynamics (Lewicka, 2011).
Recent research has shown that people’s emotional bonds with specific places are declining as urban spaces become more commercialized and consumer-oriented (Relph, 1976; Zukin, 2010). Thus, urban planners and designers must recognize the complexity of place attachment to create surroundings that meet urban communities’ emotional and social demands (Sebastien, 2020).
Relationship Between Morphology and Place Attachment—Urban Memory
Looking into how residents recall municipal structures and parks will show how design and architecture effect how people feel about a place, good or negative. Beyond how urban shape affects place attachment, this study will examine how physical places and emotional relationships generate urban memory. Urban designers must grasp urban memory to comprehend how physical surroundings affect emotions and identities.
Redevelopments in several cities have revived interest in place attachment. A deep emotional bond with important locations affects human behavior and community engagement in many psychological and socio-spatial dimensions. Manzo and Devine-Wright (2021) show the importance of emotional connections to places in times of climate change and urbanization. Strong local links promote community planning and opposition to harmful changes. The study emphasizes that urban planners must consider emotions when designing areas for meaningful interactions and belonging.
Place connection is popular, however not all urban changes and redevelopments harm communities. These actions may improve infrastructure, public places, and economic opportunities for the neighborhood. Attachment to localities can delay urban progress, argue critics. Strong location connection and active local planning may ignore other important community participation features. Social networks and economic incentives may inspire people more than place nostalgia. Modernization and innovation to address climate change and urban resilience may be hindered by local features. People without emotional ties to places may be excluded. The attitudes can divide communities and undermine diversity and inclusivity. Location attachment requires adaptation and awareness of metropolitan social and economic activity.
Establishing inclusive urban environments that welcome long-term residents and newcomers and ensure diverse perspectives impact shared places requires this balancing. Urban design affects how people perceive and interact with their surroundings. Moudon’s 1997 analysis and Larkham’s 2006 findings suggest that understanding urban morphology is advantageous and necessary for understanding and interpreting cities’ various layers of urban transition. Atakara and Allahmoradi (2021) observed that contemporary research has used effective tools like GIS and space syntax to investigate urban developments and their effects on residents. Such methods allow thorough study of how street networks, building typologies, and public spaces affect urban life and social dynamics.
Urban memory and place connection remain studied. Erbaş Gürler and Özer (2013) emphasize the significance of urban memory, such as monuments, public places, and landmarks, in promoting place identity and continuity. Maintaining these memory-laden urban components during restoration increases civic participation and resilience. Urban morphology and place attachment must combine to develop community resilience and support residents’ emotional and cultural needs. Butzin and Terstriep (2022) demonstrate how emotional site connection impacts urban planning participation. They say residents who feel intimately connected to their community are more likely to influence urban policy and oppose projects that threaten its character. Hosseini et al. (2021) indicate that green areas, pedestrian-friendly infrastructure, and cultural sites might improve social interaction in regenerated urban zones. This holistic place attachment approach emphasizes community resilience and social cohesiveness during urban transitions.
Urban planners may build surroundings that reflect citizens’ identities and experiences by addressing emotional and physical qualities. Wiles et al. (2020) also provide useful information about how place attachment changes with age, particularly in later life. Their research reveals that older persons have a deeper emotional connection to familiar places, making demographic considerations relevant in urban redevelopment methods.
These studies demonstrate place attachment’s complexity and strong links to urban morphology and memory. Planning must incorporate psychological, geographical, and cultural factors as cities develop rapidly. Planners and politicians must consider urban change’s structural components and citizens’ lived experiences and emotional landscapes to create more inclusive and resilient cities.
This understanding is crucial to creating urban landscapes that meet practical needs and foster emotional attachments, creating more cohesive and resilient communities. The Turkish Language Association defines memory as “the power to store what is encountered and learnt in the mind in connection with the past.” History, past, and future are linked to memory. Urban memory occurs personally and socially, but it stores its existence in the mind through historical facts, photographic images, and places/locations.
Cities accumulate urban memory, together with the traces of its residents and historical continuity, which is space. People’s experiences shape the city’s identity (Tekeli, 1991). Thus, urban memory reflects individual opinions. Thus, society and its members shape metropolitan structure. Personal memories make up social memory, according to Ünlü (2017). Thus, urban changes affect social memories.
Layered cities help us understand the past. With present commitment, meaningful experience encompasses past values (Brown & Perkins, 1992; Ünlü, 2017). Old city landmarks preserve culture. History, consistency, and place attachment make historical locations better than modern ones. Monuments, cemeteries, iconic streets, and public buildings are urban memory. Urban reminders, from previous occupants, may change place memory by sparking interest about the past. Kim and Kaplan (2004) say city alleyways can bring back childhood memories and boost community loyalty due to their cultural and social effects. Place attachment is fostered by stability, but major changes can break it. Urban planners must understand urban memory and place attachment to build lasting, emotive settings.
Place attachments vary by person, activity, process, and place, but fulfilling human wants and desires can strengthen them (Brown & Perkins, 1992). The renewal of urban areas, which takes into account user requests, may improve attachment, but if these changes completely change the urban area and erase urban memory, attachment may be damaged in the long run.
Modernity’s rapid proliferation of cities and urban environments to respond to globalization erases urban memories with change. People who move owing to urban renewal or political/social factors feel disoriented in new neighborhoods and desire for the old. New residential areas should reflect and support the identity of the old environment, ensure the continuity of socially and culturally important elements, and foster a positive sense of belonging to avoid a sense of alienation from the city. This technique maintains urban history and gives citizens a sense of belonging, strengthening their communal bonds.
Place attachment and community attachment can explain why people accept or reject planning and design change. Tapping into group emotions helps people understand their place in society. People seek, identify, defend, and build meaningful locations due to sensory relationships. Place-attached urbanites participate in local planning and seek to develop their areas (Manzo & Perkins, 2006).
Traumatic events, despair, and poverty can reduce people’s interest in their roots, which shapes their identity. Sudden city morphological changes may cause people to forget their city and lose identity. Schools should educate the history of communities (neighborhoods, villages) and help students identify their beginnings, according to Lewicka (2005).
Modernism and rapid urbanization destroy urban memories. Many urban renewal or political/social/economic migrants feel alienated in new neighborhoods and long for the old. Urban construction that ignores alienation and memory losses can split or unite urbanites in rebuilding society. Include new features that reflect and complement the old environment, ensure the continuation of socially and culturally important aspects, and promote the sense of belonging in new settlement areas to prevent alienation from the city.
Methodology
A convergent mixed-methods approach uses quantitative and qualitative data to explore how urban morphology affects neighborhood connectivity. The quantitative part uses structured surveys to gather residents’ thoughts, feelings, and emotional ties to their neighborhoods, while the qualitative part uses careful observations and visual analyses to show how people behave, use space, and interact with their surroundings.
Both tactics are meant to complement and illuminate each other. The primary researcher and trained volunteers used Gehl’s (2013) public space evaluation checklist to collect observational data from June to August 2019. This checklist recorded crucial elements such how buildings are used, how spaces are designed, how people move around, and how easy it is to access public areas, allowing survey results to be immediately linked to this information.
The researchers aggregated and analyzed the data to quantify human thoughts about the place and understand them in the context of the apparent city plan. The mixed-method approach enhances triangulation, trustworthiness, and interpretative depth in study findings.
Urban morphological change and place attachment are assessed using a systematic theoretical framework. Four conceptual domains—urban morphology, urban memory, place attachment, and urban change drivers—form the analytical pillars. These characteristics influence urban belonging when combined (Hannah et al., 2021). We start by creating a theoretical framework to examine how urban design changes affect people’s spatial identities and emotional connections to place (Figure 1).
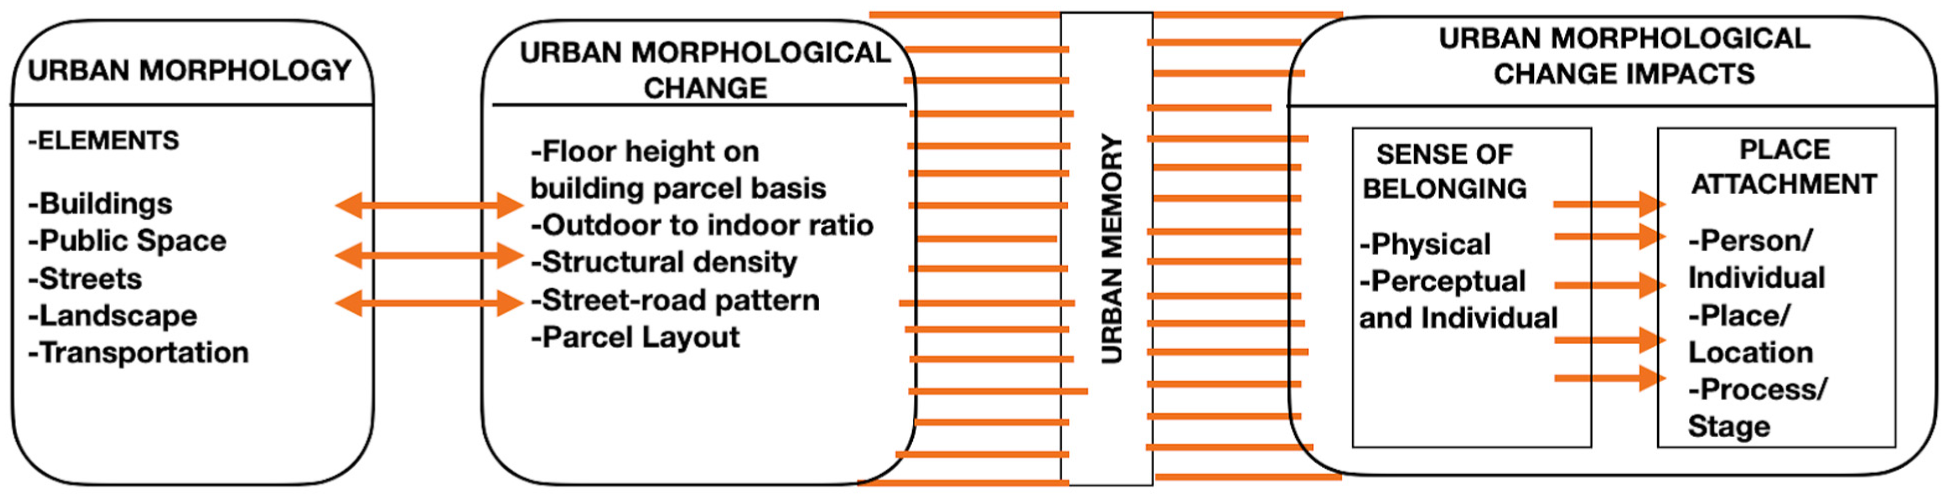
The theoretical framework of the study.
Built environments, highways, parks, and transit contribute to urban morphology. Framework shows how these aspects relate. Morphology, urban memory, and place are linked. Main structural links in the model. City changes affect communal memory, place, and spatial linkages. This suggests recursive linkages. The idea is that both processes work together. It depicts how cityscapes change but people’s belonging lasts.
How city design changes effect people’s relationship with their environment is assessed in four steps in Figure 2. First, discuss how morphological changes affect the built environment. These alterations may affect building elevations, street layouts, land parcels, and public and private space allocation. To grasp urban physical changes and analyze them, this phase is essential. Residents’ place attachment and urban physical changes are examined next. This study observes local features and employs SPSS 25 questions. We examine how physical location impacts place-related emotions and psychological relationships using qualitative and quantitative data. The next step is using these analytical methods to a real-world case study to determine how morphological changes affect place-based experiences. This contextual application verifies patterns and checks theory. Last step: results analysis and strategic recommendations. This step collects data, identifies trends, and suggests planning or design approaches to increase place attachment during urban transformation. Feedback loops between evaluation and earlier steps make the process circular. This paradigm helps sustainable and human-centered urban planners, designers, and scholars relate physical changes in the urban environment with social and emotional components of urban living.
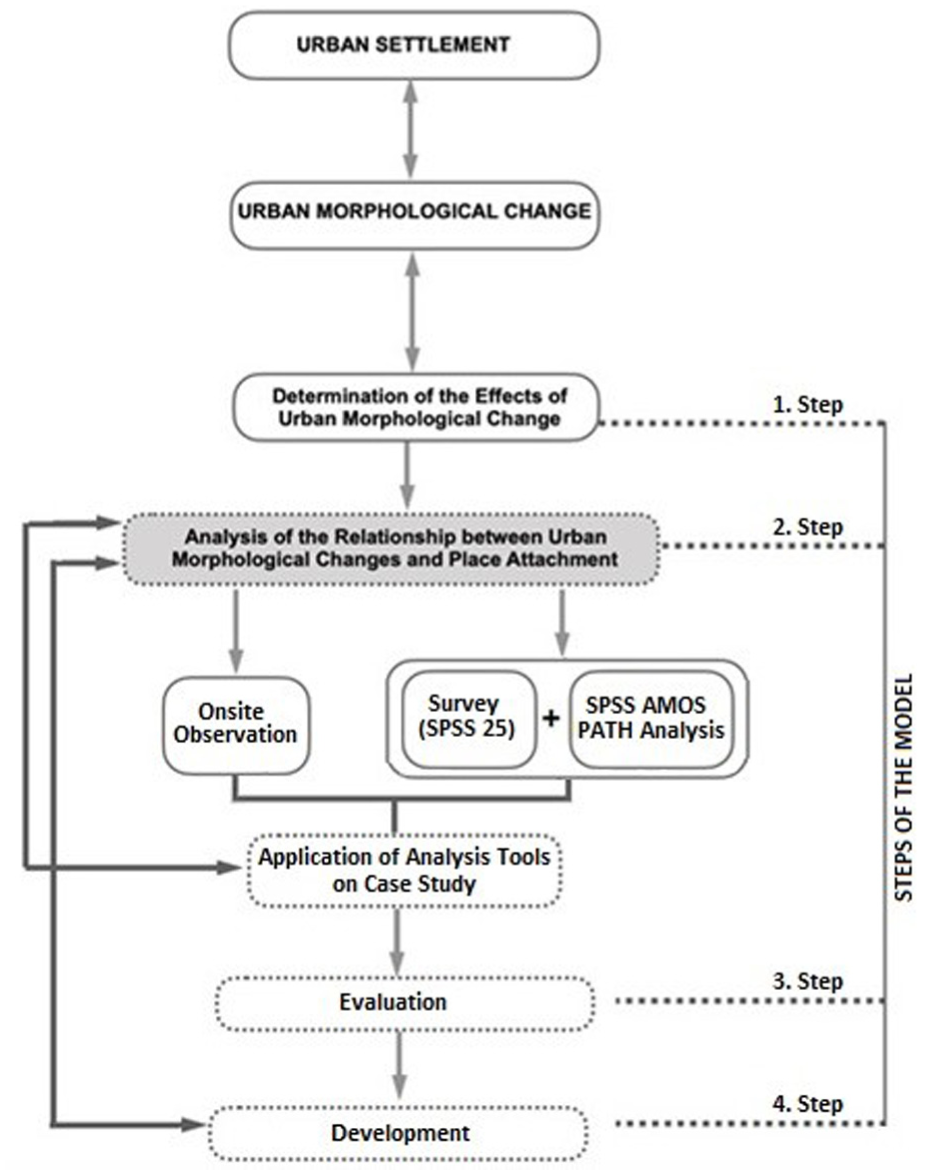
Model processing graphic.
Data Collection Procedures and Analytical Phases
This study employs multiple ways to examine how city structure and layout effect people’s relationship to their environment in Turkey’s Hendek area. Qualitative and quantitative data were collected simultaneously, evaluated separately, and integrated during interpretation for comparison.
Methodology involves three steps:
Identifying morphological changes: This step records and evaluates Hendek’s urban core’s physical and spatial changes. Historical maps, planning records, and municipal archives monitored street patterns, building density, land usage, and public space arrangements. These data provided a baseline for assessing the city’s morphology and user experience and attachment.
Assessing place attachment: A standardized survey examined residents’ emotional and cognitive ties to their urban environment in the second step. The questionnaire covered belonging, identity, and spatial change from Lalli’s (1988) Urban Identity scale and Jorgensen and Stedman’s (2001) place-related conceptions.
Analyzing the link between spatial structure and user experience: The final phase integrates morphological, survey, and central public space behavioral data. Structured observation recorded public space use, interaction frequency, and activity types (Gehl & Svarre, 2013; Whyte, 1980). This phase studied how urban morphology influences lived experiences, linking physical changes to subjective place attachment.
The study combines these three steps into a holistic methodological framework to capture both the city’s objective structural dynamics and residents’ subjective experiences, reflecting the multidimensional nature of urban transformation and place attachment.
A holistic approach combines spatial analysis, structured surveys, and direct behavioral observation in the research design. This multi-method approach assesses both the physical environment and people’s emotional and cognitive ties to it. The study combines these methodologies to better understand how spatial alterations affect user experience and place attachment across dimensions.
Study Area: Hendek District
The model’s performance in the study’s theoretical framework is shown using Hendek City Centre and its surroundings. View the relationship between location attachment and morphological changes. The old-new comparison highlights physical changes in historic Hendek city center using pictures and satellite images. Building and parcel floor heights, open/closed space ratios, structural densities, street-road images, and parcel layouts varied. Functional, geographical, and morphological changes occurred in the examined region.
The Istanbul-Ankara D-100 Motorway passes through northeast Sakarya’s Hendek neighborhood (Figure 3). Turkestan tribes named it Hendek in the 12th century. Another story states Hantek with one inn became Hendek (Hendek Municipality, URL-1, 2020). Romans, Byzantines, and Seljuks reigned, but early Britons’ artifacts are gone. Although Eastern Roman (Byzantine) tomb ruins are poorly maintained and inaccessible due to regional climate and geology, no Roman or Seljuk evidence exists. After the Ottoman Empire took possession in 1300, an inn, bathhouse, and 35 stores were built (Hendek Belediyesi, 2020; Okay, 2008).

Location of Hendek in Turkey (left), Hendek location map (right) URL2. (Halk54, 2020).
The city center’s buildings and streets draw attention since they reflect the common identity and are where urbanites dwell. Square usage increases when city center public spaces concentrate. Because these regions are where people with different sub-identities feel “Hendekli” and oneness, the poll was done there. Figures 3 and 4 illustrate city center streets with heavy traffic and city-memorable buildings and public areas.

Main axes in the historic city center.
Figure 5 shows satellite photographs of 1940, 1944, 1970, 1979, 1999, 2012, and 2019. The city center was built in the current area in 1940, and the city developed around this periphery. Between 1940 and 2019, archival maps and aerial photographs show notable morphological shifts in Hendek’s urban core, including parcel size and vertical growth.

Satellite imagery of the city center and its immediate surroundings from 1940 to 2019 (Developed from satellite images via Google Earth).
Sampling and Data Collection Process
Place attachment, urban transformation perspectives, and socio-demographic factors were measured using a standardized questionnaire. The questionnaire had these sections:
The example socio-demographic profile includes 10 components.
Urban-led questions (20 items) converted to place attachment scale: The questionnaire was updated from Lalli (1988)’s 20-question Urban Identity and other researchers’ study on belonging and environment. The survey questions were answered on a 5-point Likert scale from “Strongly Agree” to “Strongly Disagree.” Similar questionnaires have been created and analyzed in several research. Göregenli (2010) claims in his book “Environmental Psychology” that he employed Lalli’s “Urban Identity in Izmir” scale (1988, 1992) and found that it may be used as a belonging-commitment scale or three scales.
Urban Core-led questions: 10 items (based on Jorgensen & Stedman, 2001) —9-item scale on spatial change perceptions.
The poll also featured open-ended urban memory and spatial feelings questions. The number of questionnaires for the sample area was calculated using the formula in Yazıcıoğlu and Erdoğan (2004).

In 2019, the population of the Hendek district was 85,570 (Tüik, URL-3, 2020). Based on this figure, a sample size of n = 96 was calculated with the following parameters:
N (population size): 85,570
p (probability of occurrence): .5
q (probability of non-occurrence, 1–p): .5
d (margin of error): 0.1 (10%)
α (level of significance): .05, corresponding to a Z-value of 1.96 for a 95% confidence interval.
A 2019 Hendek population was utilized to calculate the research area’s population, N. This study’s d-value is 10%, the error margin. At .5 p-value for greatest variability, q was estimated. A 95% confidence level Z-value of 1.96. The minimum questionnaire takers for statistically relevant findings is n.
The study interviewed 136 local inhabitants who frequent Hendek’s city center and neighboring areas, despite the projected sample size of 96. The poll was divided into themes to better assess responses.
The questionnaire captured socio-demographic data including age, gender, and education level, but the analytical model did not include socio-economic variables like household income or job status. It was done to maintain model parsimony and focus on the hypothesized links between urban morphology, change perceptions, and place attachment (Hair et al., 2019). Given the sample size, adding these factors would have complicated the model and diminished statistical power. However, socioeconomic factors may confound attachment outcomes. The debate acknowledged this shortcoming, and future research would include such factors in the model to verify robustness and generalizability (Büyüköztürk, 2018; Karasar, 2012; Patton, 2015).
Along with the survey, systematic direct observations were employed to document how inhabitants used central public places. These observations captured user behaviors, spatial practices, and social interaction patterns using urban studies frameworks (Gehl & Svarre, 2013; Whyte, 1980). This study examined place attachment in Hendek using surveys and controlled observation. While GIS/mapping is useful for urban morphology studies, it was purposely removed from the current research design to focus on behavioral and perceptual place attachment.
Three interrelated elements composed the survey. First, demographic data such age, gender, education, city residency, and central square usage frequency was obtained. The second component assessed urban belonging, place attachment, identity, and city dedication. The third investigated those’ emotional and functional attachment to the square. In this section, respondents were asked about city center urban change and their support or disapproval.
Quantitative analyses were performed in SPSS using descriptive statistics and cross-tabulation.
The analysis has two phases:
Individual Analysis: Survey questions were assessed individually to identify trends.
Comparative Analysis: We examined responses across demographic or categorical categories to find patterns or differences.
Previous place attachment research have found that site of residence, duration of living in the city, ownership, and frequency of city use affect place attachment. Table 1 shows the questionnaire distribution to 136 urban consumers in this study.
Descriptive Statistics of Sample.
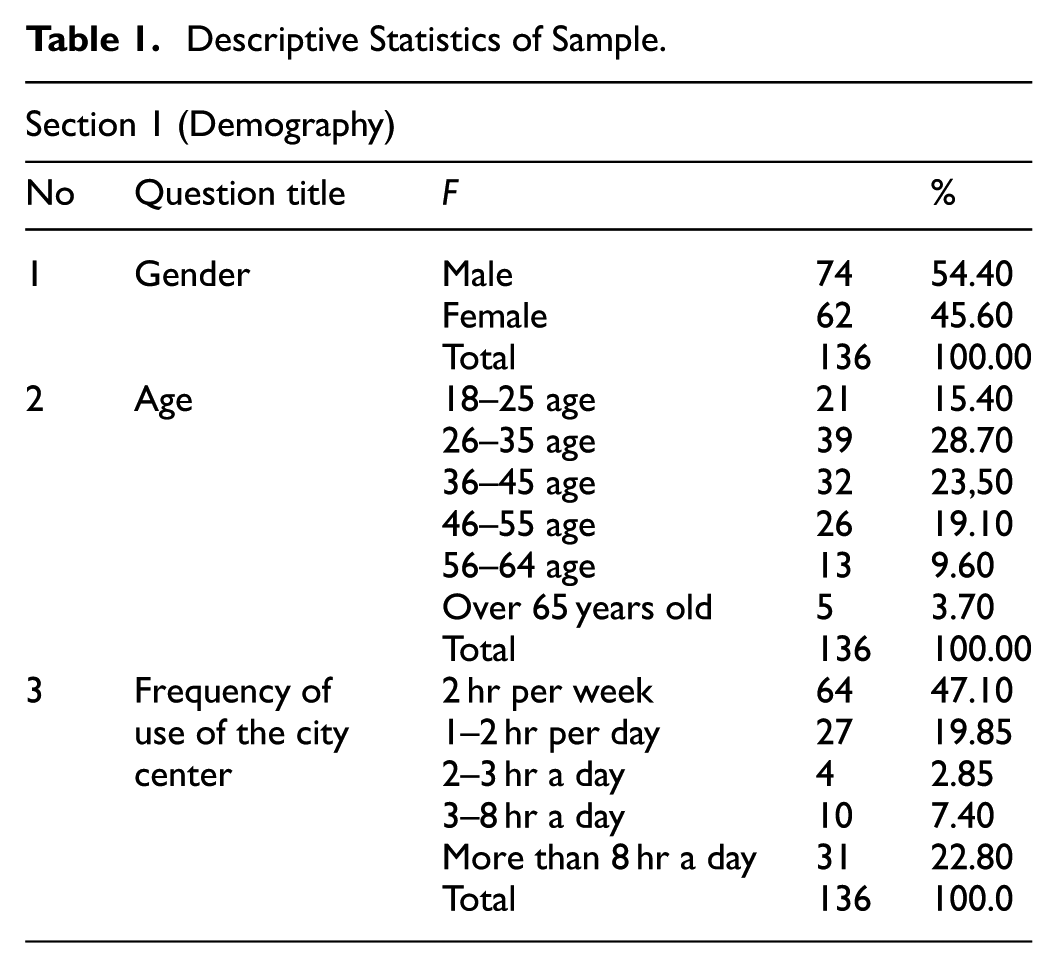
In August 2019, Hendek’s city center public places hosted the face-to-face survey. Purposive sampling was used to choose participants who frequent central metropolitan regions and represent the city’s core population.
The second step of the model analyzes place attachment changes. The case study has two sections: qualitative “onsite observations” and quantitative “survey questionnaires.” Onsite observation and survey surveys were done simultaneously and separately.
Survey questions helped us understand the sample group’s socio-demographic structure. We determined age, gender, education, living time, and personal information. We also examined square use, daily routines, environmental perception, and urbanites’ views of urban morphological changes on place attachment. These questions were based on survey questions from relevant research on place identification, attachment, sense of place, place reliance, and defining belonging. We used SPSS IBM 25 and AMOS to examine survey responses.
Onsite Observation
Structured onsite observations supplemented survey data and reduced self-reporting bias. The observation procedure was based on Gehl and Svarre (2013) and Whyte (1980), which stress public space usage behavior.
The observations examined the following factors:
Public space usage and behavior patterns,
Social contact among users,
Use of monuments like the Atatürk statue, fountain, and mosque, linked to urban memory.
The observations were conducted throughout two weeks in August 2019, on weekdays and weekends, at morning, noon, and evening. For spatial precision and systematic data collection, all observations were documented using standardized observation forms and site sketches.
The observation crew included the lead researcher and a skilled research assistant. To guarantee uniformity, field notes were compared after each observer’s independent observations. Non-participant observation allowed observers to study user behavior without disrupting the situation.
Data Analysis Method
IBM SPSS Statistics 25 and SPSS AMOS examined quantitative data. These analytical methods were used:
For the sample and variables, descriptive statistics were produced to characterize their primary characteristics.
It’s employed Spearman’s rank-order correlation to evaluate non-parametric relationships between key variables.
AMOS path analysis tested the hypothesized model and examined direct and indirect links between place attachment and change perceptions.
The scales were examined for reliability and normalcy using Cronbach’s alpha, Shapiro-Wilk test, and skewness/kurtosis values.
Variance Inflation Factor (VIF) values were generated to investigate potential multicollinearity across predictors. There were no multicollinearity concerns, confirming regression-based conclusions and model robustness.
Results
Case studies use “survey questions” for quantitative data collection and “onsite observations” for qualitative data analysis. The August 2019 questionnaire assessed 136 respondents’ demographics, attitudes, and actions. Statistics were utilized to analyze Likert scale data. Participant behavior and interactions in natural settings were observed for the qualitative section. Combining quantitative and qualitative data produced a larger perspective on the research and deep insights.
Quantitative Results
Reliability Analyses
The questions were divided into three scales: city attachment, city square attachment, and square change perception, and Cronbach’s alpha was .85 in reliability analysis. This number helps scale reliability. Cronbach’s Alpha values indicate good reliability when .60 < α < .80 and .80 is < 1.00 (Özdamar, 1999) (Table 2).
Reliability and Normality Analysis Results of the Data According to the Scales.

The scales of commitment to the city, place attachment in the public space, and sense of change in the square are very dependable with 0.964, 0.902, and 0.744, respectively.
To strengthen the measurement reliability of the variables included in the path analysis, each variable was assumed to be independent in terms of measurement error. The items constituting these variables were tested for internal consistency and reliability using Cronbach’s alpha, a method widely applied in the social sciences (Cronbach, 1951; Nunnally & Bernstein, 1994). Subsequently, the variables were operationalized as composite scores derived from these internally consistent items (Hair et al., 2019).
Thus, while the study explicitly acknowledges the limitations of purposive sampling in terms of representativeness and generalizability (Patton, 2015), the reliability of the measurement instruments employed was methodologically supported.
Normality (Homogeneity) Analyses
Firstly, Kolmogorov-Smirnov and Shapiro-Wilk tests will determine data normality. The literature favors the Shapiro-Wilk test. The Kolmogorov-Smirnov test shows no normal distribution for all three scales. The Shapiro-Wilk test demonstrates that the square scale of change is normally distributed, while the city and square scales are not. Table 2 provides Kolmogorov-Smirnov and Shapiro-Wilk p-values.
Skewness and kurtosis levels can also indicate normal distribution. Literature suggests that kurtosis and skewness values between −1.5 < x < 1.5 indicate normal distribution (Tabachnick & Fidell, 2013) and −2 < x< 2 (George & Mallery, 2010). According to another opinion, the z number should be −1.96 < z < 1.96 when dividing the skewness/skewness value by its standard error value. Histogram plots also show normal distribution. The urban commitment and civic commitment scales do not fulfill the z value derived by dividing Table 2’s kurtosis and skewness values. The city and square commitment scales’ histogram plots display non-normal distribution since the data are far from normal. Attachment to the city and square are further from normal distribution, while square perception of change data have normal distribution graphs. The city attachment and square attachment scales are tested using parametric tests. Parametric testing are useful since the square perception of change is usual.
Correlation Test
The correlation test is performed to calculate the degree of relationship between variables (Table 3).
Correlation Analysis Results According to Data Relationship Statuses.

Note. Correlation coefficients were calculated using Spearman's rho.
p < .05, **p < .01, *p < .001.
A very weak relationship between 0.00 and 0.25
Weak relationship between 0.26 and 0.49
A moderate relationship falls between 0.50 and 0.69.
A relationship between 0.70 and 0.89 indicates a high degree of correlation.
One assumes a very high relationship between 0.90 and 1.00 (Hinkle et al., 2003).
These data show a fairly significant association between city and square attachment (0.691). There is also a significantly significant association between square attachment and square change perception (0.630) (p = .000). These bidirectional significant correlations show that data impacts each other (Table 3).
Table 4 indicates a strong link between “I would prefer Hendek Square to be replaced by another square” and “I have an emotional connection with Hendek” (p < .05). Negative, inverse relationship. One value rises, another declines. This shows that when emotional attachment to the city rises, square change decreases.
Correlation Analysis Results According to the Data.

Since the frequency of square use has more than two variables and the perception of square scale shift has a normal distribution, one-way ANOVA will be utilized to find a relationship. One-way ANOVA starts with a variance homogeneity test. When variances are homogeneous, apply one-way ANOVA. Post hoc testing will reveal the age group that differs if the one-way ANOVA p-value is less than 0.05. If p > .05, age groups are not separated (Table 5).
Perception of Change in the Square and Frequency of Use One-Way ANOVA Test.

In Table 5, p > .05 indicates variance homogeneity. However, the one-way ANOVA test reveals group differentiation with p < .05. One-way ANOVA test findings show a difference between Hendek Square utilization and perception of change. A post hoc test is needed to determine which groups differentiate.
LSD Multiple Comparison test shows a significant difference between city center users who use it 2 hr a week and those who take it more than 8 hr a day (p = .013). The same test results show a significant difference between city center users who spend 1–2 hr a day and those who spend 3–8 hr (p = .012). Those who use it more than 8 hr a day perceive more change in the square than those who use it 3–8 hr a week and 2 hr a week (Table 6).
Perception of Change in the Square and Frequency of Use LSD Test.
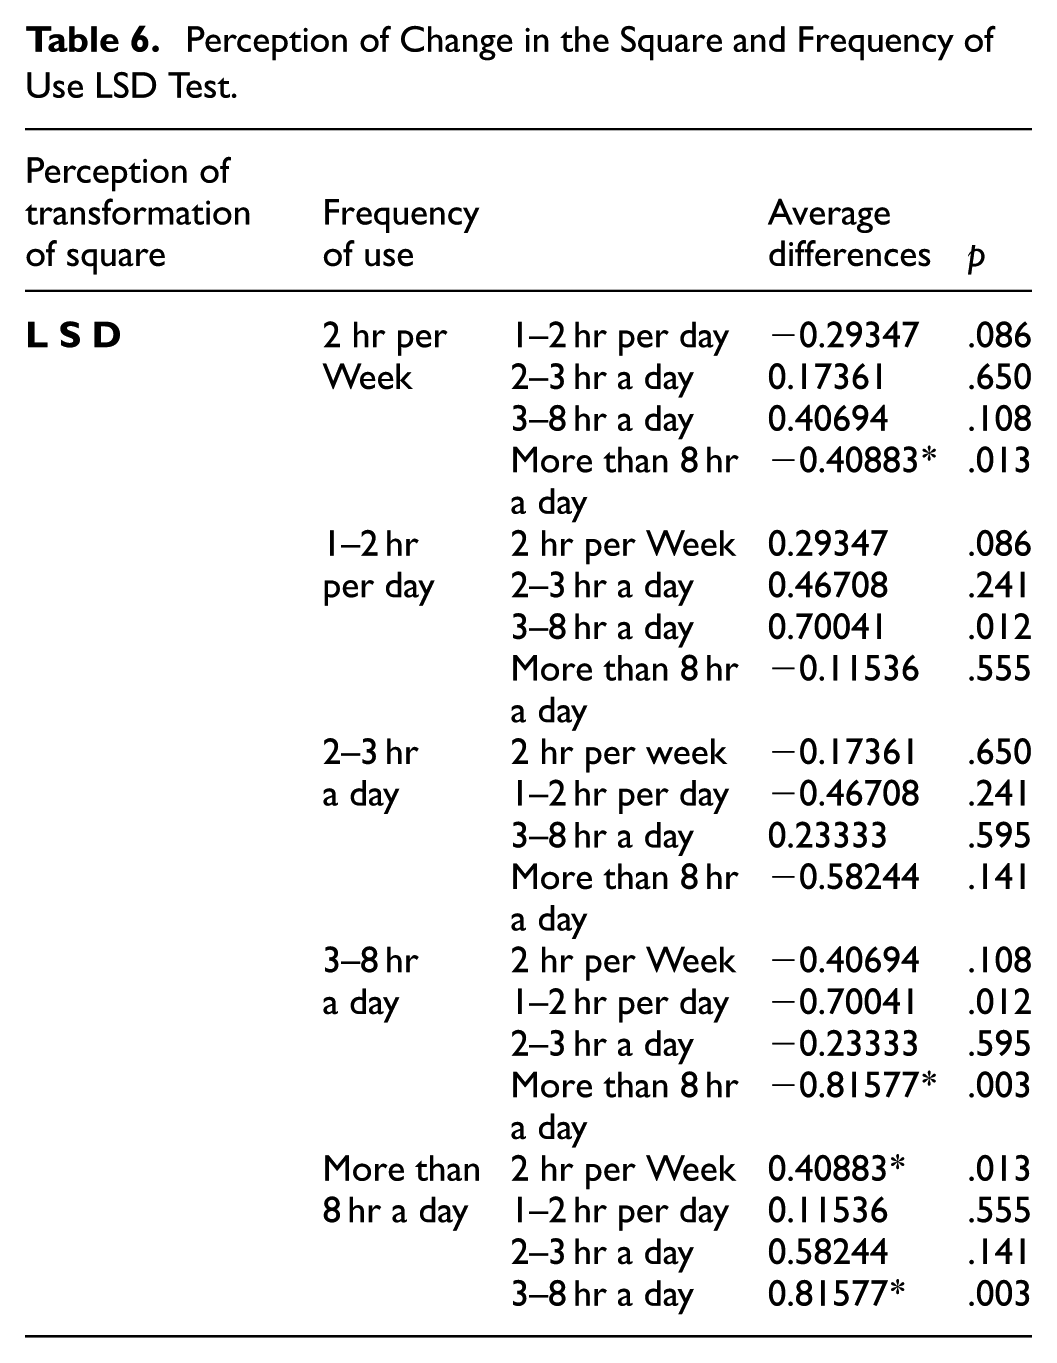
The ANOVA assumptions of normality and homogeneity of variances were met. For post hoc pairwise group comparisons, the LSD test was used due to variance equality. Perceptions were studied within groups.
ANOVA test settings were α = .05 and β = .95. The test effect size was 0.38, suggesting high statistical power. Table 7 shows that the explained variance ratio (η2 = .093) was calculated as 7.440 (between groups) / 79.177 (total sum of squares).
ANOVA (One-Way).
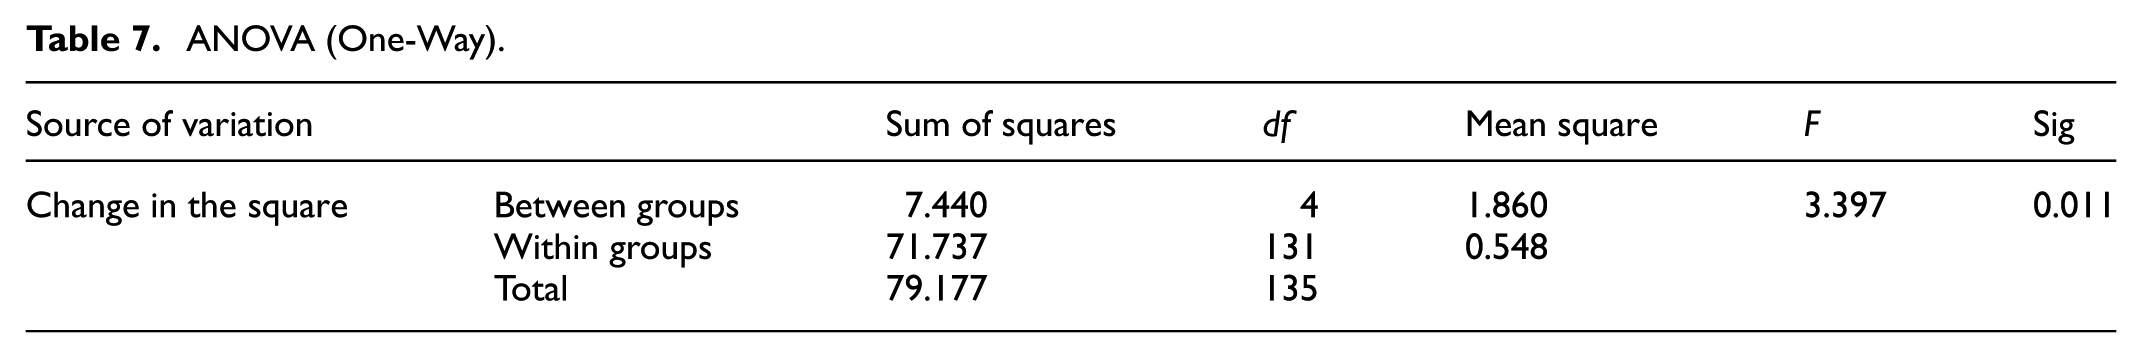
Cohen’s (1988) guidelines predict f values of 0.10, 0.25, and 0.40 for small, medium, and large effect sizes, resulting in η2 thresholds of .0099 (small), .0588 (medium), and .1379 (big). In this study, η2 = .093 falls between medium and large categories, indicating a strong explanation. Richardson (2011) emphasizes the significance of η2 and partial η2 as effect size indices in educational and social science research.
Parametric assumptions were verified before analysis. Levene’s test and Shapiro–Wilk test proved variance homogeneity and normality. The ANOVA results were valid since both assumptions were met.
The ANOVA model incorporated Place Attachment demographics. ANOVA and SPSS AMOS Path Analysis analyzed more complex conceptual relationships than variance analysis.
Path Analysis
Instead of descriptive statistical approaches and correlation analyses, this study used Structural Equation Modeling (SEM) PATH analysis to investigate causal links among variables in survey data. PATH analysis used IBM SPSS AMOS. The core constructs included in the model were as follows:
Historical knowledge (awareness of the square’s history),
Recognition and use (familiarity with and frequency of using the physical space),
Perception of transformation of the square,
Encounter and general attachment (daily social interactions and general emotional closeness),
Attachment to the square,
Attachment to the city.
This investigation models the multi-level place attachment process in the square and city, revealing structural linkages.
Regression Weights
Path analysis utilizing AMOS software showed statistically significant correlations between historical knowledge, recognition and use, perceived transformation, square attachment, and city attachment.
Table 8 shows that historical knowledge of the square strongly predicts its recognition, use, and perceived alteration (β = .623, p < .001). In addition, historical knowledge positively impacted encounter, general attachment (β = .305, p < .001), and square attachment (β = .216, p < .001).
Regression Weights of the Model.

Historical awareness and emotional bonding with the site are mediated by recognition and use, as it predicts both encounter and general attachment (β = .472, p < .001) and attachment to the square (β = .813, p < .001).
Perceived square alteration did not significantly affect attachment to the square (β = –.044, p = .087), suggesting that urban physical changes may not be sufficient to lessen place attachment
Encounter and general attachment significantly affect square (β = .066, p = .002) and city (β = .641, p < .001) attachment, indicating the connection between social contact and place-based belonging. Square attachment is a significant predictor of city attachment (β = .438, p < .001), emphasizing its symbolic relevance in urban identity.
Historical awareness, recognition and use, and interpersonal links promote square and city-scale place attachment, according to the model. These findings support relational, experiential, and memory-based spatial belonging literature (Lewicka, 2011; Scannell & Gifford, 2010).
Direct Effects
The Table 9 presents the correlation coefficients between various variables related to the urban square which indicate the direction and strength of the relationships among the variables.
Direct Effects Among Variables in the Path Model.
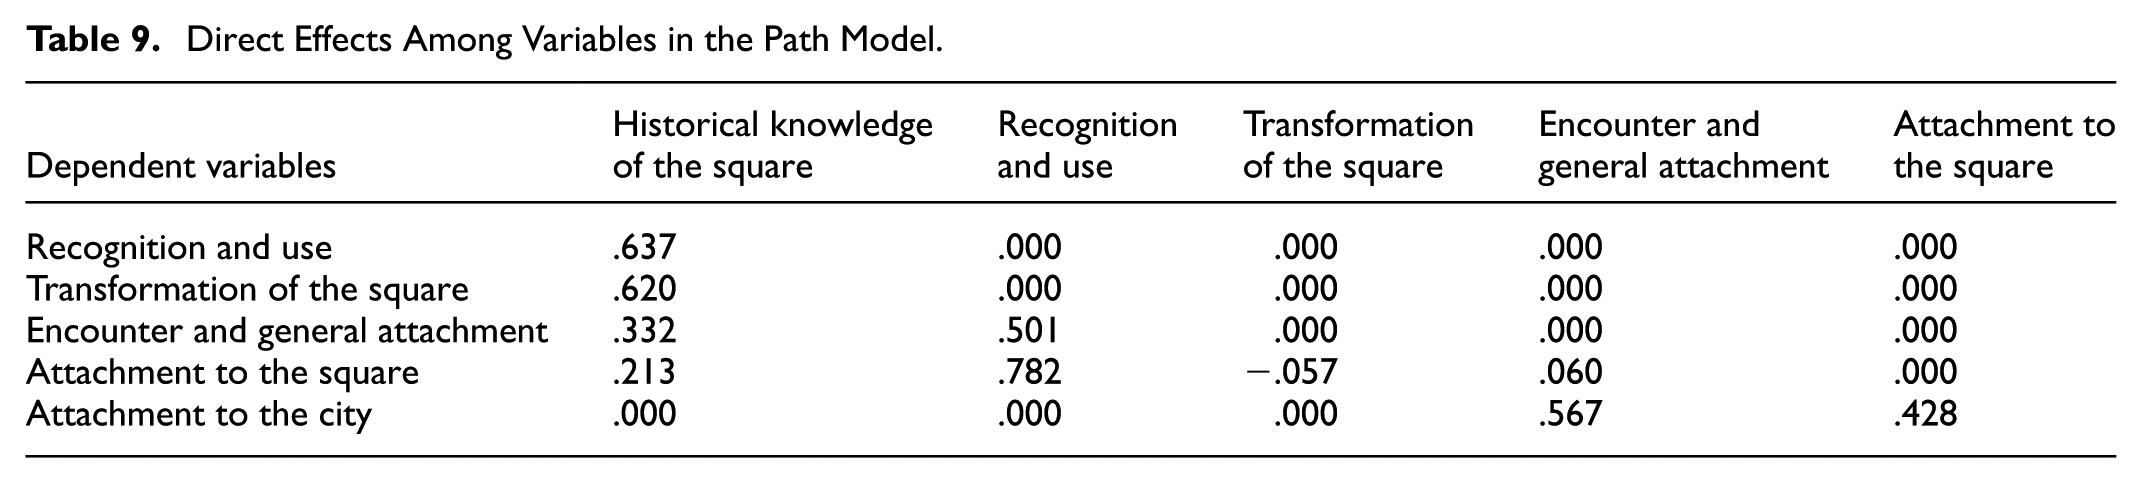
Historical knowledge correlates with other traits. Square recognition and use are strongly correlated with historical knowledge (r = .637). Higher historical knowledge may aid square recognition and utilization. Historical knowledge also improves square transformation perceptions (r = .620), encounter and general attachment (r = .332), and square attachment (r = .213). Knowledge of history did not affect city connection.
Square recognition, use, and attachment are positively correlated (r = .782). This suggests active square users feel more connected to it. A moderate positive correlation occurs between encounter and general attachment (r = .501). No significant correlations existed between this measure and others.
Attachment is weakly negatively correlated with square modification (r = −.057), but not statistically significant. Other relationships with this variable are insignificant.
City attachment is positively connected with encounter and general attachment (r = .567), indicating that public space social interactions improve mental links to cities.
Finally, city and square attachment are positively correlated (r = .428). An emotional attachment to a square may effect urban attachment.
Historical knowledge and active square contact seem to foster citywide and place-specific emotional attachment. Recognition, use, and commitment to the square show how public spaces build urbanites’ emotional and social bonds.
Indirect Effects
Table 10 shows how indirect effects of urban square variables shape people’s perceptions toward the square and the city. Historical knowledge and square recognition and use affect emotional attachment to the city through indirect routes mediated by other characteristics.
Indirect Effects Among Variables in the Path Model.

Historical knowledge had an indirect effect on encounter and general attachment (0.319), suggesting that those who know the square’s history have stronger social interactions and a stronger emotional link with it. Historical knowledge also indirectly affects square (0.502) and city (0.676) attachment. These findings show that historical memory helps strengthen emotional bonds to urban places and the city as a whole.
Recognition and utilization of the square indirectly affect city (0.632) and square (0.030) attachment. These findings show that public space knowledge and participation indirectly increase urban inhabitants’ emotional relationships.
Perceptions of the square’s transformation had a weak negative indirect effect on city attachment (−0.024), suggesting urban change discomfort or separation. If not in line with public expectations, such changes may hurt city attachment.
Encounter and general attachment both positively increase city attachment (0.026), demonstrating the importance of social connections and public experiences in urban emotional attachments. This variable influences urban attachment directly, while square attachment has no indirect effect on city attachment (0.000).
Social, historical, and spatial variables affect people’s emotional attachment to the city, according to the study. Historical knowledge and square participation patterns influence urban planning and public space design, stressing cultural and social issues.
RMR, GFI
Table 11 shows the fit indices (RMR, GFI, AGFI, and PGFI) for the default, saturated, and independence models to compare how well they fit the data.
Comparison of Model Fit Indices.

The default model’s RMR (Root Mean Square Residual) is 0.015, indicating a good fit since values below 0.05 are allowed. The independence model’s high RMR (0.565) indicates poor fit, while the saturation model fits perfectly (RMR = 0.000).
The default model’s GFI is 0.981, indicating excellent fit (values > 0.90 are preferred). The independent model performs poorly (0.286), while the saturation model reaches 1.000.
The default model’s AGFI is 0.900, indicating acceptable fit, whereas the independence model’s is 0.000, indicating no fit.
The default model has a PGFI (Parsimony Goodness of Fit Index) of 0.187, whereas the independence model has 0.204, which does not indicate superior fit given its poor performance.
The default model has good fit, structural validity, and RMR, GFI, and AGFI values.
Baseline Comparisons
Table 12 lists NFI, RFI, IFI, TLI, and CFI baseline fit indices for three structural equation models. These indices compare the tested model to a null (independence) model for data fit. Most values above 0.90 imply reasonable fit, while those above 0.95 show near-perfect fit.
Comparison of Alternative Fit Indices.

NFI is 0.992, RFI 0.971, IFI 0.996, TLI 0.985, and CFI 0.996 for the default model. These results show the model fits data effectively. The high IFI and CFI values indicate statistical validity and a significant improvement over the independence model.
The saturated model estimates all parameters and reports all indices as 1.000, indicating a potential perfect fit. Instead, the independence model shows 0.000 for all indices, suggesting no data fit.
In conclusion, the baseline comparison indices strongly support the default model as a valid and reliable structural model that fits the data well.
RMSEA
Table 13 shows RMSEA values for model fit assessment. Default model RMSEA is 0.087, just above the acceptable level. The 90% confidence interval (0.000–0.174) suggests model fit uncertainty. However, the PCLOSE score of 0.192 indicates that the model fits well and is acceptable.
RMSEA and Associated Fit Indices.

However, the independence model has a very high RMSEA of 0.716, indicating a poor fit. The confidence interval (0.680–0.753) and PCLOSE score of 0.000 support the model’s poor fit.
Notes for Model

Result
Minimum was achieved
Chi-square = 8,132
Degrees of freedom = 4
Probability level = ,087
Model fit is supported by the default model’s chi-square test and degrees of freedom. Having 21 different sample moments and 17 estimated parameters gave 4 degrees of freedom. The model had a chi-square of 8.132 and a p-value of .087.
The discrepancy between observed data and model-implied covariance structure is not statistically significant because the p-value exceeds .05. This means the model fits the data well and should not be discarded. According to the chi-square criterion, the default model represents the observed variable associations well.
The structural model tested through PATH analysis (Figure 6) shows that physical alterations, historical knowledge of the square, use patterns, and social contacts all affect urban space emotional attachment. According to the model, historical knowledge of the square increased recognition, use, social contacts, and attachment. Recognition and utilization directly affect square attachment and mediate social relationships.
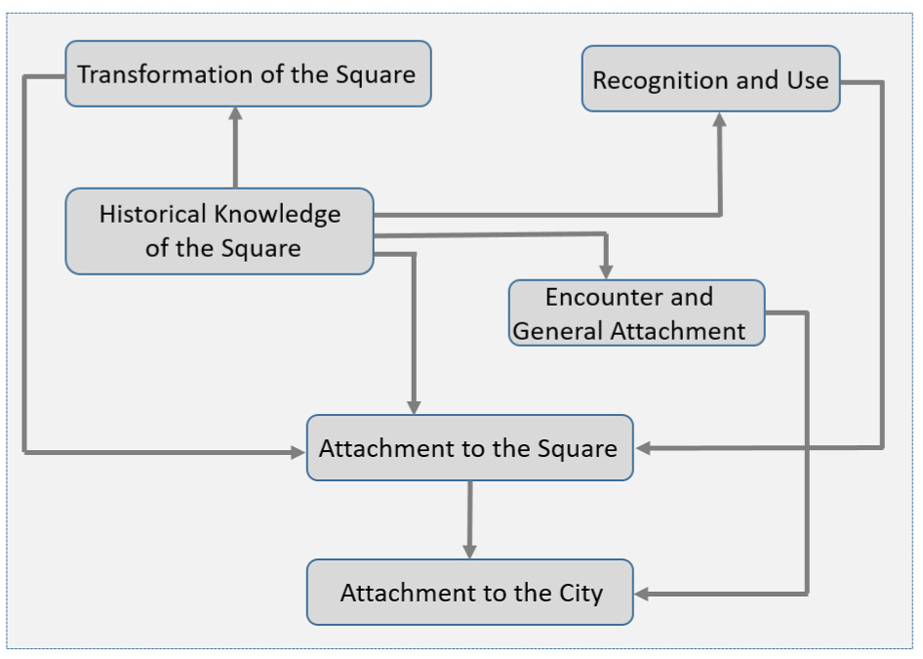
PATH analysis result model.
Perception of square transformation had a minor negative impact on attachment (p = .08), suggesting that physical transformation alone does not determine attachment. A significant conclusion is that square attachment predicts city attachment (p < .001). This shows how squares symbolize and integrate metropolitan identity.
In addition to the quantitative analysis, qualitative insights provide further insight into residents’ interactions with public spaces, offering complementary evidence that enriches the interpretation of survey-based results.
Qualitative Insights
Onsite observation was used to evaluate how city center architectural changes affect customers’ place connection (Gehl & Svarre, 2013). Systematic monitoring of public space behavioral patterns revealed how spatial change influences urban life (Lynch, 1960; Whyte, 1980). The strategy directly analyzed urban changes’ physical reflections and space use. Place attachment in a changing urban setting was better understood by onsite observation, survey, and archival research (Lewicka, 2011; Scannell & Gifford, 2010).
Gehl and Svarre’s “Public Life Observation” and Whyte’s “Behavioral Mapping” were used to strengthen qualitative findings in the observation approach. The August 2019 observation lasted 12 days, including weekends. Exploratory pre-observation, organized observation utilizing pre-defined variables including spatial behavior, interaction intensity, and time-space patterns, and field notes and spatial mapping to sketch spatial usage and temporal patterns were the three steps. Due to its symbolic value in urban memory, frequency of usage, and social contact density, Cumhuriyet Square, Ziya Gökalp Street, and Hendek’s city center’s historic mosque and Atatürk statue were chosen as observation
Each observation session employed a standardized form that included categories such as:
Physical spatial elements (e.g., historical buildings, urban fixtures such as fountains, mosque, clock tower, and statues)
User behaviors (e.g., sitting, passing through, waiting, interacting in groups)
Interaction intensity (e.g., solitary, dyadic, group use)
Time intervals (morning: 08:00–10:00, noon: 12:00–14:00, evening: 17:00–19:00)
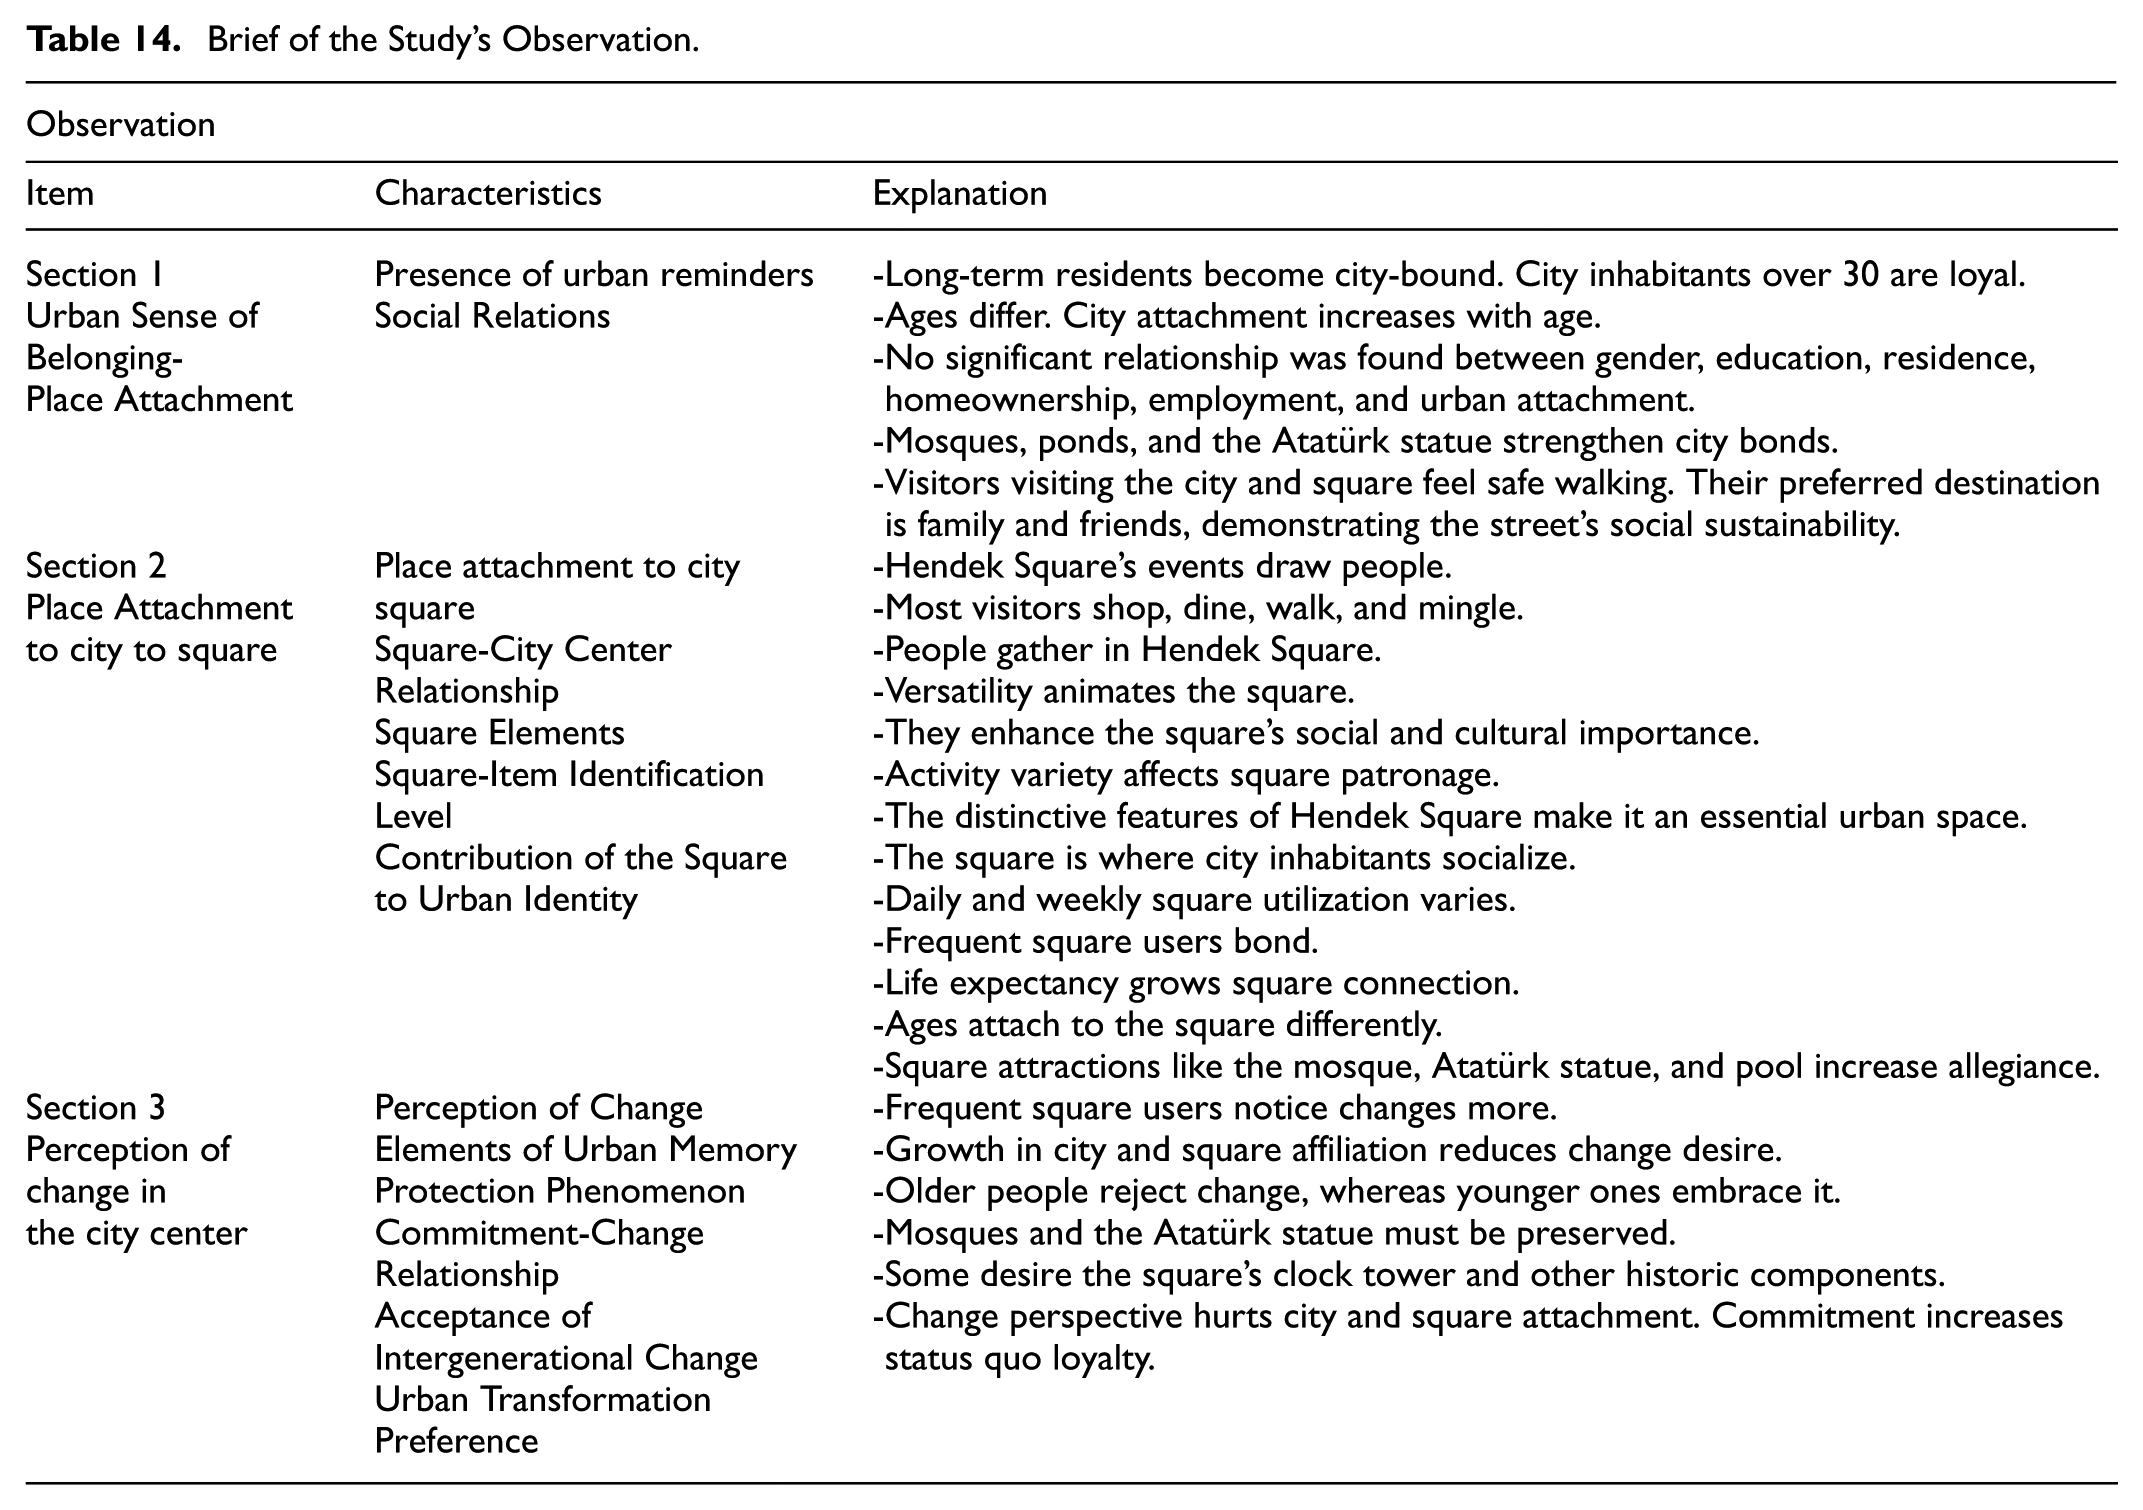
The principal researcher and a trained graduate student conducted non-participant observations. Each observer’s data was cross-checked for consistency. In accordance with ethical research guidelines, spatial behavior patterns were evaluated without recording personal or identifiable information (Table 14).
Brief of the Study’s Observation.
Discussion And Conclusion
Based on gender, life span, age, frequency of use, educational status, place of settlement, ownership, and employment position, the groups’ responses were equally valid. Square change perception, city attachment, and square attachment were examined. Table 15 indicates that city and square commitment varies by age and life period. Detailed post-hoc group comparisons and extended cross-tabulated results are provided in Appendix (Tables 16–19).
Synthesis Table Showing the Significant Relationship Between Specific Criteria.
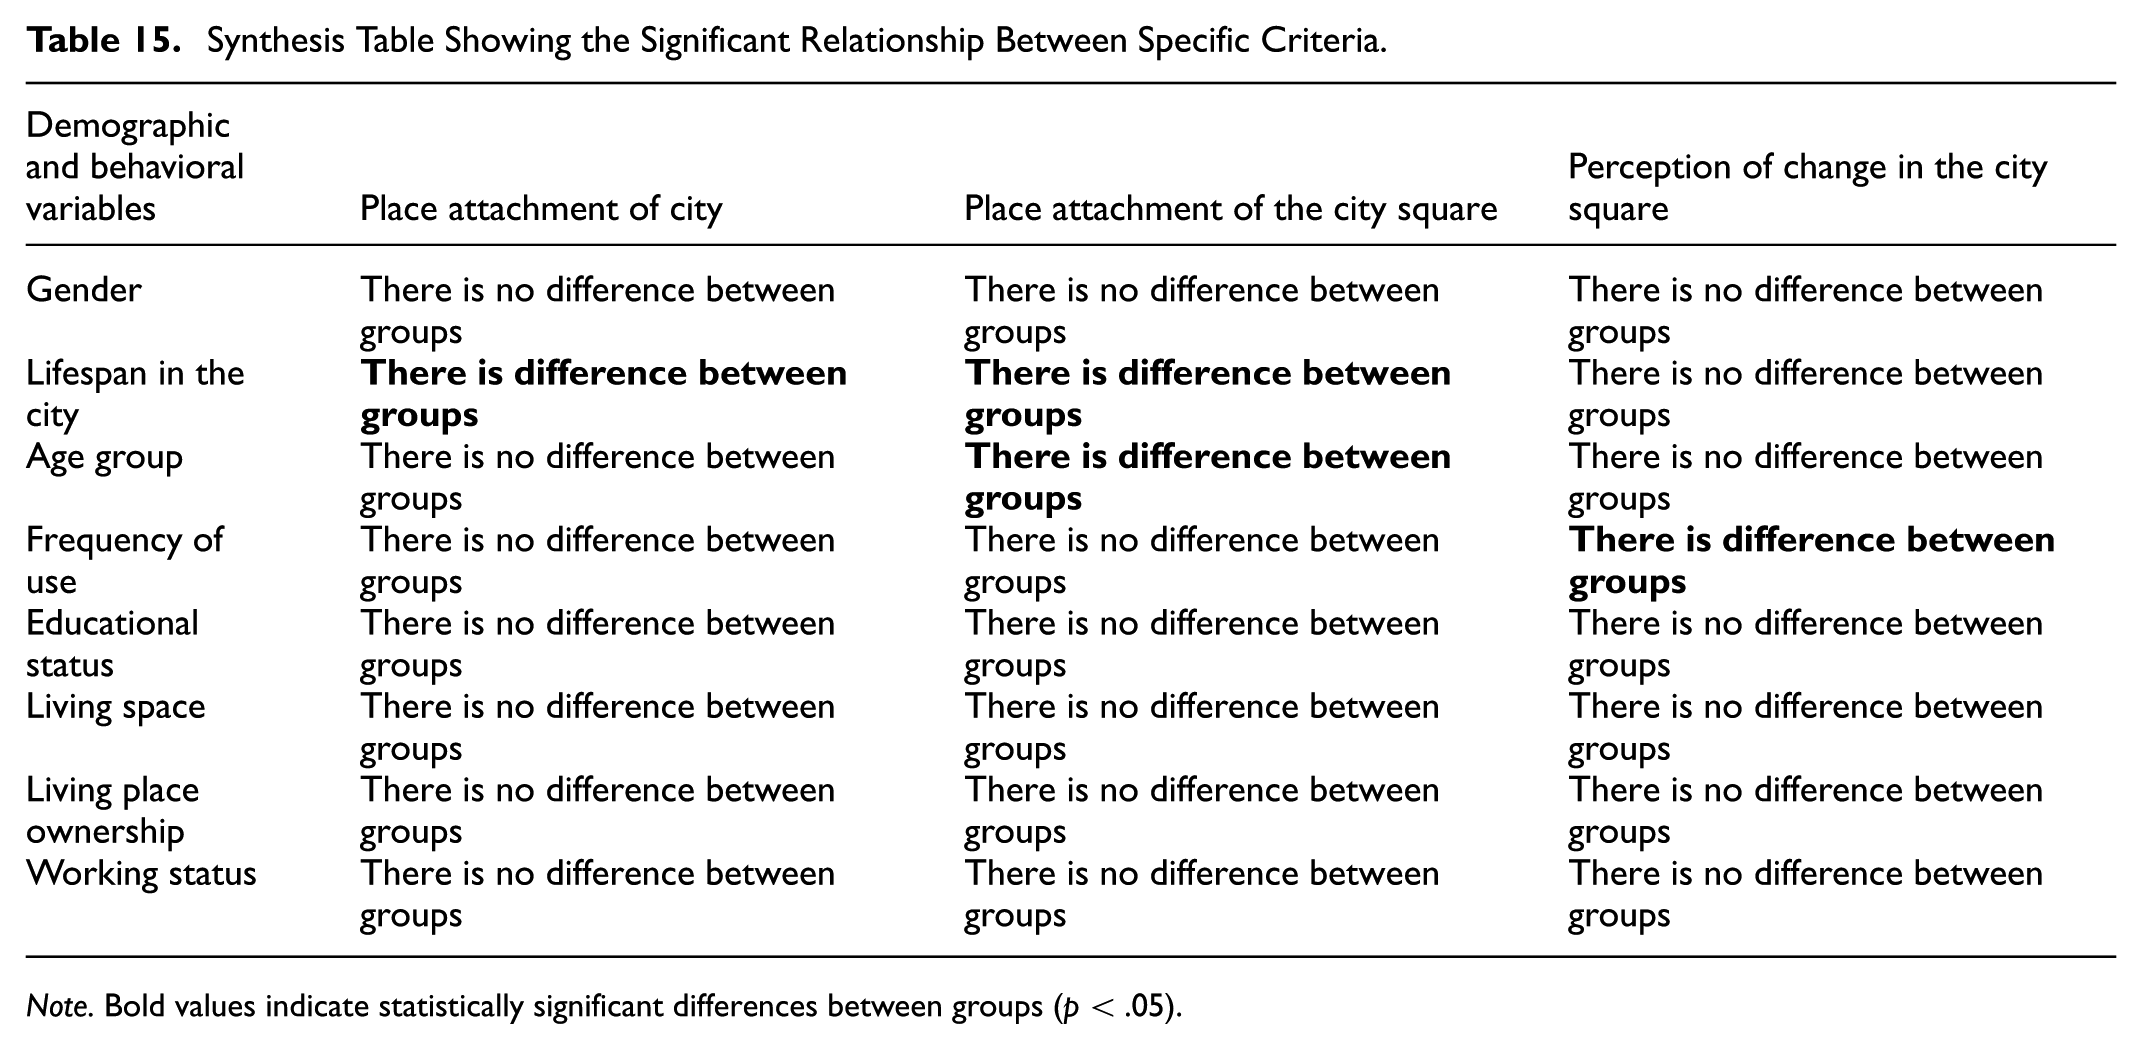
Note. Bold values indicate statistically significant differences between groups (p < .05).
City centers represent social life by providing shared areas ingrained in urban social memory, supporting various populations, and revealing societal changes. The city center was chosen for this investigation. The study evaluated the use of the “Commitment to the City Centre Scale” and “Commitment to the Square Scale” in Hendek, where the major square is also the city center.
Place attachment to the city and square is high, possibly due to city center urban reminders. Since the 1940s and 1960s, the mosque, pool, and Atatürk statue have fostered place attachment. The Şehit Mahmutbey Monument survives in the mosque garden. This monument is rated unimportant since none of the survey participants mentioned it. Place attachment is increased by structural factors that generate urban memory and evoke the past, according to study. Sites that connect people to their ancestors frequently have strong place attachment. Rebuilt towns should include historical identity characteristics to improve place attachment. The study found that urban attachment varies with life expectancy, supporting earlier findings that long-term inhabitants remain more attached to the city. Living in the city for 20 to 30 years or more strengthens urban attachment than living there for less than a year.
Life expectancy may also change connectivity to the square/urban center due to recurrent use and confidence in the familiar site. The most noteworthy example is life expectancy under 1 year compared to others. Since the square is public and where more people congregate, urban and square connection may vary by age. Life expectancy increases with age in some groups, which may raise commitment. Comparing the 56 to 64 age group to others shows effective life expectancy. Age makes people more city-loyal. Thus, they may prefer less change. Young individuals absorb change faster, therefore city transformation may not damage their allegiance.
Attachment to the city, square/urban center, and impression of square change were unrelated to gender, educational status, place of residence, home ownership status, and work position. The study may yield different results if it uses various socio-cultural groups or neighborhood/housing scales. The literature study found that home ownership improves place attachment. This study, which sampled Hendek city center, found no evidence for this. Even without home ownership, city residency or age group affects place connection more.
Perception of square change may differ between frequency of use groups since frequent users can sense changes more. Being required to work in the square may make this situation effective. People who use the square for a long period owing to requirements may not be sensitive to change.
The correlation test shows that city attachment, square/urban center attachment, and square change perception are related. The negative link between the questions, including desire for change and emotional attachment, suggests that as attachment increases, desire for change decreases and attachment weakens in situations where change happens. This suggests that city attachment is directly related to physical change.
The city’s more accessible and advantageous position compared to other cities, feeling like a city dweller, feeling emotional attachment, wondering about the city’s future, having memories of the past, having developed social relations, feeling comfortable and safe, having information about current and historical issues, and feeling familiar represent attachment to the city and the square/urban center. Square change perception questions address wanting and thinking the square has changed. Place connection reduces change and improves liking and protecting the current condition.
Users were asked open-ended questions to study urban memory structures and their favorite and least favorite features. The answers vary greatly. The Grand Mosque and Atatürk Statue are the most prominent city monuments. Photographic archive analysis demonstrates that these two aspects have remained in urban memory for a long period. Pools have long been associated with urban life, although some people like them and others don’t. Urban memory includes the clock tower. The clock tower moved. Users want the clock tower restored in the square. This shows that the square has old structures and urban traits.
As shown in Hendek, urban morphological changes affect citizens’ place connection in quickly evolving cities, particularly in historically significant public spaces like city squares. The findings demonstrate the importance of urban memory in creating a sense of belonging in public settings. Reusing existing structures and improving public spaces in context are advocated to preserve urban memory.
International frameworks like UNESCO’s Historic Urban Landscape (HUL) approach help balance development and heritage conservation. Heritage values should be incorporated into urban design, development, and conservation to protect citizens’ cultural and emotional spaces.
Actionable steps include Heritage Impact Assessments (HIAs), digital heritage inventories, and community involvement in planning, especially long-term inhabitants. Educational initiatives that promote local identity and history can also improve spatial perception and place-related emotions.
The study location was Hendek, a small urban settlement with different socio-cultural groupings but mostly long-term residents and strong local attachments. Residents’ longtime cohabitation and “Hendekli” concentration create a socially integrated urban fabric. The study found significant resident place attachment, which appears to be linked to the city’s morphological continuity and communal stability.
Place attachment was significantly correlated with perceived urban morphological structure changes. Emotional and symbolic attachments to place depend on urban dwellers’ contact with the physical space. The study found that qualitative and quantitative sensitivities to morphological transformation reflect an awareness of the built environment and affect how much people form attachments to public urban spaces and internalize urban identity.
This study uses Hendek to show how urban architectural changes affect citizens’ place connection in rapidly increasing cities, notably in city squares. The findings show that urban memory shapes people’s sense of belonging to shared urban areas. Building adaptive reuse and context-sensitive public space enhancements preserve urban memory.
International frameworks like UNESCO’s Historic Urban Landscape (HUL) approach help balance urban growth and heritage conservation. Heritage values should be incorporated into urban design, development, and conservation to preserve cultural and emotional spaces for citizens.
Heritage Impact Assessments (HIAs), digital heritage inventories, and community involvement in planning—particularly long-term residents—are among the suggested actions. Local identity and urban history education may also improve inhabitants’ spatial sense and emotional attachment to place.
Limitations exist in this study. The analytical model does not include socioeconomic variables like household income or employment status. This choice was made to retain theoretical clarity and statistical parsimony (Hair et al., 2019; Karasar, 2012; Patton, 2015), however these aspects may complicate place attachment. Second, the study used structured observations but not advanced spatial mapping technologies like Geographic Information Systems (GIS) because they were outside its scope. The study’s mixed-methods approach combined survey data with behavioral observations. Future study may benefit from GIS-based spatial analyses and a wider range of socio-economic indicators to improve robustness and generalizability (Büyüköztürk, 2018; Nunnally & Bernstein, 1994).
Supplemental Material
sj-docx-1-sgo-10.1177_21582440251385716 – Supplemental material for Evaluating Place Attachment in the Context of Urban Morphological Changes: The Case of Hendek District
Supplemental material, sj-docx-1-sgo-10.1177_21582440251385716 for Evaluating Place Attachment in the Context of Urban Morphological Changes: The Case of Hendek District by Nurşah Uzunca, İsmail Hakkı Demir and Sinem Tapki in SAGE Open
Footnotes
Appendix
Relationships Between Perception of transformation in the Square and Frequency of Use.

| Perception of transformation in the square and frequency of use | |||||
|---|---|---|---|---|---|
| Frequency-of-use groups | Average of 2 hr per week | 1–2 hr per day | 3–8 hr per day | More than 3–8 hr per day | More than 8 hr a day |
| Average of 2 hr per week | There is no difference | There is no difference | There is no difference |
|
|
| 1–2 hr per day | There is no difference | There is no difference |
|
There is no difference | |
| 3–8 hr per day | There is no difference |
|
There is no difference |
|
|
| More than 3–8 hr per day | There is no difference | There is no difference | There is no difference | There is no difference | |
| More than 8 hr a day |
|
There is no difference |
|
There is no difference | |
Note. Bold values indicate statistically significant differences between groups (p < .05). LSD and Tukey tests were used for post-hoc comparisons.
Acknowledgements
The authors would like to express their sincere gratitude to Assoc. Prof. Dr. Ömer Bilen for his valuable guidance in the statistical programming and analysis processes of this study.
Authors Note
The corresponding author was working at Sakarya University while preparing the research. Since March 2024 he continues his career at Bursa Technical University.
Ethical Considerations and Informed Consent Statements
This study involved human participants through structured questionnaires and direct observations in public spaces in the Hendek city center. In accordance with the APA Ethical Principles of Psychologists and Code of Conduct (APA, 2017) and the SAGE Publishing Policies on Research Involving Human Participants, multiple safeguards were adopted to minimize potential risks. Data collection was limited to publicly accessible areas where individuals could freely choose whether to participate, and all survey items excluded sensitive or personally identifying information. Observations were strictly non-participatory, without recording any identifiable data, and documented only anonymized behavioral patterns.
The societal benefits of the study were considered to outweigh the minimal risks to participants. Findings provide empirical insights into how urban morphological changes affect place attachment, offering evidence to guide heritage-sensitive urban planning, public space design, and socially inclusive development. For participants, the study also provided an opportunity to express their experiences and perceptions of local environmental change, potentially contributing to future planning decisions that directly affect them.
All participants were provided with oral and, when applicable, written information regarding the purpose of the research, the voluntary nature of participation, confidentiality measures, and their right to withdraw at any time without penalty. Verbal consent—and in some cases written consent—was obtained prior to participation. For the observational component, additional consent was not required since the research was conducted in public spaces where there is no reasonable expectation of privacy; nonetheless, observations were restricted to non-identifiable behaviors, in line with APA Standard 4.01 on confidentiality.
Funding
The authors received no financial support for the research, authorship, and/or publication of this article.
Declaration of Conflicting Interests
The authors declared no potential conflicts of interest with respect to the research, authorship, and/or publication of this article.
Data Availability Statement
The data that support the findings of this study are available from the corresponding author, upon reasonable request.
Supplemental Material
Supplemental material for this article is available online.
References
Supplementary Material
Please find the following supplemental material available below.
For Open Access articles published under a Creative Commons License, all supplemental material carries the same license as the article it is associated with.
For non-Open Access articles published, all supplemental material carries a non-exclusive license, and permission requests for re-use of supplemental material or any part of supplemental material shall be sent directly to the copyright owner as specified in the copyright notice associated with the article.