
Abstract
Accelerating high-quality development (HQD) within the sports industry stands as a vital measure in China’s journey to becoming a leading sports nation. A pressing question is whether the emergence of the digital economy (DE) can effectively drive progress in the HQD of the sports sector. This study adopts a comprehensive approach, utilizing benchmark regression, mediation analysis, threshold models, and spatial econometric techniques to analyze the mechanisms by which the DE influences the HQD of sports industries, based on panel data from 10 provinces in Eastern China spanning 2012 to 2021. The main findings are as follows: (a) The DE significantly facilitates the advancement and quality improvement of the sports sector in Eastern China. Results reveal a notable threshold effect, suggesting that the DE’s contribution to HQD is amplified when consumer upgrading exceeds a certain threshold. (b) Consumer upgrading serves as an intermediary channel, transmitting the DE’s positive effects to the HQD of the sports industry. (c) The analysis uncovers strong spatial spillover benefits, with HQD improvements in Eastern China’s sports industry exhibiting marked diffusion effects. Overall, these findings provide support for the sustainable expansion of the region’s sports sector and underline its growing importance in the national economy.
Introduction
As China shifts from rapid economic growth to a stage focused on high-quality development (HQD), the share of the tertiary sector has steadily increased. Notably, the swift growth of the sports industry plays a crucial role in enhancing both the nation’s mental and cultural well-being, as well as improving public physical health. Furthermore, China has a sizable sports population. The State Council of China reported in 2021 that about 500 million Chinese citizens regularly participated in sports. The market for the SI is enormous and plays a critical part in the country’s economic growth that stresses quality. However, the sports industry in China continues to grapple with issues such as inefficient structure and limited growth, necessitating improvements in overall productivity. To tackle these problems, recent policies in China have increasingly emphasized strengthening the sports sector and accelerating its integration with the digital economy (DE) (Sun et al., 2024; Guo et al., 2024). These days, digital technologies like cloud computing, blockchain, big data, online shopping, mobile payments, network communication, and artificial intelligence (AI) are flourishing and utilized in many facets of daily life as well as economic and social development. On the contrary, the DE consists of a variety of economic behaviors relying upon information technology and based on information networks (Wei, 2020). Since the 18th National Congress, China has significantly sped up industrial digitalization, vigorously promoted the digital sector, and established the DE as a key national strategy. The 2023 China Digital Economy Development Research Report notes that the DE expanded by 4.68 trillion yuan per year, reaching 50.2 trillion yuan in 2022 (Ministry of Industry and Information Technology of China, 2023). The DE now plays a central role in driving market growth, fostering industry convergence, and accelerating the transformation and upgrading of traditional industries. Its hallmark features are technological innovation and continuous adaptation. When combined, these characteristics make the DE a powerful force and stabilizer for social and economic advancement (Su et al., 2021; Liu et al., 2022; Guan et al., 2022; Haq & Huo, 2023). Few studies have examined the breakdown of individual sectors, although some have examined the connection between the DE and high-quality economic growth (Ding et al., 2021; Zhang et al., 2021). All types of sectors urgently need fresh growth impetus to construct new development models in the new stage of development that emphasizes quality. As a major sports nation, China’s sports industry plays a vital role in advancing both national social and economic progress (Duan et al., 2022; Li et al., 2022). In recent years, research on how the DE fosters HQD in the sports sector has mostly concentrated on industrial efficiency improvements (Li & Yu, 2023), or explored the relationship between DE and the advancement of HQD from various angles, with most studies remaining qualitative (Shen et al., 2023). There is a notable gap in empirical studies examining the underlying mechanisms through which DE drives HQD in the sports industry. Moreover, current scholarship predominantly addresses macroeconomic outcomes, often neglecting the examination of how upgraded consumer demand mediates the DE’s effect on the sector’s high-quality growth. The spatial correlation and threshold effect are also largely ignored in current research, which results in a dearth of empirical data and clear theoretical justification for how to implement more precise policy recommendations for the DE in the growth of the sports sector. With the highest economic and population proportions, China’s eastern region is currently the most economically developed in the nation. It also acts as a crucial testing ground for a number of cutting-edge laws and technological advancements. This area has a strong industrial base and a high concentration of sports industries. The growth of this region’s sports industry has a noticeable and influential impact on other areas (Yang et al., 2020). Therefore, incorporating relevant statistical data from the Eastern region of China into the research scope ensures that the study results possess a certain degree of demonstrativeness and leadership.
This paper aims to explore several key questions: Does the DE affect the high-quality advancement of the sports sector? What are the mechanisms at work, and how do spatial and temporal patterns manifest? To answer these, an evaluation framework for optimal sports industry growth is established, drawing on panel data from 2012 to 2021 covering 10 provinces in Eastern China, including Beijing, Tianjin, and Hebei. Furthermore, to examine how the DE contributes to the sector’s enhanced development, a theoretical model is constructed from the standpoint of rising consumer demand. The analysis employs SDM models, mediation analysis, and threshold models.
Thus, in contrast to previous research, this study’s innovation and contribution are particularly evident in the following ways: (a) It creatively combines the DE, upgrading of consumer consumption, and high-quality sports industry development into a single research framework, enhancing and improving previous studies; (b) Assesses the degree of high-quality sports industry development in 10 Eastern Chinese provinces, serving as a scientific reference for future research; and (c) Examines how the DE contributes to the advancement of high-quality development in the sports sector, clarifying how improvements in consumer spending drive this process, while also factoring in spatial dimensions—thereby offering both theoretical insights and practical value.
Literature Review
Although both the DE (Miao, 2021; Ma et al., 2021) and the pursuit of HQD in the sports sector have attracted considerable scholarly attention (Yi et al., 2023), the precise effects of the DE on the HQD of the sports industry—and how improvements in residents’ consumption contribute to this process—are still not clearly understood. Therefore, it is practically significant to systematically examine how these three factors interrelate.
A major area of study in the domains of economics, management, and industrial economics in recent years has been the interconnected relationship between the DE, residents’ upgrading of their consumption, and the HQD of the sports industry (Miao, 2021; Ma et al., 2021; Yi et al., 2023). Existing literature can be broadly categorized into the following three strands, reflecting diverse theoretical perspectives and empirical approaches.
The first category encompasses both conceptual and empirical studies exploring how the DE contributes to the advanced development of the sports industry. Some scholars, in particular, focus on theoretical explanations of the ways in which the DE promotes industrial upgrading and transformation. From a theoretical and practical standpoint, as well as at the micro, meso, and macro levels, Ren and Huang (2021a, 2021b) methodically examine the driving mechanisms of the DE for HQD in China’s sports industry. They contend that important avenues include boosting industrial status, improving industrial systems, and increasing factor input. Internationally, similar theories of “industrial digital transformation” (Bharadwaj et al., 2013; Li, 2020). Highlight the significance of digital technology in transforming industrial frameworks and innovation ecosystems. Utilizing the entropy method and spatial econometric models, Dong (2022) and Y. Wang et al. (2022) identify potential enhancements in the integration between the DE and the sports industry, highlight persistent regional development disparities, and reveal that the influence of the DE on TFP within the sports sector exhibits spatial heterogeneity and dynamism. According to related international data, digital literacy and infrastructure are essential for boosting innovation and competitiveness in the regional sports sector (Chen et al., 2024; Nambisan et al., 2019). Furthermore, J. Wang et al. (2022) and Yang et al. (2022) explore the role of the DE in advancing macro objectives such as “carbon neutrality” and urban–rural coordination, suggesting that digital technology not only enhances industrial efficiency but also fosters green and inclusive development (Yu & Zhou, 2021).
The second category: Examination of the interactive mechanisms between HQD and the enhancement of residents’ consumption. Academics both in China and internationally concur that consumption enhancement and industrial high-quality development are mutually supportive (Acemoglu & Restrepo, 2020). Deng and Tang (2020) point out that the current sports industry faces challenges in infrastructure, talent, and consumer willingness, and advocate for new competition mechanisms, integration with advanced technology, and optimization of consumption structure to accelerate industrial upgrading. Feng and Zhang (2022) further conclude that consumption upgrading is a vital guarantee for improving economic structure and achieving high-quality growth. Internationally, Bils and Klenow (2001) have examined how rising incomes promote changes in consumption patterns, while Simmons et al. (2018) point out that such consumption upgrading can stimulate the growth of the service sector and innovation-related industries. Other researchers, such as Chen et al. (2022), have utilized mediation models to investigate how consumption upgrading functions as an intermediary variable—linking the DE to outcomes like carbon emissions—and underscore the practical significance of consumption upgrading as a “bridge” in empirical analysis.
The third strand of research examines the link between the DE and the upgrading of consumption from multiple perspectives. Recent literature mainly focuses on the various mechanisms through which the DE shapes improvements in residents’ consumption patterns. Chen and Guo (2023) point out that, while significant differences exist across regions and between urban and rural areas, the DE—together with financial sector development—substantially promotes consumption upgrading at the macro level. He et al. (2022), who concentrate on the senior population, demonstrate how the DE greatly improves the consumption structure and living standards of the elderly by facilitating social interaction and payment convenience. Using 2SLS, IV-Tobit, and mediation models, Li et al. (2020) and Zhang & Zhao (2025) demonstrate distinct impacts of e-commerce and digital inclusive finance on different forms of consumption. While Agrawal et al. (2019) stress the significance of digital inclusion for rural consumption upgrading and balanced regional development, international literature, including Goldfarb & Tucker (2019), examines the profound impact of the DE on shifting consumer behavior and industrial upgrading.
In conclusion, recent studies have offered a solid theoretical and empirical basis for comprehending the connections between the sports industry’s HQD, consumption upgrading, and DE. However, existing literature still shows limitations in theoretical integration, identification of mechanisms, and cross-disciplinary perspectives. This research integrates major theoretical and empirical insights from both domestic and international scholarship into a unified analytical framework. It aims to clarify the mechanisms through which the DE shapes residents’ consumption upgrading and, in turn, affects the HQD of the sports industry. In doing so, the study provides a strong theoretical foundation and practical evidence to inform future theoretical advances and guide policy implementation (Huo et al., 2024).
In conclusion, there are not many studies currently being conducted on the meaning of the sports industry’s HQD, and no standardized assessment method has been developed. No reliable method exists to assess the correlation between the DE and the robust growth of the industry, despite the contentious nature of DE research in academic discourse. The enhancement of residents’ consumption is a crucial element in increasing demand for domestic products and fostering a model of sustainable economic growth. Without a doubt, the DE plays the role of a central drive for promoting the HQD of a nation’s domestic market. In order to ascertain the mechanism of action and effect of the three, the paper combines the essence of the industry’s high-quality growth to construct an evaluation system that looks at the influence of the DE on the industry’s high-quality growth and attempts to analyze the role that consumption upgrade plays between the two. The research’s conclusions are highly relevant to practice since they demonstrate how the DE and consumption upgrading work together to propel the sports industry’s HQD. They also offer a focal point and theoretical justification to direct the industry’s high-quality growth implementation.
Theoretical Analysis and Research Hypothesis
DE and the Sports Industry’s HQD
The DE represents the marketization of information technology, which has transformed traditional information interaction and the supply-demand relationship, invigorated the sports industry, established a new frontier, and redefined the industry’s ecology. Specifically, sports enterprises can use the Internet as the basis, apply a variety of newly emerged information tools, such as big data, tap personal data, and browsing records and consumption records of target customers, accurately control customer demand and target customer groups through live streaming with goods and social media promotion. These technologies also streamline the supply chain, improve the alignment of supply and demand, and boost transaction efficiency through tools like artificial intelligence, mobile internet, cloud computing, and 5G networks (Huo et al., 2020). Widespread adoption of these technologies—along with unmanned stadiums—enables smart, precise management of sports venues supported by advanced IT, while also lowering operational expenses. Moreover, the use of optical devices for virtual and augmented reality can significantly enrich the spectator experience, increasing both immersion and interactivity, thus expanding the audience and improving event organization. In addition, the application of these two technologies can break through the scenario limitation of sports activities and make it more convenient for people to carry out sports activities, which opens up market space for smart sports wearable devices and sports virtual interactive devices (Zhang et al., 2025; Miah et al., 2020). Large Internet enterprises enter the sports market and add traffic to relevant sports events to enhance the influence of events, thus attracting more enterprises to participate and invest, bringing advertising and event peripheral revenue; Internet-supported instant communication enables sports enterprises to communicate with their customers (Zhang et al., 2020). Instant communication allows sports enterprises to swiftly connect with customers and promptly discern their unique needs, thereby offering premium tailored services, including bespoke sports equipment, personalized training regimens, and customized health recipes. The advancements introduced by the DE create entirely uncharted opportunities for the growth and development of industry models. Building upon the aforementioned analysis, our study proposes the first hypothesis:
DE, Residents’ Consumption Upgrading, and the Sports Industry’s HQD
The DE advances the high-quality development of the sports industry through the adoption of cutting-edge communication technologies—such as mobile networks, fiber optic infrastructure, and communication base stations—which are integrated into the manufacturing and distribution of production factors. This approach leverages the advantages of digital sectors, including internet-based communication, artificial intelligence, and big data (Chao et al., 2024). In recent years, this has facilitated the rise of sports e-commerce and various related industries. Various applications leveraging advanced digital technology, including the platform economy and big data, have significantly influenced recent developments. The sports industry has been propelled by innovative sales models such as live e-commerce and social e-commerce, resulting in ongoing innovation and transformation (Li et al., 2024). The traditional consumption of residents is often concentrated in the field of “clothing, food, housing and transportation” and other necessities of life, but when residents’ consumption is upgraded, they will turn their consumption targets to sports and other consumer-oriented service industries, injecting funds and power for the sports industry’s HQD (Liu et al., 2021). A lack of sufficient digital resources and limited industrial integration can create obstacles in the early phases of DE expansion, while low levels of marketization may diminish the impact of the online economy on the sports sector. However, as the DE matures, its positive effects on the sports industry will become more pronounced (Kai & Jin, 2025). With the continuous evolution and widespread adoption of digital technologies, the sports industry is able to utilize diverse digital tools and platforms to optimize operations, marketing, and audience engagement. The expansion of the DE will substantially affect the HQD of the sports industry, with residents’ enhancement of their consumption serving as a catalyst for this effect (Su et al., 2024). As consumers adopt higher levels of digital engagement, the sports industry benefits from increased demand, innovative business models, and enhanced customer experiences. In addition, the DE can promote integrated expansion. As the DE continues to grow, its cumulative benefits become more prominent, resulting in a non-linear effect on advancing the sports industry’s high-quality development. This suggests that the influence of the DE on the industry’s quality growth both intensifies and evolves with further development.
The Spillover Effect of DE Development on the Sports Industry’s HQD
The DE’s development, at its core, is driven by data elements, which are harnessed through the intermediary of information technology, information flow, capital flow and the unique learning and imitation ability of machine learning can produce spillover effects in adjacent areas of DE development and help the industry’s quality growth (Ma et al., 2024). Unlike the traditional agricultural and industrial economies, the emergence of Internet technology, which accompanied the Third Industrial Revolution, has paved the way for a DE where data and information serve as crucial factors of production. It has also broken through the closed and unilateral collaboration characteristics of traditional agricultural development and industry and is characterized by openness, cross-regional flow and knowledge dissemination (Javaid et al., 2024). Specifically, digital factors, as emerging factors of production, are highly mobile, replicable, and shareable compared with conventional production factors, which include land, capital and labor, and can flow rapidly among different economies and regions to generate economic benefits. In particular, the swift advancement of hardware technology and the Internet, influenced by Moore’s Law, has led to a geometric decrease in the cost of storing, transmitting and processing information elements, which determines the generation of benefits and the flow of data at low cost across geographic areas (Lyu et al., 2024). Simultaneously, the “bilateral network effect” characteristic of the DEs rapid growth has facilitated the mobility of innovation factors required for innovation development, which has significant advantages in the process of building a highly interconnected network structure with scale effects and positive externalities (Huang et al., 2022). The ever-advancing Internet technology, at the same time, will cause some information technology and information software to “sink,” and the dissemination of data elements will penetrate more quickly and rapidly among cities and industries at different levels, thus realizing both “spatial mobility” and “industrial mobility.” It is obvious that the DE’s fast expansion is able to avoid “independent development,” and simultaneously, have a spillover effect on the sports industry’s quality growth in the surrounding vicinities through the flow of data elements, which leads to the third hypothesis of this paper:
Research Methods and Data Sources
Model Construction
To assess the hypotheses proposed in this study, a baseline regression model was developed. This approach was chosen for its clarity and effectiveness in estimating key relationships among the principal variables, providing a solid basis for further empirical investigation.

In Equation 1, the variables are denoted as the following: i signifies the province, t signifies the year, HQD and DE represent the level of the sports industry’s HQD and the DE’s development level respectively; ε signifies a random disturbance term; δ denotes time fixed effect and μ signifies the individual fixed effect. In addition, there are many other factors that could potentially influence the sports industry’s quality growth and development level are selected and added to Equation 1 as control variables CV.
To enhance comprehension of the underlying mechanism, residents’ consumption upgrading (RCU), grounded in theoretical foundations and existing literature, is introduced as a mediating variable. A stepwise mediation model is used in accordance with Zhao et al. (2023) since it enables a methodical evaluation of both direct and indirect effects. In particular, Equation 2 looks at how the DE affects the mediating variable (RCU), whereas Equation 3 uses the mediating variable and the DE as regressors for the sports industry’s HQD. This strategy was selected because it provides a comprehensive framework for assessing the presence and significance of the mediating role that residents’ consumption enhancement plays in the relationship between the DE and the HQD of the sports industry:


The varied effects of explanatory variables across various threshold regimes can be adequately captured by the panel threshold model put forth by Hansen (1999). However, this model relies on rather stringent assumptions, as the fixed effects estimator of the panel threshold model requires all covariates to be strictly exogenous in order to ensure consistency. In practical empirical analysis, it is often difficult for the threshold variable and covariates to fully meet this exogeneity condition. To address this limitation, the dynamic panel threshold model improves upon Hansen’s original framework. Kremer et al. (2013) and Seo and Shin (2016) extended the model to a dynamic panel context, allowing for endogenous threshold variables as well as lagged dependent variables. This provides greater flexibility and broader applicability for empirical research. The model accommodates endogeneity among the explanatory and threshold variables, making it suitable for panel data analyses with dynamic adjustments and complex feedback relationships between variables.
Given the characteristics of our dataset and the research objectives, we apply a dynamic panel threshold regression approach, following the methodology proposed by Seo and Shin (2016), as detailed below:

where HQDi,j,t denotes the dependent variable, HQDi,j,t−1 its lagged value, DEi,j,t the main explanatory variable, wi,j,t the threshold variable, I(·) the indicator function, θ the threshold to be estimated, CVi,j,t a vector of control variables, μi individual fixed effects, and ϵi,j, t the error term.
Rather than being limited to specific regions, the relationship between the DE and the HQD of the sports industry exhibits marked spatial interdependence. To capture these spatial dynamics, we employ a spatial econometric approach, which effectively incorporates spillover effects and considers influences from neighboring areas that standard regression methods might overlook. This approach allows for a more nuanced and thorough examination of how the sports industry and the DE co-evolve across various regions, utilizing advanced spatial econometric tools.

W stands for the spatial weight matrix, ρ for the spatial autocorrelation coefficient, lnHQD for taking the logarithm of the sports industry’s HQD, and Equation 5 for the SAR model.

Equation 6 represents the (SEM model, which considers the spatial correlation of the error terms, distinguishing it from the SAR model, and λ signifies the spatial autocorrelation coefficient.

Equation 7 signifies the SDM, which incorporates the spatial effects of the lagged terms of the dependent variable and a variety of other factors into the model to investigate their spatial effects on the explanatory variables. ρ represents the dependent variable’s spatial autoregressive coefficient and γ represents the independent variable’s spatial autoregressive coefficient.
The spatial weight matrix plays a crucial role in building spatial econometric models, serving as a foundation for examining spatial correlations among variables. Typically, its construction relies on measures of proximity and geographic distance. In this study, we employ an economic distance-based spatial weight matrix, defined according to distance metrics, as described below:

In Equation 8, Wd signifies the geographical distance’s spatial weight matrix,
Variable Selection and Description
Explained Variables
The HQD of the sports industry is identified as the principal variable for analysis, reflecting both the industry’s magnitude and its qualitative advancement. “HQD” denotes not only an increase in scale but also substantial progress in productivity, creativity, sustainability, and the industry’s overall influence on the broader economy and society. Drawing on existing literature (Deng, 2022; Duan et al., 2022; Luo & Chen, 2023) and ensuring scientific rigor, data accessibility, and adaptability, we construct the HQD index from three perspectives—industrial foundation, industry benefits, and advanced industrial structure—comprising 11 measurable indicators as listed in Table 1. Specifically: (a) Industrial foundation indicators include the sports industry’s overall output value and value added, its proportion of GDP, the number of sports venues, the number of sports service legal entities, and the sports field area per capita. (b) Industry benefits indicators capture improvements in product/service quality and performance, such as per capita sports consumption, the number of people regularly engaging in physical exercise, and the number of sports venues per 10,000 people. (c) Advanced industrial structure indicators include the number of employees in sports services, the proportion of sports service industry in the sports industry, the value added of sports services as a proportion of total sports industry value added, and the average salary of sports industry employees. All raw indicators are first directionally unified (positive or negative impact), then normalized to the [0,1] range using min–max scaling. The composite HQD score for each province-year is obtained via the entropy method to assign objective weights. The final HQD variable used in regressions is the weighted sum of all standardized indicators, expressed as:

where wj is the entropy-based weight for indicator j and Zijt is the normalized value. Higher HQD values indicate better performance in the high-quality development of the sports industry.
Sports Industry HQD Index.

Explanatory Variables
The DE composite index reflects the level of regional digital economy development and is closely linked to technological infrastructure, Internet capacity, and digital financial inclusion. Following Liu et al. (2020) and Cao et al. (2021), we construct the DE index from 11 indicators covering three sub-dimensions: informatization development, Internet output, and digital financial inclusion, as detailed in Table 2. All indicators are directionally unified, normalized to the [0,1] range using min−max scaling, and weighted objectively via the entropy method. The composite index is expressed as:

Where
DE Development Level Indicator System.

Intermediate Variables
Residents’ Consumption Upgrade describes the transformation of household consumption patterns from subsistence-oriented to enjoyment- and service-oriented spending as income levels rise. Following Le et al. (2023) and Chen and Guo (2023), we measure this indicator as the share of developmental and leisure-oriented expenditure in total household consumption. Specifically, it includes per capita spending on (a) education and cultural entertainment, (b) transportation and communication, (c) health care, and (d) other leisure-oriented living services. All expenditure data are converted to constant 2012 prices to remove inflation effects. A higher value of this ratio indicates a greater degree of consumption upgrading among residents.
Control Variables
To address potential endogeneity from omitted variables and to better capture the intricate mechanisms shaping the quality-driven growth of China’s sports industry, several control variables were included in the model. These variables also help to more accurately assess the spatial influences during the industry’s advancement toward high-quality development. (a) Government intervention (GOV): Measured by the ratio of provincial fiscal expenditure to GDP, reflecting the degree of governmental involvement in each province’s economy. (b) Urbanization rate (URB): Defined as the share of the urban population relative to the total national population, which accommodates regional differences in area and demographic size when evaluating urbanization. (c) Technological progress (TEC): Technological and scientific innovations serve as a persistent driving force for industry upgrading. Here, we quantify this by the number of patent applications per region, representing the level of technological advancement in each province. (d) Financial development (FD): Calculated by aggregating the institutional deposit and loan balances of each province as a percentage of GDP, this indicator measures the development of the regional financial sector. (e) Fixed asset investment (IFA): The proportion of fixed asset investment to provincial GDP is used to gauge the intensity of investment and, by extension, financial development at the regional level. (f) Economic development (ED): Per capita GDP serves as a benchmark to indicate the overall economic development level within the region.
Data Sources
For 10 provinces and municipalities—Hainan, Jiangsu, Zhejiang, Shanghai, Hebei, Tianjin, Guangdong, Shandong, Fujian, and Beijing—this study constructs a panel dataset covering 2012−2021. The data mainly come from provincial sports bureaus, provincial statistical bureaus, the State General Administration of Sports, the China Economic and Social Data Platform, the 2013−2022 municipal and provincial statistical yearbooks, the National Bureau of Statistics, statistical bulletins on national economic and social development, and provincial sports industry development reports. For a small number of indicators with missing values (such as the number of sports venues in certain years), linear interpolation is applied within provinces; these missing cases are few and mainly concentrated in the early years, thus not significantly affecting sample representativeness or estimation results.
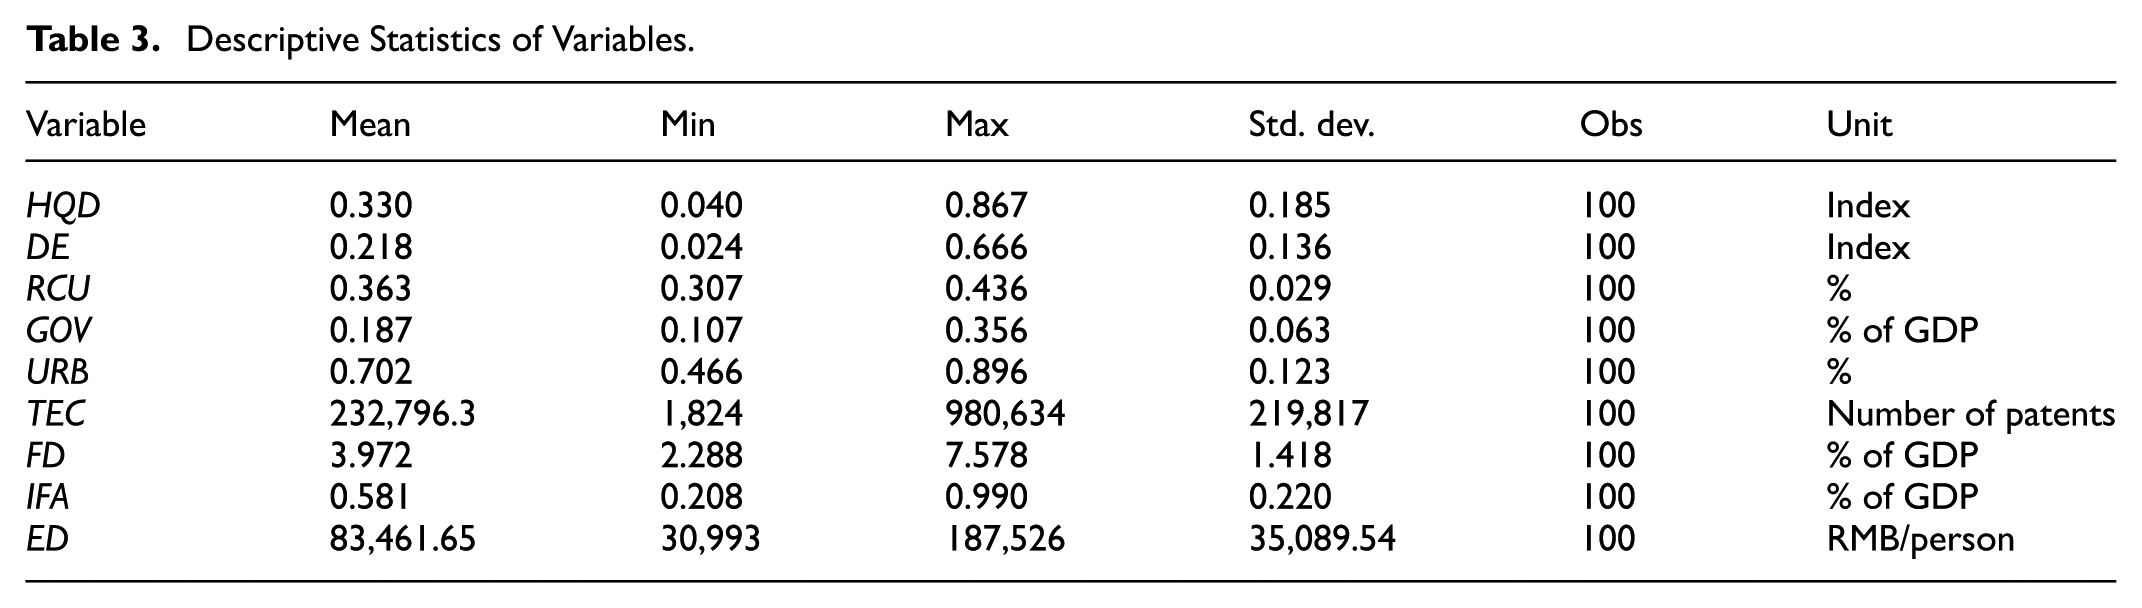
Table 3 reports the descriptive statistics for the variables used in the analysis. The HQD has a mean value of 0.330, ranging from 0.040 to 0.867, indicating large disparities in development levels across the sample regions. The DE averages 0.218, with values between 0.024 and 0.666, reflecting significant heterogeneity in digital infrastructure and application adoption. The RCU is relatively stable, with a mean of 36.3% and a narrow range (30.7%−43.6%). GOV, expressed as a percentage of GDP, averages 0.187%, with a minimum of 0.107% and a maximum of 0.356%. URB is generally high, with a mean of 70.2% and a maximum of 89.6%. TEC, has a mean of 232,796 but varies widely from 1,824 to 980,634, underscoring disparities in innovation resources. FD, measured as a percentage of GDP, averages 3.972%, indicating moderate but uneven financial sector depth. IFA averages 0.581% of GDP, with variation from 0.208% to 0.990%. Finally, ED averages RMB 83,461.65, ranging from RMB 30,993 to RMB 187,526, pointing to substantial inter-provincial gaps in human capital investment. The diversity in scale, dispersion, and economic meaning of these variables ensures that the dataset captures a broad spectrum of economic, social, and policy contexts relevant to the research objectives.
Descriptive Statistics of Variables.
Results of the Empirical Analysis
Baseline Regression Analysis
In examining the relationship between the DE and the HQD of the sports industry, it is important to control for unobserved province-specific characteristics. If these are not accounted for, parameter estimates could be biased. A fixed-effects model addresses this by removing the influence of time-invariant factors, allowing us to focus on within-province variation over time. To determine whether fixed effects are preferred over random effects, we use the Hausman test. Based on the results of the Hausman test, the fixed-effects model was selected, as shown in Table 4. It is important to note that both HQD and DE in our regressions are composite indices, constructed from multiple standardized and weighted indicators as described in Section “Variable Selection and Description.” HQD represents the overall high-quality development level of the sports industry rather than any single underlying indicator, while DE captures the integrated development level of the regional digital economy. Thus, the estimated coefficients should be interpreted as the effect of a one-unit change in the composite index, rather than a change in any single metric. Model (1) reports the direct regression results for the HQD of the sports sector and the DE in coastal provinces, revealing a significant positive effect at the 1% level. The strong correlation between DE expansion and the growth of Eastern China’s sports industry suggests that the DE acts as a driver, more effectively propelling the sector’s progress. Specifically, the estimated coefficient of 0.012 implies that a one-unit increase in the DE composite index is associated with a 1.2 percentage point increase in the HQD composite index, ceteris paribus. Given that the HQD index has a sample mean of 0.330 and a standard deviation of 0.185, this effect corresponds to approximately 3.64% of the mean HQD value, indicating not only statistical but also meaningful economic significance. These findings remain highly significant even after introducing additional control variables in Model (2), further supports the validity of the results. The modern sports industry now enjoys greater prospects for innovation and development due to the widespread application of digital technologies. As a result, the sector must embrace digital platforms, content, and marketing through ongoing technological progress. The DE increases the reach and market capacity of the sports industry, particularly in Eastern cities and regions, fosters diversified growth paths, advances the digital management of venues and sporting events, and supports the sector’s ongoing transformation, improvement, and movement toward high-quality development. Hypothesis 1 is supported
Baseline Regression Results.
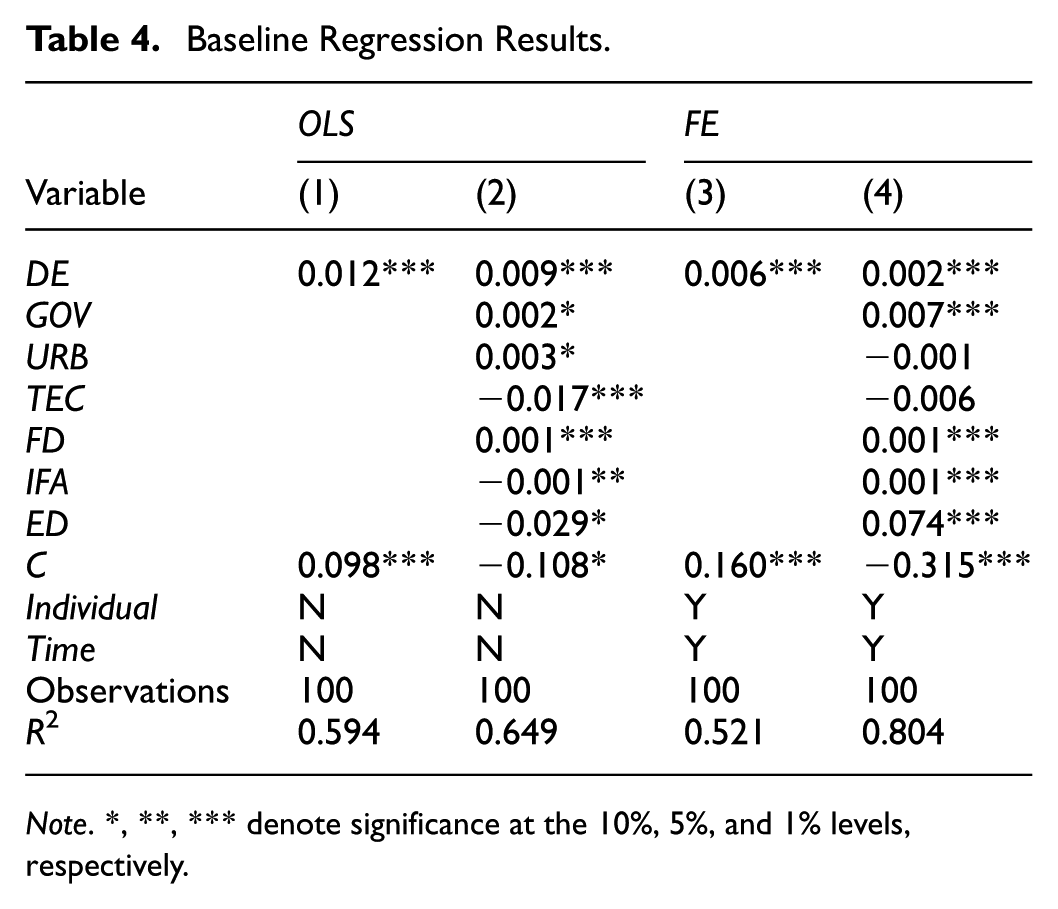
Note. *, **, *** denote significance at the 10%, 5%, and 1% levels, respectively.
Mediating Effects Analysis
To validate the proposed mechanism and examine whether consumer consumption upgrading serves as a mediating factor, Equations 2 and 3 were applied. Detailed results can be found in Table 5. Specifically, Column (1) in Table 5 highlights the significant promotional role of the DE in advancing the HQD of the sports industry. Column (2) demonstrates that the DE markedly promotes the upgrading of consumer consumption. When the mediating variable—consumer consumption upgrading—is included in Column (3), the estimated coefficient for the DE’s effect on HQD slightly decreases from 0.012 to 0.011, but the result remains robustly positive at the 1% significance level. Furthermore, mediation analysis validates Hypothesis H2a, confirming that consumer consumption upgrading indeed acts as a bridge through which the DE impacts the HQD of the sports sector.
Results of the Analysis of Mediating Effects.

Note. *, **, *** denote significance at the 10%, 5%, and 1% levels, respectively.
Results of the Dynamic Panel Threshold Model
This analysis incorporates several control variables—including government intervention (GOV), urbanization rate (URB), technological advancement (TEC), financial sector development (FD), fixed asset investment (IFA), and economic development (ED)—to mitigate endogeneity linked to omitted variables. These variables are included to account for spatial effects and the intricate mechanisms influencing the high-quality development of the sports industry. Residents’ consumption upgrading is treated as the threshold variable, and the HQD index of the sports industry is lagged by one period to introduce dynamics into the model, employing the dynamic panel threshold regression approach proposed by Seo and Shin (2016). Empirical results are presented in Table 6.
Dynamic Threshold Effects and Robustness Tests.

Note. *, **, *** denote significance at the 10%, 5%, and 1% levels, respectively.
The findings reveal that Model (1) is the baseline regression, identifying a threshold value of r = 1.457 for residents’ consumption upgrading. When this value is below the threshold, the coefficient of the digital economy (DE) on HQD is β2 = .028. Above the threshold, the coefficient increases to β2 = .046. This suggests notable heterogeneity and a nonlinear promotional effect of the DE on the high-quality growth of the sports sector at different stages of consumption upgrading. Importantly, as additional control variables are added, the threshold remains stable and the size and statistical significance of the DE’s effects are consistent, confirming the robustness of the results. Hypothesis H2b is thus supported.
Furthermore, the lagged term of the sports industry’s HQD index (L.Hqds) has regression coefficients that range from 0.317 to 0.512 and are consistently positive, indicating strong dynamic inertia in the industry’s development process. Regarding the control variables, the findings indicate that, in the corresponding model, government intervention (GOV) significantly improves the HQD of the sports industry. When the urbanization rate (URB) is included, its coefficient is also positive and significant, suggesting that higher urbanization levels are beneficial to the industry’s quality growth. The coefficient of technological progress (TEC) becomes significantly positive when added to the model, underscoring the crucial role of technological innovation. Financial development (FD) exhibits a positive and significant effect (.558, p < .05), indicating that an improved financial environment supports HQD. Investment in fixed assets (IFA) also shows a significantly positive impact, while the economic development level (ED) has a positive and significant coefficient.
In regions at a relatively early stage, economic growth remains the primary objective, and the level of digitalization or residents’ consumption upgrade is relatively low. Even though the DE helps the sports industry’s HQD during this time, its marginal impact is still quite small. As regional development advances and the focus shifts toward high-quality and sustainable growth, both digitalization and consumption upgrading intensify. In this regard, the DE is steadily fostering innovation and structural change in the sports industry, which not only encourages industrial upgrading but also improves stakeholder coordination effectiveness. Consequently, the beneficial effect of the DE on the HQD of the sports industry intensifies after surpassing the threshold of consumption upgrade. These findings imply that, although the expansion of digital infrastructure and promotion of consumption upgrade are essential, it is equally important for policymakers to foster deep integration between digital innovation and consumption patterns, rather than relying solely on scale expansion. The substantial coefficients of the lagged term across all models indicate a degree of path dependence in the quality development of the sports industry; specifically, prior advancements persistently impact current and future progress.
Before estimating spatial models, we first check whether HQD and DE exhibit spatial dependence. The logic is that the sports industry in one province may affect its neighbors through channels such as knowledge spillovers, shared supply chains, or market expansion. If provinces with similar HQD levels tend to be geographically clustered, then spatial effects must be considered to avoid biased results. Moran’s I statistic provides a formal measure of such clustering. To analyze the spatial interrelationships between the DE and the HQD of the sports industry, an economic spatial matrix was constructed. Separate calculations of the global Moran’s I index for both the DE and HQD in the sports sector were performed using Stata 15.1 (Table 7). The results reveal that, for the Eastern sports industry, the global Moran’s I values for HQD ranged from 0.105 to 0.141 during 2012−2021. Despite fluctuations, the p-values—reflecting an overall pattern of initial decrease followed by a rise—consistently exceeded the 10% significance threshold. This finding suggests the presence of persistent, significant positive spatial correlation in the HQD of the sports sector across provinces throughout the study period. Similarly, the DE also surpassed the 10% significance level, with its global Moran’s I showing variability across the observed years except 2021.
Global Moran’s I Measurement Results for 2012 to 2021.

Note. *, **, *** denote significance at the 10%, 5%, and 1% levels, respectively.
Spatial Model Selection
Given the presence of spatial autocorrelation, the next step is to choose the appropriate spatial econometric specification. The Spatial Durbin Model (SDM) is selected because it captures two types of spillovers: (a) Dependent-variable spillover—HQD in one province may directly influence HQD in neighboring provinces. (b) Independent-variable spillover—The DE and other explanatory factors in neighboring provinces may also affect a province’s HQD. This makes the SDM more comprehensive than models that only include one type of spillover (SAR or SEM). To verify the necessity of SDM, we conduct LM, robust LM, LR, and Wald tests, which confirm that the SDM cannot be reduced without losing important information. Therefore, following Elhorst’s (2014) framework in spatial econometrics, this study applies a two-way fixed-effects Spatial Durbin Model to control for both province-specific and time-specific unobserved factors while capturing spatial spillovers. Table 8 summarizes the model selection and testing results. The choice between spatial lag and spatial error models is based on the outcomes of the LM and Robust LM tests. Further evaluation of whether the SDM can be reduced to SAR or SEM forms is carried out via LR and Wald tests. Because the Hausman test yielded significant results at the 5% level, the fixed effects approach was adopted. Ultimately, a two-way fixed effects SDM model was employed in the regression analysis to address biases from temporal variations and unobserved factors affecting the headquarters activities of Eastern China’s sports industry.
Panel Measurement Model Test.

Spatial Spillover Effect
Parameter estimates for the HQD level of the sports industry in Eastern China were obtained using Stata 15.1, and are presented in Table 9. The model achieved a goodness-of-fit value of .677, demonstrating that the selection of variables and model structure are well-founded. The coefficient for the spatial spillover effect was .346, revealing a strong positive spillover in the growth of the region’s sports sector, which supports Hypothesis 3. This suggests that the HQD in Eastern China’s sports industry is influenced by factors such as robust infrastructure, government support, resource mobility between regions, and technological advancements. Therefore, to further advance HQD in this area, it is essential to focus on strengthening development strategies, fostering innovation, and improving cross-regional communication as well as the exchange of resources and knowledge—these aspects are vital for reaching HQD objectives. The emergence of spillover effects is driven by the collective influence of various determinants, including government intervention, urbanization, financial sector growth, investment in fixed assets, technological progress, and overall economic development. All these elements impact the HQD of the sports industry, though the effects may differ in magnitude and direction. Additionally, significant differences appear in the lagged impacts of these variables, showing that the HQD of the sports sector in Eastern China is shaped by both “diffusion” and “siphoning” mechanisms stemming from inter-city competition.
Estimation Results of the SDM.

Note. *, **, *** denote significance at the 10%, 5%, and 1% levels, respectively.
Decomposition of Spatial Spillover Effect
Analyzing the SDM results allows us to decompose the estimated impacts into direct effects (within the same province) and indirect effects (spillovers to neighboring provinces). This is crucial for understanding distributional dynamics. In our context, the so-called “Matthew effect” refers to the tendency for already-strong provinces to attract more resources, talent, and investment, further enhancing their HQD, while weaker provinces risk falling further behind. This dynamic underscores the importance of policies that promote balanced development and interregional cooperation, so that spatial spillovers can reduce rather than widen regional disparities. Table 10 shows that even after accounting for measurement bias, the spatial lag component in the SDM remains positive. This finding indicates that neighboring regions have a meaningful influence on the growth of the high-quality sports industry. As a result, evaluating the headquarters effects of the sports industry in coastal provinces requires more than basic regression analysis. Using the approach of LeSage and Pace (2008), we conduct partial differential estimation to identify both the direct and indirect impacts within the SDM, further breaking down the contributions of different influencing factors. The resulting impacts reveal how various determinants affect the sports industry’s headquarters both locally and in surrounding areas, as detailed in Table 9.
Direct Effect, Indirect Effect, and Total Effect.

Note. *, **, *** denote significance at the 10%, 5%, and 1% levels, respectively.
“Spatial spillover” and the “Matthew effect,” which results in the agglomeration and diffusion of development factors, have a impact on the spatial correlation characteristics of HQD in the Eastern Chinese sports industry. These factors become important determinants of HQD in the region’s sports industry. The former is mostly distinguished by cross-regional movement and the observable driving of development drivers attained by technical improvement, industry agglomeration, and intergovernmental cooperation. The latter emphasizes how the lack of development drivers caused by path dependence and geographic correlation is widening.
Significant disparities between the indirect and direct effects of numerous influencing elements are present at the same time due to the complicated co-opetition influence among diverse cities. It specifically shows up in the following areas:
The government intervention level has a positive direct impact on the HQD of the sports industry, according to a 1% significance level. This demonstrates how local governments can successfully encourage the sports industry’s quality growth by raising tax revenues, investing more in the industry, enhancing the standard of facilities and equipment, giving priority to the development and support of sports talent, and promoting a positive local sports culture. Additionally, by creating more thorough laws and regulations, improving the business climate, and luring more money and businesses into the regional sports industry, the government supports high-quality growth and development goals. The planning of sporting events and the promotion of fitness activities also raise public interest in and involvement in sports, which helps the sports business gain popularity and grow.
Given that the country’s Eastern region experiences the greatest rate of urbanization, rising levels of urbanization imply a growing market, which opens up a wide range of development opportunities for the high-quality sports industry in the local and nearby vicinities. From a direct effect standpoint, the rapid urbanization process has raised living standards for locals and gradually increased emphasis on physical fitness. The enhancement of urban stadiums and the relative availability of sports professionals that have resulted from the growing rate of urbanization can better support and encourage the sports industry’s HQD. From the standpoint of an indirect influence, the rise in urbanization results in the movement and concentration of populations, which opens up new opportunities for the sale and promotion of sporting commodities in neighboring regions. The improvement in urban sports development level also offers chances for event planning, athlete development, and coach development in the surrounding areas, which effectively supports the development in the surrounding areas.
In the eastern provinces of the country, financial growth significantly influences the qualitative advancement of the sports industry, exhibiting an indirect effect of −0.005 and a direct effect of 0.007. The sports industry benefits from a broader and more plentiful array of funding sources due to enhanced local financial development, which substantially aids the advancement of the sports sector. Moreover, the efficacy and specialization of the financial sector provide valuable insights and exemplars for the market-oriented management and operation of the sports industry. At the same time, because of the relatively well-developed local financial industry, a significant amount of foreign capital and talent can be attracted, along with a concentration of high-end talent and high-income groups, which not only deprive the local sports industry of resources but also impede the growth of the industry’s market in those areas.
At the 1% significance level, fixed asset investment demonstrates a direct effect of 0.017 and an indirect effect of −0.039 on the HQD of the sports industry. Increased fixed asset investment stimulates industry growth by supplying essential funding and infrastructure, which enhances both the safety and effectiveness of sports activities and encourages greater local engagement. Moreover, higher local investment in fixed assets supports local sports businesses by creating jobs and advancing the ongoing HQD of the regional sports sector. However, elevated local fixed asset investment can attract more resources and capital, prompting neighboring regions to seek further capital accumulation. This dynamic may also lead to policy resource imbalances, indicating that surrounding areas might receive less policy support for their sports enterprises when local fixed asset investment rises.
The quality growth of the local sports industry is greatly aided by the direct effect of science and technology inputs. Although the indirect effect, which is −0.224, hinders the HQD of the sports industry in the nearby area. On the one hand, investments in technology and science can assist the sports businesses in carrying out technological innovation, developing more advanced sports equipment, venue construction, and other technologies, applying them to sports competition, boosting the competition level and spectacle, and promoting the ongoing upgrading and growth of the sports industry. Investments in technology and science, on the other hand, can also enhance the quality of goods and services. Additionally, investments in science and technological improvement can raise the value of the goods and services provided by the sports industry, meet consumer demand, increase market competitiveness, support the integration of other related industries with the sports industry, create a seamless industrial chain, and fervently support the HQD within the industry. On the other hand, in surrounding regions, uneven rivalry may occur because of the differing rates in the sports industry’s growth and development, and neighboring regions with rapid development may exert pressure on slower-developing regions. The departure of highly trained sports talent to other regions, coupled with the lack of development chances or low income, may result in the loss of technical support and leadership talents for the local sports industry, leading to the slow or stagnant development in the industry.
The Eastern region has a 0.250 direct impact on economic growth. However, the degree of local economic development may negatively impact neighboring regions. The indirect effect, which is −0.045, is likewise statistically significant. For instance, when local economies grow, residents’ capacities for and conceptions of consumption alter. As a result, there is a corresponding rise in demand for sports consumption. As a result, the local sports industry has been further supported by the rise of adjacent companies such as sports event planners, sports media, and producers of sporting items. Economic growth has also increased the number of sponsorship and advertising options available to the sports industry. Companies may improve their brand awareness and image, increase their market share, and do all of this by sponsoring sports events and athletes. The financial and resource support provided by such collaboration can be used to boost innovation and development in the sports business as well as the planning and quality of sporting events. In contrast, of the sports industry’s quality growth in nearby regions may be slowed down by an increase in economic development. An unequal allocation of resources and investments may result from the differing levels of economic development. The relative economic strength of wealthy areas may draw more resources and investments, which could put surrounding areas at risk of resource constraints and investment limitations that would restrict the growth of their sports businesses. Along with this, wealthy areas have larger markets with better spending power, which attracts more enterprises and activities in the sports industry. Comparatively speaking, surrounding regions could experience smaller market sizes and constrained purchasing power, which restricts the development of the high-quality sports industry.
Robustness Test
Endogeneity Test
To address potential endogeneity concerns—particularly the possibility of reverse causality and omitted variable bias between digital economy development and high-quality growth—we employ the interaction term between terrain slope and time as an instrumental variable (IV). Terrain slope is a geographic characteristic that is exogenous to short- and medium-term economic fluctuations, yet it can influence the cost and feasibility of digital infrastructure deployment, thereby indirectly affecting the digital economy. The inclusion of the time interaction term captures exogenous variation over the study period, enhancing instrument relevance.
The first-stage regression results (Table 11) indicate that the interaction between terrain slope and time is strongly positively correlated with the digital economy variable (coefficient = .247, p < .001). The Kleibergen−Paap rk Wald F statistic is 79.34, far exceeding the Stock–Yogo 10% critical threshold (16.38), suggesting no weak instrument problem. Moreover, the Kleibergen−Paap rk LM test rejects the null hypothesis of under-identification, confirming instrument validity. In the second stage, the estimated coefficient of the digital economy variable remains significantly positive (coefficient = 0.154, p < 0.01), supporting the robustness of the baseline results.
Instrumental Variable Estimation Results.

Note. “***” denote significance at the 1% levels.
Replace the Spatial Matrix
The article uses the geographic distance matrix (W2) and geographic economic distance matrix (W3) in place of the economic distance matrix (W1) in the SDM model. Examining the reasonableness of the spatial spillover effects of various influencing factors on the HQD of the sports industry in the nation’s coastal areas under various weight matrices is the aim of this substitution. Table 12 displays these regression results using different weight matrices. The outcomes reveal that the spatial lag term regression coefficients under various spatial matrices are significantly positive, and the mechanism of action is similar to that in the prior paper, while the regression coefficients of several control variables produce more minor fluctuations, demonstrating the greater robustness of the aforementioned conclusions.
Robustness Check.

Note. *, **, *** denote significance at the 10%, 5%, and 1% levels, respectively.
Conclusion and Discussion
Conclusion
The article begins with an examination of the DE’s control mechanisms on the HQD of the sports industry. The central aim of this study is to determine whether residents’ consumption upgrading serves as a mediating factor in the relationship between the DE and the HQD of the sports industry. The research examines residents’ consumption upgrading, the DE, and HQD across 10 eastern provinces in China, using panel data spanning 2012 to 2021. To reveal the theoretical mechanisms, a combination of threshold models, benchmark regression, spatial econometric, and mediation models were utilized, which collectively clarify how consumption upgrading mediates the effect of the DE. The findings provide a comprehensive understanding of how the DE fosters high-quality expansion in the sports sector. Notably, the DE has advanced intelligence in stadium operations and event management, deepening the development of the sports industry through improvements in content, channels, and marketing. This has substantially promoted HQD in eastern regions, broadening market size and influence. Furthermore, the mediation analysis shows that residents’ consumption upgrading, with a mediating effect of 23.2%, plays a key intermediary role in the DE’s impact on HQD. In summary, the results indicate that the DE can significantly enhance the HQD of the sports industry in Eastern China, primarily by driving the upgrading of local consumption patterns. The findings show that the DE significantly affects the sports industry’s HQD through a nonlinear dynamic threshold effect. On the one hand, there is a noticeable path dependence in the industry’s development, with previous performance consistently influencing present advancement. Conversely, the DE strongly encourages HQD, and this beneficial effect is more pronounced at higher levels of residents’ upgrading of their consumption than at lower levels. The upgrading of residents’ income will be specifically influenced by the upgrading of their consumption, which will shift from traditional spectator consumption to more individualized and varied digital sports, fitness, sports tourism, and other new experiential sports consumption. Third, spatial spillover analysis indicates that HQD in Eastern China’s sports industry exhibits clear spillover effects, highlighting the importance of cross-regional movement of key production factors—such as capital and technology—which are vital to achieving HQD objectives. Additionally, the HQD of the sports industry is shaped by multiple factors, including the extent of government participation, urbanization, financial sector growth, investment in fixed assets, technological innovation, and overall economic progress.
Discussion
This study finds evidence that the DE greatly enhances the HQD of the sports sector, with upgrading consumption among locals acting as a moderator. This illustrates how the DE affects both the supply and demand sides. Furthermore, the spatial spillover effects that have been observed imply that digital development has regional diffusion effects, which favorably contribute to the sports industry’s coordinated, cross-regional advancement. These results support the view that valuable information for theoretical investigation, industry practice, and policy design.
For policymakers, the results highlight the need to coordinate digital infrastructure development with policies that stimulate sports consumption. A balanced focus on both supply and demand is essential. The confirmed mediating role of consumption upgrading suggests that targeted incentives and the creation of innovative consumption scenarios can effectively drive diversified sports demand. Moreover, the spatial effects imply the importance of strengthening interregional collaboration to promote cross-border resource flows and reduce regional disparities. For industry practitioners, the findings underscore the strategic importance of digital transformation. Sports enterprises should actively invest in emerging models such as smart venues, virtual competitions, and immersive fitness platforms to expand consumer engagement and market reach. At the same time, businesses should recognize the opportunities in regional collaboration and participate in cross-regional partnerships to improve service delivery and resource allocation. For other stakeholders—including financial institutions, educational organizations, and community groups—this research also offers valuable guidance. Investors may consider prioritizing digital sports ventures, while financial innovation can further integrate capital and industry. Education systems should focus on training interdisciplinary talents in digital and sports fields, and communities and social organizations can play a crucial role in promoting sports services and cultivating consumption culture at the grassroots level.
It is also important to note that there are limitations to this study: (a) The analysis focuses on 10 eastern provinces, ensuring consistency and regional representativeness, but future studies could expand to central and western regions or adopt city-level data to capture broader regional variations and enhance policy relevance. (b) The current index measures overall industry development without distinguishing between subsectors. Refining the framework to examine areas such as sports services, manufacturing, or digital innovation could yield more targeted insights. (c) Although the mediating role of consumption upgrading is emphasized, exploring additional mechanisms—like technological innovation or financial development—may offer a deeper understanding of how the DE shapes the sports sector and further enrich the theoretical foundation.
Footnotes
Ethical Considerations
This study did not involve humans or animals, so the statement is not applicable.
Funding
The authors received no financial support for the research, authorship, and/or publication of this article.
Declaration of Conflicting Interests
The authors declared no potential conflicts of interest with respect to the research, authorship, and/or publication of this article.
Data Availability Statement
The relevant data used in this study can be obtained by contacting the corresponding author.