
Abstract
Mathematics anxiety is an important negative emotion that can impact mathematics achievement. Clinical anxiety research suggests that cognitive biases, specifically negative interpretation bias, can lead to the development of anxiety. The goal of this study is to investigate negative interpretation bias in a mathematics context, whether gender differences exist in this bias, and its content-specific and unique relation with mathematics anxiety. We analyzed data collected online from a sample of 240 undergraduate students that included two new measures of mathematics interpretation bias and scales assessing mathematics anxiety, general anxiety, and test anxiety. Students on average tended to have neutral to slightly positive interpretations of mathematics situations. Group difference tests indicated that female students tended to interpret ambiguous mathematics situations as significantly more negative, less positive, less enjoyable, and with more of a negative interpretation bias than did male students. The mathematics interpretation bias-anxiety link was content specific, with a stronger association found between mathematics interpretation bias and mathematics anxiety relative to the correlations with test and general anxiety. Mathematics interpretation bias was also uniquely related to mathematics anxiety, even after removing variance accounted for by general anxiety, test anxiety, general interpretation bias, mental imagery, and gender. Overall, our work adds to the limited but increasing research on cognitive biases measured in a mathematics context. Negative interpretation bias in a mathematics context is a promising cognitive process to study as research continues to search for important factors that play a role in mathematics anxiety and achievement.
Plain language summary
Mathematics anxiety can be a deterrent to mathematics achievement. We examined the tendency for college students to interpret mathematics as threatening and how it relates to mathematics anxiety. Females tended to have more negative math interpretation biases than males. Mathematics anxiety was strongly related to negative mathematics interpretation bias.
Introduction
Mathematics achievement is consequential for educational and career outcomes (Gottfried et al., 2013; Watt et al., 2017). For example, college students with low levels of mathematics achievement are less likely to pursue or remain in Science, Technology, Engineering, and Mathematics (STEM) majors (Belser et al., 2018). This choice can have long-term impacts on an individual’s financial outcomes, partially because careers in STEM fields typically provide individuals with more financial stability compared to careers in non-science and non-mathematics careers (Fayer et al., 2017; Ritchie & Bates, 2013; Watts, 2020). Given the important role that mathematics achievement plays in short- and long-term outcomes, it is critical to understand which factors can optimize or hinder the development of mathematics skills. One factor that has been implicated in mathematics achievement is the negative emotion of mathematics anxiety, or the “feeling of tension, apprehension, or fear” toward mathematics stimuli (Ashcraft, 2002). Mathematics anxiety is negatively related to mathematics achievement, indicating that individuals with greater levels of mathematics anxiety tend to have lower levels of mathematics achievement (Barroso et al., 2021; Hembree, 1990). This negative relation begins in childhood and can persist throughout adulthood (Hart & Ganley, 2019). Given the prevalence of this link, reducing mathematics anxiety can be an important step to take to reduce the psychological and educational obstacles that interfere with students’ ability to learn mathematics and potential interest in pursuing careers in STEM fields.
Many individual difference factors play a role in the development and maintenance of mathematics anxiety (Rubinsten et al., 2018). In seminal work from the clinical anxiety literature, Beck (1976) proposed the idea that individuals with anxiety are inclined to interpret ambiguous events as threatening as opposed to benign or neutral. This cognitive bias in information processing, known as negative or threat-related interpretation bias, subsequently elicits negative affect like physiological fear and cognitive worry (Mathews & Mackintosh, 2000). Empirical evidence supports a strong association between negative interpretation bias and anxiety (Chen et al., 2020; Du et al., 2023; MacLeod & Mathews, 2012). This association is found to be domain-specific; for example, research studies investigating anxiety related to social situations, spider phobia, and health have each found strong links between threatening interpretations toward social situations, spiders, and health situations and the development of anxieties within these contexts, respectively (Du et al., 2023; Huppert et al., 2003).
Principles derived from cognitive bias models of information processing can also extend beyond the clinical anxiety realm to achievement-specific contexts such as mathematics (Ramirez et al., 2018). Thus, it may be the case that threatening interpretations of benign or neutral stimuli in mathematics contexts, such as mathematics equations or the math classroom environment, can elicit and promote individuals’ negative mathematics affect and anxiety. Despite the plausibility of an association between mathematics-specific negative interpretation bias and mathematics anxiety, we are not aware of any empirical research that has been done to investigate relations between this cognitive bias and mathematics anxiety. Negative interpretation bias can be modified and altered to become more positive or neutral and has been found to causally reduce the experience of anxiety (Beard & Amir, 2009; Hirsch et al., 2016). The possibility of reducing negative mathematics affect through interventions on negative interpretation bias in a mathematics context can be critical for students as they encounter opportunities to complete advanced mathematics coursework and pursue STEM career aspirations. In the current study, we extend research on cognitive interpretation biases to a mathematics-specific achievement context and investigate negative mathematics interpretation bias in a sample of undergraduate students.
Mathematics Anxiety
Originally described as number anxiety, mathematics anxiety has been studied since the mid-1950s alongside its effects on cognitive resources and mathematical reasoning (Dreger & Aiken, 1957). The negative link between mathematics anxiety and mathematics achievement has been consistently documented during this time (Barroso et al., 2021; Ma, 1999). Furthermore, many cognitive, motivational, and affective factors have been implicated in instigating the effects of mathematics anxiety on achievement (Chang & Beilock, 2016). For example, high levels of mathematics anxiety can occupy limited cognitive resources such as working memory, which can then reduce the efficiency and availability of cognitive resources that are needed to solve mathematics problems on a task (Ashcraft & Kirk, 2001; Finell et al., 2022). The downstream effects of mathematics anxiety, particularly those on achievement, are significant barriers for future outcomes that can be removed by reducing both state (i.e., in-the-moment) or trait (i.e., more stable and longstanding) levels of mathematics anxiety (Daker et al., 2021; Núñez-Peña et al., 2013).
Research has aimed to identify factors that can predict mathematics anxiety and its development. Some research has suggested the direct importance of basic numerical skills in the development of mathematics anxiety (Maloney et al., 2010), whereas other research suggests a more indirect relation between basic numerical skills and mathematics anxiety through the poor development of more complex mathematics skills (Douglas & LeFevre, 2018). Contextual and socio-environmental factors have also been found to predict mathematics anxiety. For example, socializers like teachers and parents can signal specific beliefs and attitudes about mathematics through their interactions and behaviors with children that can influence the development of mathematics anxiety during childhood (Maloney et al., 2015; Szczygieł, 2020). Thus, by the time students enter college as young adults they have likely experienced a wide range of behaviors and attitudes toward mathematics stemming from their own abilities and the opinions of and interactions with others in their environment that have shaped their present emotions toward the subject.
Other factors, such as gender, have also been found to predict mathematics anxiety since the 1970s. Specifically, girls tend to report higher levels of mathematics anxiety than do boys (Devine et al., 2012; Justicia-Galiano et al., 2023). Gender differences in mathematics anxiety can exacerbate mathematics achievement gaps and STEM career aspirations between females and males (Levy et al., 2021). This gender difference has been theorized in the past to be due to several different reasons, including response bias (Hunsley & Flessati, 1988), females being more self-critical (Flessati & Jamieson, 1991), and even larger stereotypical beliefs that girls have more mathematics anxiety or are more emotional than boys (Justicia-Galiano et al., 2023). Beyond addressing factors such as socio-environmental influences and mathematics abilities or those that contribute to gender differences, other more ingrained individual cognitive factors or belief systems may need to be targeted as another method to help students overcome the experience of mathematics anxiety.
Cognitive Biases of Anxiety Dysfunction
Foundational cognitive information processing accounts of anxiety dysfunction theorize that individuals are vulnerable to anxiety development due to the tendency or bias to process information as threatening (Clark & Beck, 2010; McNally, 1995). Cognitive biases broadly are thought to form systematically over time, and individuals have varying levels of awareness and controllability available to them throughout the process as it occurs in real time (McNally, 1995). According to Beck and Clark’s (1997) cognitive model of information processing, biases to over-process information as threatening occur via three stages. The first “initial registration” stage orients individuals to environmental stimuli through attention and perceptual cues that are mostly processed automatically. In the second “immediate preparation” stage, a primal threat mode is activated, either automatically or more effortfully, as incoming stimuli pass through a first round of threat appraisals. Additionally, a variety of cognitive, affective, and behavioral patterns are also activated in this stage to enhance an individual’s perceived survival and safety. The third “secondary elaboration” stage is the stage where threat stimuli and the corresponding emotion of fear activated in the second stage are deliberately and effortfully evaluated. This cognitive evaluation requires the activation of existing personal schemas, past knowledge, and relevant coping resources to determine the most adaptive response to the threat stimulus and fear.
Importantly, two biases that are frequently investigated in this cognitive model in conjunction with anxiety are attention bias and interpretation bias (Mathews & MacLeod, 2005). Attention bias occurs early in the model as environmental information and stimuli are selectively filtered through the perceptual system based on their level of perceived threat. Empirical research in the domain of math has investigated the role of attention bias during mathematics problem solving, often using physiological data collection methods such as eye-tracking to precisely capture a person’s attention in the moment of being presented with or having to complete a mathematics task (Li et al., 2023; Rubinsten et al., 2015; Schmitz et al., 2023). Some studies have found positive associations between attention bias toward threatening mathematics-related stimuli and math anxiety (Cuder et al., 2025; Li et al., 2023; Rubinsten et al., 2015) as well as between attention bias and math avoidance behaviors (Schmitz et al., 2023). For example, one study found that students who have high levels of mathematics anxiety are more frequently distracted by irrelevant mathematics-related stimuli and spend more time overall distracted by these stimuli when completing a math task (Li et al., 2023).
In addition to attention bias, interpretation bias is the tendency to assign meaning to incoming stimuli or environmental features as positive, neutral, or threatening. This bias can occur either automatically or deliberately after thought (Beck & Clark, 1997). Assigning an interpretation to a stimulus reflects a critical point in the cognitive information processing model; whereas an attention bias toward certain stimuli identified through the perceptual system can initiate feelings of anxiety, the interpretation of those stimuli as threatening can potentially determine the strength of the anxiety response, prolong its expression, and continue to maintain the cyclical and maladaptive impact of an otherwise neutral stimulus (Cristea et al., 2015; Everaert et al., 2013). Empirical evidence suggests that interpretation bias is correlated with anxiety (Chen et al., 2020; Yeung & Sharpe, 2019). This correlation is on average greater than the correlation between attention bias and anxiety (Bar-Haim et al., 2007; Stuijfzand et al., 2018). Some research also finds that interpretation bias can predict anxiety in the long-term and causally impact and change anxiety levels (Bean et al., 2023; Henricks et al., 2022; Martinelli et al., 2022; White et al., 2011).
It is likely that a threatening interpretation bias may occur frequently across achievement settings. These frequent experiences may compound over time as students learn and experience academic failure and success. Although some older research has indicated that students with high levels of test anxiety tend to interpret test situations in a threatening way (Calvo et al., 1997), interpretation bias has largely been unexamined in achievement settings. In the mathematics domain, recent theoretical work has proposed an interpretation account for the development of mathematics anxiety that coincides with research on interpretation biases in clinical anxiety research. This novel account suggests that students assign meaning to their previous mathematics experiences and outcomes which then gives rise to their worry and apprehension toward mathematics (Ramirez et al., 2018).
Furthermore, gender differences to interpret ambiguous stimuli as threatening may also provide some insight into the gender difference in mathematics anxiety: research has found that adolescent girls are more likely to hold a stronger negative interpretation bias than adolescent boys, but they hold similar levels of a positive interpretation bias (Gluck et al., 2014; Miers et al., 2008). To move the mathematics anxiety field forward, further research in this area is necessary to understand the role that interpretations of negative mathematics situations have in the development of mathematics anxiety.
Measuring Interpretation Biases
Despite the difficult nature of identifying often unconscious cognitive biases, the clinical anxiety literature has produced research to evaluate, assess, and even modify interpretation biases. For example, experimental research studies have developed cognitive bias modification (CBM) interventions for both attention bias and interpretation bias primarily to seek out the causal nature of the relation between these biases and anxiety (Jones & Sharpe, 2017; Mathews & Mackintosh, 2000). Furthermore, the gold standard therapeutic treatment for anxiety disorders, cognitive behavioral therapy, takes into account the role of maladaptive cognitive biases and aims to root them out through a structured and intensive therapeutic regimen (Butler et al., 2006).
To measure interpretation biases for research purposes, there are several things to consider. First, interpretation biases are usually assessed within specific domains, content areas, or contexts and are found to have strong links with anxiety types within their respective areas, such as depression, health anxiety, social anxiety, spiders. In fact, meta-analyses examining interpretation biases in child and adolescent samples have found stronger links between interpretation bias and anxiety subtypes that match the specific interpretation bias assessed within a measure than with non-matching anxiety subtypes (Stuijfzand et al., 2018). Second, interpretation biases may appear at different points of the information processing model. Beck and Clark’s (1997) model of cognitive biases, described in the previous section, provides a starting point for an estimated timeline of the activation and potential controllability of different cognitive biases as they occur. The more automatic interpretation biases occur early in the cognitive processing timeline and are labeled “online.” The more deliberate interpretations occur later in the timeline as information is further processed and contextualized and are labeled “offline” (Collins et al., 2022). Assessments of interpretation biases may differ in whether they capture more online or offline biases.
Online measures often task individuals with responding as quickly as they can to varying resolutions of or associations between ambiguous scenarios and/or words. For example, in an older study by Richards and French (1992), participants were primed in a lexical decision task with either a threatening or non-threatening word from a homograph word pair (i.e., stroke) and then asked to rate how related the presented word was with one of the word’s meanings (i.e., cat or heart). Other online measures focus on resolving ambiguous scenarios (Dillon et al., 2016; Ogniewicz et al., 2014). For example, trials in the computer-based Word-Sentence Association Paradigm (WSAP) by Beard and Amir (2009) are made up of either a negative or positive word presented to an individual for 500 ms and then the appearance of an ambiguous sentence. Individuals are asked to answer if they believe the sentence and word are related to each other as quickly as possible with a “yes” or “no” response on the computer. Each sentence is presented twice throughout the task, once with a positive word and once with a negative word. These measures often collect reaction times (RT) and responses and calculate interpretation bias scores based on these data (Beard & Amir, 2009; Gonsalves et al., 2019).
On the other hand, more “offline” measures of interpretation bias present individuals with descriptive, ambiguous scenarios to resolve or rate after some level of reflection (Mathews & Mackintosh, 2000). These tasks are usually labeled as Ambiguous Scenarios Tasks (AST). For example, in the AST used in Holmes and Mathews (2005), individuals are presented with descriptions of ambiguous scenarios that are usually at least a couple of sentences long. They are then asked to indicate how pleasant they find the ambiguous scenario to be on a Likert scale. Past studies have also found that including components of mental imagery into the instructions of the AST, such as asking participants to imagine themselves in the position of the person in the scenario, can lead to stronger reports of emotion than just verbal instructions alone (Holmes et al., 2006; Holmes & Mathews, 2005).
Overall, both online and offline scales are useful in measuring interpretation bias toward different situations and stimuli, such as social and general situations as well as toward spiders. Although presented differently, both online and offline interpretation bias scales can also differentiate levels of negative interpretation bias held by individuals with high, low, and clinical levels of anxiety in different domains (Beard & Amir, 2009; Berna et al., 2011; Brosan et al., 2011; Teachman & Addison, 2008).
Present Study
In the current study, we build on past research on mathematics anxiety as well as the clinical psychology literature to explore the construct of interpretation bias within the novel context of mathematics. We (1) investigate levels of endorsement of negative interpretation bias in a mathematics context in a sample of undergraduate students, (2) assess for gender differences in this bias, (3) test for the content-specificity of the associations between negative mathematics bias and self-reported mathematics anxiety, test anxiety, and general anxiety, and (4) investigate the unique relation between mathematics interpretation bias and mathematics anxiety after accounting for several important covariates of gender, general and test anxiety, general interpretation bias, and mental imagery. We included mental imagery as a covariate due to past research linking imagery with emotionality (Holmes et al., 2006). Given the lack of research instrumentation in this area, we use two new measures that were recently developed to assess mathematics-related interpretation biases in adults in the current study (Casanova et al., 2020).
Method
Participants
Data from a sample of 245 college students enrolled in a large, public southern university in the United States were collected for this study. Five participants failed at least one of the six attention check items interspersed throughout the questionnaire and were removed from the data set. The final analytic sample was made up of 240 students. Participants were recruited through an undergraduate psychology subject pool. Students who reported age (n = 2 missing) were on average 18.85 years old (SD = 1.14). Female students made up 71% of the sample (28% male; 1% missing). Students were asked to report their race and ethnicity with a list of options and to select all that apply. Around 10.4% of students identified their race as Asian, 0.8% identified as Black, 5.4% identified as Multiracial, 59.2% identified as White (Non-Hispanic), and 11.7% identified as both White and Hispanic together. An additional 12.1% reported their ethnicity as Hispanic but did not indicate their race. One participant preferred not to declare their race or ethnicity (0.4%).
Measures
Interpretation Bias in Mathematics Scales
Two new measures of mathematics interpretation bias were researcher-developed prior to this study by adapting the WSAP format by Beard and Amir (2008) and the AST format depicted in Holmes and Mathews (2005) to mathematics-specific scenarios (Casanova et al., 2020). Details about the scale development, which involved initial item development, expert reviews, and two rounds of cognitive interviews are available in the Supplemental Materials. The final items from these two new measures are available in the Appendix.
Word-Sentence Association Paradigm-Mathematics (WSAP-M)
The instructions and protocol for the WSAP-M were adapted from the original WSAP (Beard & Amir, 2008). Students were instructed to rate, as quickly as they could, how related they thought a word and sentence presented to them were to each other on a Likert scale from 1 (not at all related) to 6 (very related).
The WSAP-M is made up of a practice block and a test block. Trials in each block are made up of a fixation point presented in the middle of a computer screen for 250 ms. The fixation point was then replaced by a sentence. After 500 ms, a word appeared under the sentence along with a 6-point Likert scale. As soon as the participant clicked their response on the screen, the next trial would begin. The practice block had three trials with non-math related sentences to familiarize participants with the task. The test block had 48 trials, with 24 unique mathematics-related sentences appearing twice. Sentences briefly described a vague situation that might be encountered while doing mathematics or taking a mathematics course. Sentences appeared once with a benign or positive word and a second time with a negative or threat word that resolved the ambiguity of the scenario. Example items and associated word pairs from the WSAP-M include: “Your math instructor is showing how to do a problem up on the board.” (benign: follow along, threat: confused), “You find out the grade you got on the math exam” (benign: smart, threat: dumb), and “You miss your math class but you are told by a classmate about the work you missed.” (benign: understand, threat: concerned).
A positive WSAP-M score was calculated by averaging the ratings from each of the mathematics-specific positive word pair trials (Cronbach’s α = .88), and a negative WSAP-M trial score was calculated in the same way but with the ratings from the mathematics-specific negative word pair trials (Cronbach’s α = .92). We also calculated a negative bias score by deducting the positive trial scores from the negative trial scores, with higher scores indicating greater negative interpretation biases (Cronbach’s α = .91).
Ambiguous Mathematics Scenarios Task (AMST)
The AMST is a self-report survey made up of 14 items. The instructions and protocol for the AMST were adapted from the AST by Holmes and Mathews (2005). Participants were instructed to read through items describing various ambiguous mathematics-related scenarios. The items are mostly made up of 1 to 2 sentences. Participants were directed to think about how they would feel if they were in the scenario and imagine themselves in the scenarios from each item. Participants were asked to rate how pleasant they thought each scenario was, using a scale from 1 (extremely unpleasant) to 9 (extremely pleasant). Example items from the AMST include “Your instructor hands you your math test back and the paper is facing down. You pick it up and turn the paper over,”“You are asked to explain why you got an answer on a math word problem in class. You look down at the answer you have before you say it out loud,” and “You review your notes from math class. As you read over them, you think about what you know.” Scores from this task are calculated by taking the average of the ratings from the 14 items (Cronbach’s α = .89). We reverse-scored the items in this study so that higher scores indicate greater biases to interpret mathematics situations and stimuli negatively.
Mathematics Anxiety
Participants completed the 9-item Abbreviated Math Anxiety Scale (AMAS; Hopko et al., 2003). Participants were asked to rate each item for how much anxiety they would feel in each situation, on a 5-point scale from 1 (low anxiety) to 5 (high anxiety). Example items from the AMAS include “Watching a teacher work an algebraic equation on the board,”“Taking an examination in a math course,” and “Listening to a lecture in math class.” Higher scores on this variable indicated higher mathematics anxiety levels (Cronbach’s α = .87).
Test Anxiety
Participants completed the 5-item Short Form of the Test Anxiety Inventory (Taylor & Deane, 2002). Participants were asked to report how frequently they experienced each of the following specific symptoms of anxiety before, during, or after tests and examinations, on a 4-point scale from 1 (Not at all) to 4 (Very much so). Example items from the test anxiety inventory include “I feel very panicky when I take an important test,”“I wish examinations did not bother me so much,” and “I seem to defeat myself while working on important tests.” Higher scores on this variable indicated higher test anxiety levels (Ordinal α = .85).
General Anxiety
Participants completed the 7-item brief measure of the GAD-7 to assess for symptoms of generalized anxiety disorder (Spitzer et al., 2006). Participants were presented with seven problems they may experience and asked to rate how often they had been bothered by each problem over the last 2 weeks. Participants selected their frequency for each problem on a 4-point scale, including from 1 (Not at all), 2 (several days), 3 (more than half the days) to 4 (nearly every day). Example problems from the GAD-7 include “Feeling nervous, anxious or on edge,”“Not being able to stop or control worrying,” and “Being so restless that it is hard to sit still.” Ratings on the 7 items were averaged together, with higher scores indicating higher general anxiety levels (Ordinal α = .91).
General Interpretation Bias
Participants completed 40 trials derived from the WSAP general scale developed by Beard and Amir (2008; referred to as WSAP-G hereafter). The same response options, protocol, instructions, and scoring methods from the WSAP-M were also used for the WSAP-G. Items were sentences consisting of descriptions of generally ambiguous scenarios. There were 20 sentences presented twice. The sentence was presented once with a negative word and again with a positive word. Example items and associated word pairs from the WSAP include “The chest was opened slowly” (benign: treasure; threat: hospital), “You see a big flash of light” (benign: camera; threat: bomb), and “A loud noise is heard at night” (benign: fireworks; threat: robber). A negative word score (Cronbach’s α = .78), positive word score, (α = .79), and negative bias score were calculated for this scale (Cronbach’s α = .16).
Mental Imagery
Participants completed five items adapted from the Spontaneous Use of Imagery Scale (SUIS; Reisberg et al., 2003). They were asked to rate the degree to which they agreed that the item described them, on a scale from 1 (strongly disagree) to 5 (strongly agree). Example items from the SUIS include “I prefer to read novels that get me to easily imagine where the characters are and what they are doing, rather than novels that are difficult to imagine visually,”“Whenever I think about a series of errands I have to run, I imagine the location of the stores that I need to go to and picture the route I would need to take,” and “When I search for new furniture in a store, I always imagine what the furniture will look like in certain places in my house.” Higher scores on this variable indicated higher mental imagery use (Cronbach’s α = .68).
Gender
For the gender variable, participants were asked to respond to the question “What is your gender?,” with “Female,”“Male,”“Prefer not to say”, and “Other (specify)” presented as possible answer choices. This variable was coded as 1 for Female and 2 for Male. Due to the small number of responses (n = 2), those who responded “Other” were not analyzed in this study and coded as missing.
Procedure
This online study was posted on a psychology subject pool website during the Spring of 2024. Students completed a series of online surveys and tasks, including those analyzed in the current study and other surveys and tasks unrelated to the current research questions (i.e., mathematics self-concept and intelligence mindset surveys, implicit mathematics-anxiety association task). We used the Qualtrics survey platform to collect study data. The order of tasks presented were counterbalanced so that half of the students completed the WSAP-based items (combined mix of WSAP-M, and WSAP-G items), AMST, and implicit mathematics-anxiety association task first and then answered the surveys (anxiety, mental imagery, mathematics self-concept and mindset). The other half completed the surveys first and then the WSAP-based items, AMST, and implicit mathematics-anxiety association task. All participants were asked background and demographic questions at the end of the study. The study was completed on participants’ own personal computers during their own time and in their desired location. It took around 30 min to complete the study and students who participated received course credit.
This study received ethical approval from Texas A&M University’s Institutional Review Board (IRB2021-0014M). The IRB determined that this research involved minimal risk. Participants received an information sheet and confirmed their participation and consent of the use of their responses prior to participating in the study.
Data Analysis
Two types of variables were used in our analyses for each scale-based variable. Average score variables were calculated with available data from the items within a scale. Parcel variables were also created to use in latent factor models to minimize the potentially large number of indicators in structural equation model (SEM) analyses with our limited sample.
Parcel variables were derived from the unidimensional balanced parceling procedure described in Little et al. (2013). For each scale, we created three parcel variables that were made up of the mean score of a subset of the items from the scale. Parcel groups were created by first grouping together the item with the highest item-scale correlation and the item with the lowest item-scale correlation into one parcel (Parcel 1). The same grouping procedure was used for the item that had the second highest and second lowest item-scale correlation item-scale correlation (Parcel 2), and for the third highest and third lowest item-scale correlation (Parcel 3). The item with the fourth lowest item-scale correlation was then added to the Parcel 1 group, fifth lowest item-scale correlation was added to Parcel 2 group, and so on until each scale item was grouped with a parcel. The mean score between the group of items within a parcel were computed as a new parcel variable. The three new parcel variables for each scale were used as indicators in their corresponding latent factors in the SEM.
To test our first research question, we report descriptive statistics from the average score variables for each of the two mathematics interpretation bias measures. To assess for gender differences in the mathematics interpretation bias scores, we conducted a one-way analysis of variance (ANOVA) with the three average WSAP-M scores and the AMST average score. These analyses were conducted in IBM SPSS Statistics (Version 29).
To test for the content-specificity of the associations between mathematics interpretation bias and anxiety, we calculated polychoric correlations among the latent factors for each scale-based variable and gender in MPlus (version 8; Muthén & Muthén, 2017) using the Weighted Least Squares Means Variance estimator (WLSMV; default when a categorical observed variable is involved in a correlation). We also statistically compared correlation coefficients for size differences using the cocor package in R software, version 4.4.1 (Diedenhofen & Musch, 2015; R Core Team, 2024). The Zou (2007) method was used to assess the significance of the difference between two dependent correlations that contain an overlapping variable (i.e., one variable is the same in the pair of correlations being compared).
To investigate the unique relation between mathematics interpretation bias and mathematics anxiety, we conducted latent factor SEM using the maximum likelihood estimator in MPlus (version 8). Models included mathematics anxiety as a dependent latent factor and either WSAP-M negative bias score or the AMST score as well as test anxiety, general anxiety, WSAP-G negative bias score, and mental imagery as independent latent factors. Gender was also included as a categorical independent variable.
Results
Descriptive Statistics
Table 1 presents the descriptive statistics for average scores from the scale-based variables. Supplemental Materials include descriptive statistics for the parcel variables (Supplemental Table S10) and item-level missing data for the scale variables (Supplemental Table S11). Our study variables were normally distributed, as indicated by skewness values lower than the absolute value of 2 and kurtosis values lower than the absolute value of 7 (Hair et al., 1998; Q-Q plots for average scores and parcel variables available in the Supplemental Materials Figures S1–S3).
Descriptive Statistics for Study Variables.

Note. Descriptive statistics based on average scale scores; N = 240; Skew = Skewness; Kurt = Kurtosis; α = Cronbach’s alpha except for * which indicates ordinal alpha.
Notably, the WSAP-General bias score variable was removed from our main analyses due to poor reliability of the bias score items in this scale (Cronbach’s α = .16). We report correlation and regression analysis results in the Supplemental Materials that include the parcel variable-based latent factor of WSAP-G negative bias score (Supplemental Tables S12–S14).
Average Levels of Mathematics Interpretation Bias
Students had similar moderate-to-high levels of agreement (on a 1–6 scale) with how related they thought positive words were to ambiguous mathematics sentences (WSAP-M Positive Rating M = 4.11) and how related they thought negative words were to these sentences on the WSAP-M (WSAP-M Negative Rating M = 3.99). The negative interpretation bias average score from the WSAP-M was just past the positive side of the scale but near zero (M = −0.11) on the −5 to 5 scale. Average scores on the reverse-scored AMST scale indicated students reported ambiguous mathematics scenarios to be moderately unpleasant, with an average score above the middle of the scale (M = 5.45 on the 1–9 scale).
Gender Differences in Mathematics Interpretation Bias
We first tested the basic assumption of the standard ANOVA test requiring homogeneity of variance of the mathematics interpretation bias variables across gender groups. We found that the variances were homogenous for females and males for the WSAP-M variables but not for the AMST variable (Levene’s test F = 7.25, p = .008). Given these Levene’s test results and the imbalance of the sample sizes for the gender groups (Female = 171, Male = 67), we report our gender difference findings in our mathematics interpretation bias variables using results obtained from Welch’s ANOVA test (Delacre et al., 2017).
Significant gender differences were found in all three WSAP-M scores and the AMST scores (Table 2). Male participants tended to have higher positive interpretations of mathematics situations on the WSAP-M than female participants (d = −0.29). Conversely, female participants tended to have higher negative interpretations of mathematics situations on the WSAP-M (d = 0.61), greater biases to interpret ambiguous mathematics situations on the WSAP-M as negative (d = 0.60), and greater lack of enjoyment (lower enjoyment) on the AMST (d = 0.27) than male participants.
Analysis of Variance for WSAP-M and AMST Variables by Gender.
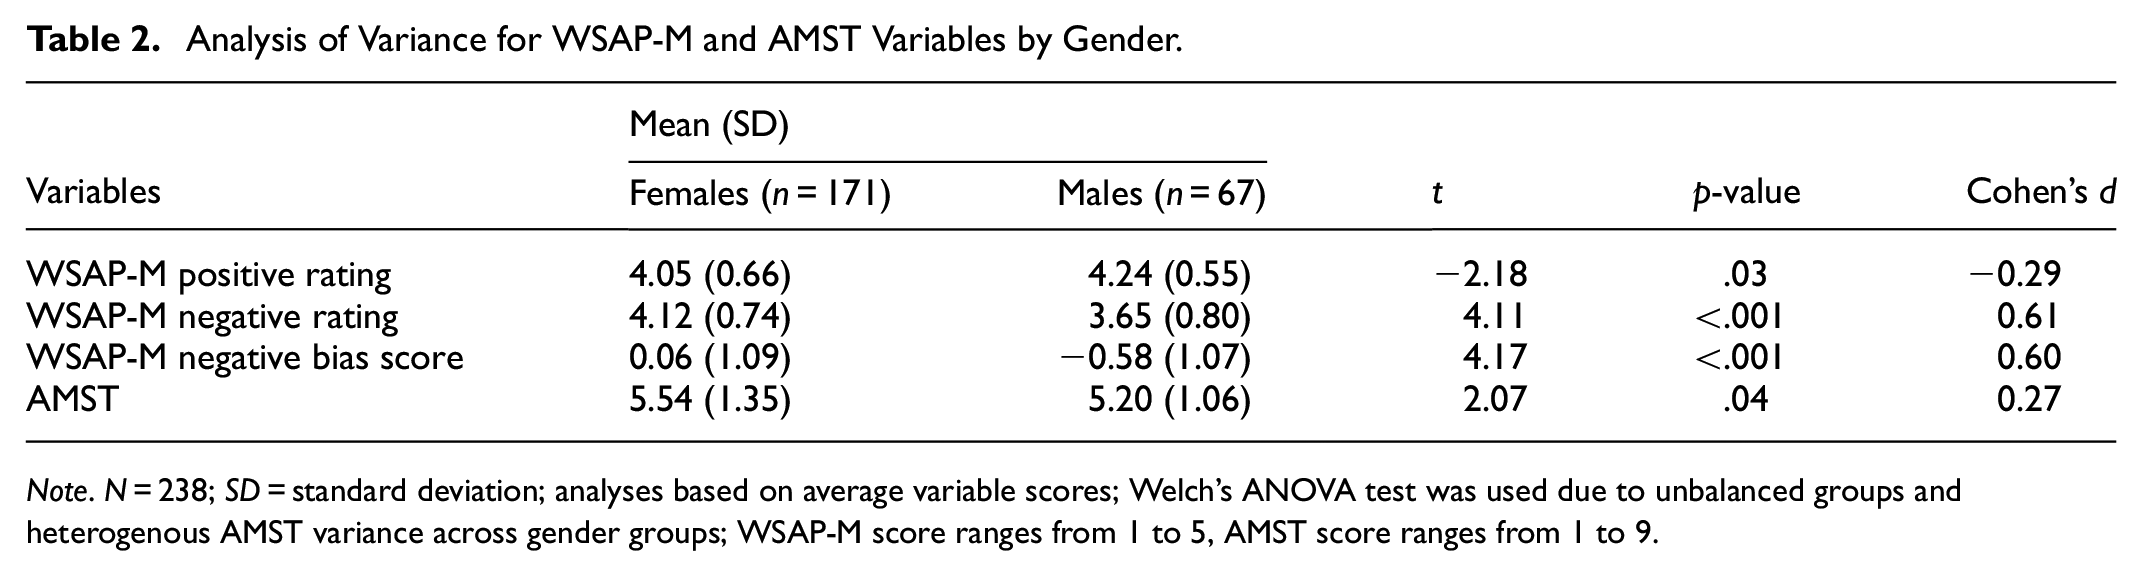
Note. N = 238; SD = standard deviation; analyses based on average variable scores; Welch’s ANOVA test was used due to unbalanced groups and heterogenous AMST variance across gender groups; WSAP-M score ranges from 1 to 5, AMST score ranges from 1 to 9.
Correlations with Anxiety Subtypes
Table 3 presents polychoric correlation coefficients among the latent factors of the study variables. Figure 1 displays scatter plots of the correlations that were compared. Of note, AMST had a strong and significant negative association with WSAP-M positive ratings (r = −.55), a moderate and positive association with the WSAP-M negative ratings (r = .44), and a strong, positive correlation with WSAP-M negative bias score ratings (r = .62). Additionally, the correlation between gender and WSAP-M was significant, but it was not significant between gender and AMST.
Correlation Coefficients Among Study Variables.
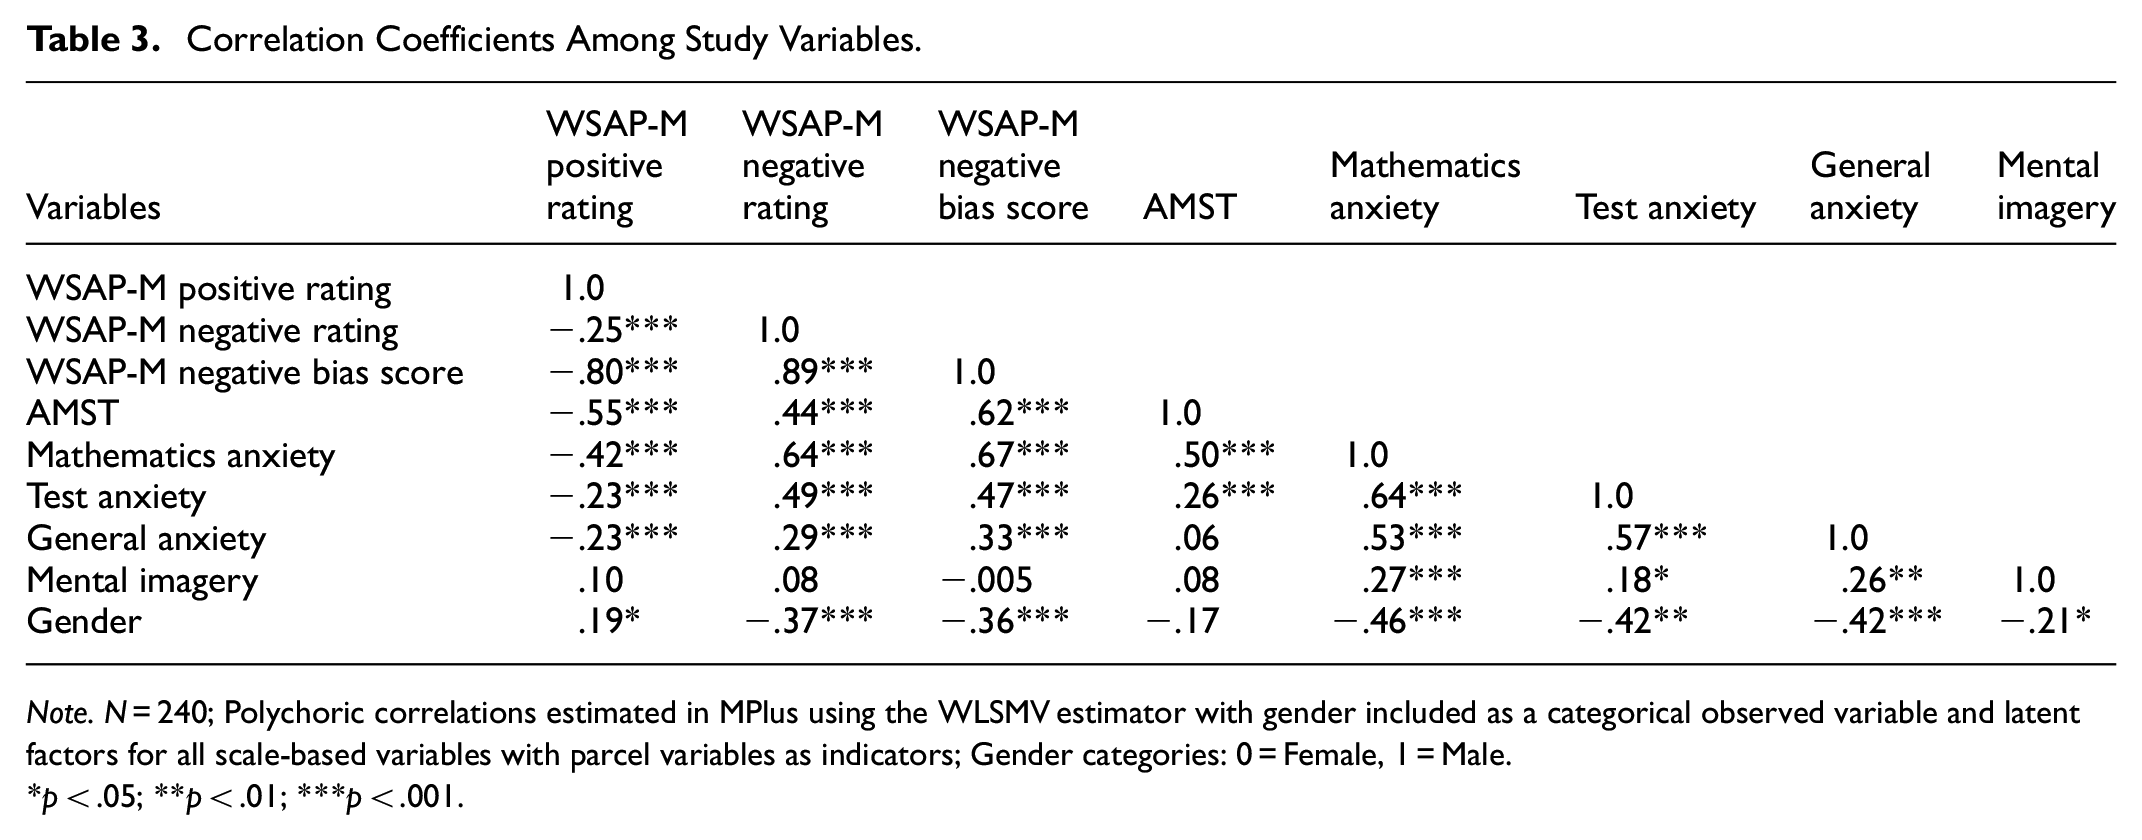
Note. N = 240; Polychoric correlations estimated in MPlus using the WLSMV estimator with gender included as a categorical observed variable and latent factors for all scale-based variables with parcel variables as indicators; Gender categories: 0 = Female, 1 = Male.
p < .05; **p < .01; ***p < .001.

Scatter plots between average scores on the WSAP-M and math anxiety, test anxiety, and general anxiety (first row) and between average scores on the AMST and math anxiety, test anxiety, and general anxiety (second row).
WSAP-M
The WSAP-M negative bias score had a strong, positive, and significant relation with self-reported mathematics anxiety (r = .67). The associations between WSAP-M and test anxiety, (r = .47), and general anxiety, (r = .33), were both moderately positive and statistically significant as well. The 95% confidence interval (CI) for the test assessing the difference between the WSAP-M and mathematics anxiety correlation and the WSAP-M and test anxiety correlation did not include 0 [0.11, 0.29], indicating the two correlations were not equal and, thus, significantly different from each other. We found the same result of a significant difference between the WSAP-M and mathematics anxiety correlation and the WSAP-M and general anxiety correlation, 95% CI [0.24, 0.45]. Given the related domains of test anxiety and mathematics anxiety, we also considered if test anxiety had a stronger correlation with WSAP-M than did general anxiety; the result did not include zero in the 95% CI [0.04, 0.25], indicating that these two correlations significantly differed from each other as well.
AMST
AMST had a moderate, significant, and positive relation with self-reported mathematics anxiety (r = .50). The association between AMST and test anxiety was small, positive, and significant (r = .26). The relation between AMST and general anxiety was not statistically significant (r = .06). In statistically comparing the correlations, we found that the 95% CI for the difference between the AMST-mathematics anxiety correlation and the AMST-test anxiety correlation did not include 0, and was statistically significant [0.15, 0.34], indicating a difference in the strength of these two correlations. We found the same significant result for the difference between the AMST-mathematics anxiety correlation and AMST-general anxiety correlation, 95% CI [0.33, 0.55]. We also tested if test anxiety had a stronger correlation with AMST than did general anxiety. The result did not include zero in the 95% CI [0.08, 0.31], indicating that these two correlations significantly differed from each other.
Unique Relations With Mathematics Anxiety
Tables 4 and 5 present results from SEMs we conducted using latent factors based on parcel variables (i.e., mean of set of items within scale) to predict math anxiety from the WSAP-M negative bias score and AMST score, separately.
Structural Equation Model Results with WSAP-M Predicting Mathematics Anxiety.
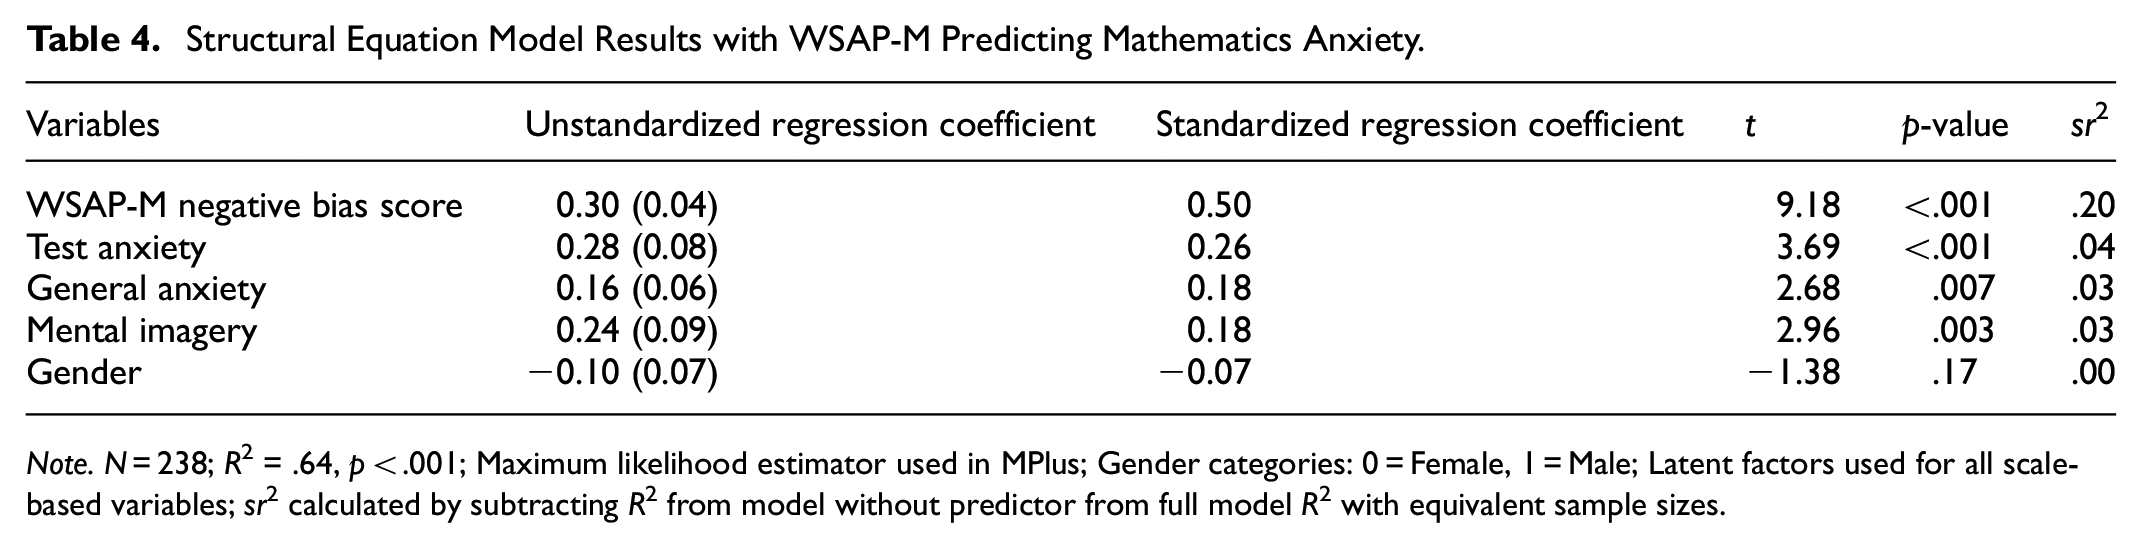
Note. N = 238; R2 = .64, p < .001; Maximum likelihood estimator used in MPlus; Gender categories: 0 = Female, 1 = Male; Latent factors used for all scale-based variables; sr2 calculated by subtracting R2 from model without predictor from full model R2 with equivalent sample sizes.
Structural Equation Model Results with AMST Predicting Mathematics Anxiety.
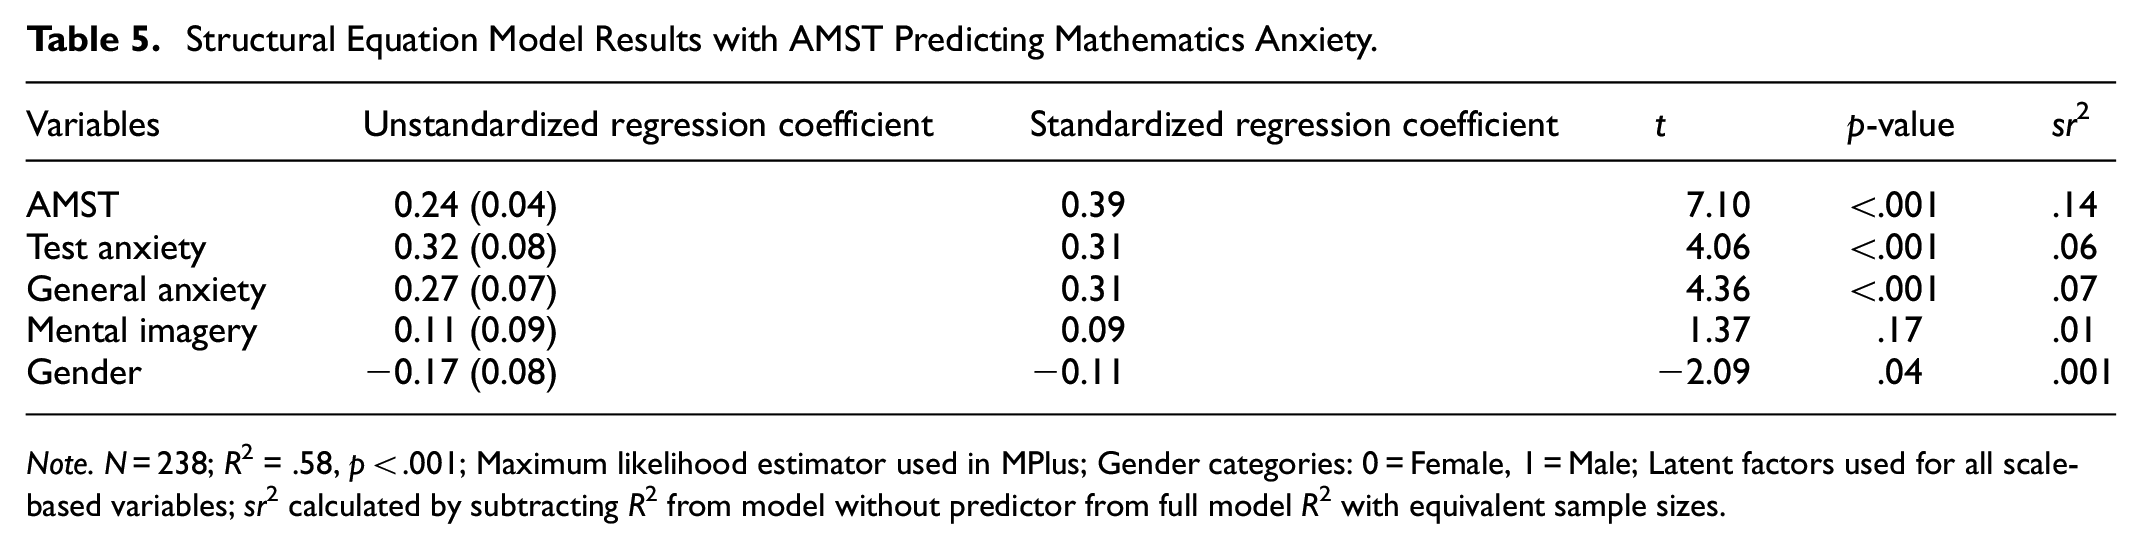
Note. N = 238; R2 = .58, p < .001; Maximum likelihood estimator used in MPlus; Gender categories: 0 = Female, 1 = Male; Latent factors used for all scale-based variables; sr2 calculated by subtracting R2 from model without predictor from full model R2 with equivalent sample sizes.
WSAP-M
The set of predictors in the model predicting self-reported math anxiety as a function of WSAP-M negative bias ratings and covariates together explained a significant amount of variance in math anxiety (R2 = .64). WSAP-M negative bias score was a significant predictor of math anxiety. For every 1 standard deviation increase in WSAP-M negative bias score, math anxiety score increased by 0.50 standard deviations on the math anxiety scale. Test anxiety (β = .26), general anxiety (β = .18), and mental imagery (β = .18) were also significant predictors in the model. Gender was not a significant predictor in this model.
AMST
The set of predictors in the AMST model together predicted a significant amount of variance in mathematics anxiety (R2 = .58). AMST was a significant predictor of mathematics anxiety. For every 1 standard deviation increase in AMST, math anxiety score increased by 0.39 standard deviations on the mathematics anxiety scale. Test anxiety (β = .31), general anxiety (β = .31), and gender (β = −.11) were also significant predictors of mathematics anxiety. Male participants’ math anxiety level on average was lower compared to females by 0.11 standard deviations on the mathematics anxiety scale. Mental imagery was not found to be a significant predictor in this model.
Discussion
Given the importance of mathematics achievement for educational and life outcomes, understanding how factors like mathematics anxiety develop can help to reduce negative mathematics affect and its negative consequences, which can subsequently increase engagement and interest in mathematics and optimize student mathematics learning. In this study, we investigated negative interpretation bias in a mathematics context in a sample of college students and the relation between this bias and mathematics anxiety. We assessed mathematics interpretation bias with two novel measures adapted from existing work in the clinical anxiety literature. We found that college students generally, but more so male students, favored interpreting mathematics situations as more positive than negative. We also found that the relation between negative mathematics-related interpretation bias and anxiety was content specific— mathematics-related interpretation bias had a stronger association with mathematics anxiety than to test or general anxiety. Finally, we provide empirical evidence that negative mathematics interpretation bias has a unique relation with mathematics anxiety. This was found even after accounting for other important predictors of mathematics anxiety such as test anxiety, general anxiety, and gender. Overall, our study suggests that mathematics interpretation bias may be an important cognitive bias to study as research continues to understand the person-level factors that influence mathematics anxiety.
Measuring Negative Interpretation Bias in a Mathematics Context
Existing measures assess biased interpretations of neutral stimuli that occur online and in-the-moment (Würtz & Sanchez-Lopez, 2023), such as the WSAP (Beard & Amir, 2009; Dillon et al., 2016; Ogniewicz et al., 2014), as well as biases that occur offline and require more deliberate thought, such as the AST (Eysenck et al., 1991; Holmes & Mathews, 2005). We adapted the WSAP and AST in our study specifically to assess offline and online interpretation biases in mathematics contexts. In the WSAP-M, participants were instructed to answer as quickly as possible so that we could obtain a more online response of biased processing. For the AMST, we instructed participants to imagine themselves in the scenarios they were reading so that responses would be indicative of their own personal agreement of the pleasantness of each situation. Items in both assessments described a mix of situations that learners might experience in formal and informal mathematics settings, including taking a mathematics test, completing mathematics problems, and discussing mathematics with others. We found adequate reliability for the negative word trials and positive word trials from the WSAP-M and for the items in the AMST, suggesting that these new measures are reliable. This aligns with past work using the WSAP and adapted versions (Dillon et al., 2016; Gonsalves et al., 2019) as well as the AST (Berna et al., 2011) to assess interpretation biases.
We also found that, on average, students in our sample tended to agree that ambiguous mathematics scenarios were similarly related to both positive and negative word pairs as presented in the WSAP-M. Furthermore, students tended to have slightly more of a positive interpretation bias toward mathematics, based on the negative interpretation bias score indicating less negative biases. Students also reported, on average, feeling moderate levels of unpleasantness in experiencing the ambiguous mathematics-related scenarios posed in the AMST. Research in the clinical anxiety literature typically measures and compares levels of negative interpretation bias in groups of clinically or high anxious participants and groups of non-clinical participants (Beard & Amir, 2009). Non-clinical participants tend to have greater levels of positive or neutral interpretations of ambiguous situations compared to clinical or highly anxious participants. In our study, we did not select for high or low mathematics anxious students, but our findings do align with the average levels of negative interpretation bias that are found in samples that are unselected and meant to represent a group with a wide range of anxiety levels (Creswell & O’Connor, 2011; Huppert et al., 2003).
Gender Differences in Mathematics Interpretation Biases
In our study, we found gender differences in each of the scores derived from our measures of mathematics interpretation bias in group difference tests that accounted for the imbalance in the sizes of male and female groups. Specifically, female students tended to interpret ambiguous mathematics situations as more negative, less positive, and less pleasant than did male students. Female students also had a greater negative interpretation bias toward mathematics-related situations. Interestingly, our correlation results suggested that there was no difference between male and female scores in the latent factor of AMST; however, this may likely be due to the correlation analysis not accounting for the gender group imbalance of our sample.
Research investigating children and adolescents’ negative interpretation bias across different contexts have found gender differences that align with the patterns we found in the present study (Bean et al., 2023; Gluck et al., 2014; Miers et al., 2008; Mobach et al., 2019). Research examining gender differences in negative interpretation bias in adult samples has been more limited and less consistent with regard to the pattern of results (Amin et al., 1998; Kingsbury & Coplan, 2016). For example, a study by Amin et al. (1998) did not find any gender differences in their assessment of negative interpretation bias of social situations. In a different study, Kingsbury and Coplan (2016) did not find any gender differences in negative interpretation bias of computer mediated communication (i.e., text messages) in one of their study samples. However, they did find that adolescent girls had a stronger negative bias than adolescent boys did in a second study sample. It is possible that, for adults, the context and perceptions of the context differentiate whether a gender difference exists in biases about ambiguous scenarios.
Although our study is not intended to assess why gender differences in mathematics anxiety exist, it might be worthwhile for future research to consider the role of gender in the link between negative mathematics interpretation bias and mathematics anxiety. Some research has found gender differences in how negative interpretation bias about ambiguous scenarios relate to anxiety in adults (Kingsbury & Coplan, 2016). Our correlation analyses show a gender difference in mathematics anxiety, where female participants report higher levels of mathematics anxiety than do male participants. We continued to find a gender difference in mathematics anxiety in the AMST regression model, yet we did not find gender to be a significant predictor of mathematics anxiety in the WSAP-M regression model. Given this finding, it is possible that negative mathematics interpretation bias when assessed with the WSAP-M might explain some of the gender difference in mathematics anxiety.
Overall, future research should investigate causes of the gender differences in mathematics interpretation bias for both positive and negative interpretations of ambiguous mathematics situations and negative interpretation bias in mathematics contexts as well as examine whether these biases explain the link between gender and mathematics anxiety.
Correlations Between Mathematics Interpretation Bias and Anxiety
Our correlational analyses provided us with an understanding of the strength and magnitude of the correlations between our mathematics interpretation bias measures and other important variables. Although not an intended aim in this study, the correlations provided interesting information about the general strengths of relations between the two interpretation bias measures and anxiety. Specifically, previous research has found stronger correlations between offline measures of interpretation bias and anxiety than online measures (Miers et al., 2020). However, we found the opposite of this pattern: stronger correlational and unique relations were found between each anxiety subtype and online measures (WSAP-M) relative to those relations between anxiety and offline measures (AMST). It is unclear why our findings contrast with those of previous work, but future research should compare the consistency of the strength of the association between anxiety and offline as well as online measures of cognitive biases that may further inform Beck and Clark’s cognitive model of information processing (1997) in a mathematics domain.
Besides this, our correlational analyses mainly focused on the content-specific nature of the anxiety-interpretation bias link and the connections that interpretation bias has in a mathematics context. We found that mathematics interpretation bias had a stronger association with mathematics anxiety relative to the moderate and small correlations it had with test and general anxiety, respectively. This was the case for both measures of mathematics interpretation bias. Young adults with high levels of mathematics anxiety may be more inclined to interpret ambiguous mathematics situations as negative, and, based on our findings, this inclination will be less true for students with high levels of test anxiety and general anxiety. These findings align with past research that has found some support for the content-specific nature of the relation between interpretation bias and anxiety in other domains (Bögels et al., 2003; Chan et al., 2020; Klein et al., 2019; Miers et al., 2008; Stopa & Clark, 2000; Subar et al., 2022).
Interestingly, we also found that mathematics interpretation bias had a stronger association with test anxiety relative to the correlation that it had with general anxiety. Test anxiety does have a strong overlap with math anxiety (Devine et al., 2012), as math test situations often make students anxious. Similarly, many of the items in the AMST and WSAP-M also described a test scenario involving mathematics, whereas there was no potential overlap in content between the mathematics bias items and the items in the general anxiety scale.
Unique Relations Between Mathematics Interpretation Bias and Anxiety
In addition to zero-order correlations between mathematics interpretation bias and mathematics anxiety, we were also interested in testing if there was a unique relation between these two factors after accounting for the variance in mathematics anxiety attributable to test and general anxiety, mental imagery abilities, and gender. The full set of predictors in our models explained at least 58% of the variance in mathematics anxiety. We found that both of our mathematics interpretation bias measures were uniquely related to mathematics anxiety even after removing the variance accounted for by the covariates. In other domains, interpretation biases have been previously found to significantly predict anxiety even after accounting for other predictors of anxiety, like anxiety sensitivity, gender, and other cognitive biases (Feng et al., 2022; Olthuis et al., 2012). Our study results similarly suggest that negative mathematics interpretation bias does uniquely relate to the mathematics anxiety levels of college students.
Importantly, there may be other factors not included in our current study that should be accounted for when testing the robustness of this unique relation. For example, working memory and basic mathematics skills have been found to be important predictors of mathematics anxiety (Ashcraft & Kirk, 2001; Douglas & LeFevre, 2018). Furthermore, the significant relation between negative mathematics interpretation bias and mathematics anxiety may be moderated by other factors, such as general or academic affect or social environmental characteristics (Gadassi Polack et al., 2023). As we have now established a strong link between mathematics interpretation bias and mathematics anxiety, it may be that students with high tendencies to be anxious in general situations may be more likely to consistently link together a threat bias response and anxiety response across different domains, compared to those with lower tendencies to be generally anxious. Future research should test the unique role of mathematics interpretation bias in mathematics anxiety against other important factors assumed to play a role in its development and consider the potential interaction roles of these predictors in the mathematics bias and anxiety relation.
Implications
Overall, our study findings can serve as the basis for future intervention work to modify negative interpretation bias in a mathematics context and test for subsequent reductions in mathematics anxiety. Many methods to date that are designed to reduce mathematics anxiety have focused on intervening on observable cognitive factors related to math anxiety or academic-related anxiety directly, such as improving mathematics skills or implementing a combined curricular-counseling intervention strategy (Ganley et al., 2021; Hendel & Davis, 1978; Supekar et al., 2015). However, these interventions may not adequately reduce fear or anxiety at the immediate source, which has been theorized to be the maladaptive information processing that occurs toward specific stimuli.
As mentioned earlier, cognitive bias modification interventions that target interpretation biases have been found to reduce negative interpretation bias and give way to more positive interpretation bias as well as decrease anxiety (MacLeod & Mathews, 2012). Therefore, to reach the goal of improving the effectiveness and longevity of mathematics anxiety intervention methods, efforts to target lower-level interpretation biases may be useful to pursue. Our study provides evidence of a robust link between negative mathematics interpretation bias and mathematics anxiety that future work can use as support to develop promising interventions that adequately targets critical cognitive bias issues theorized to lead to mathematics anxiety (Beck, 1976). Furthermore, our interpretation bias measures provide novel instruments that can be used by researchers or instructors to identify students who may benefit most from a cognitive bias intervention to reduce threatening interpretations of mathematics situations as well as mathematics anxiety.
Limitations
Several limitations should be considered regarding the current study findings. First, our findings should be interpreted as correlational only. The research design of this study was cross-sectional, and all data were collected concurrently. We are unable to determine the causal role of mathematics interpretation bias in mathematics anxiety from this study, but future research should use experimental designs to elucidate any causal relation between these factors. Second, our study sample is made up of college students who are mostly young adults. This makes our findings generalizable only to similar populations of students. These relations should be studied in non-student adults, children, and adolescents to understand the extent of the relation between mathematics interpretation bias and mathematics anxiety across development. Given the evidence of these relations in social contexts and more generalized contexts in children and adolescents (Miers et al., 2008; Subar et al., 2022), future research studies may be likely to find similar relations in a mathematics context in younger samples.
Our third main limitation is about the protocol and scores derived from our online measure of WSAP-formatted interpretation bias measures. Specifically, we presented the sentence prior to the word in both the WSAP-G and WSAP-M trials to give more time for participants to read the scenarios and provide a more online response of their perceived connection between the sentence and the word. However, this was switched around in the original administration of the WSAP-G due to the researcher’s concerns of priming effects of the sentence being presented prior to the word and subsequently impacting interpretations individuals have about ambiguous scenarios (Beard & Amir, 2009). Although our WSAP-M reliability estimates are above threshold and the correlations with math anxiety are as expected, the reliability for the WSAP-G bias score was poor which may be a result of the difference in presentation between the original WSAP and the one used in our current study. However, we did find that the reliability scores of the positive and threatening word pairs separately for the WSAP-G were adequate. Given this inconsistency, more research should be done to test different configurations of the word and sentence presentations in the interpretation bias for different contexts in future research.
Related to this limitation, there may be more informative data that can be gathered beyond Likert scale data in the WSAP-M. Versions of the WSAP also collect reaction time data as a more precise measure of online cognitive processing. Past research on attention biases in mathematics has found that students with higher levels of math anxiety tend to engage in more attentional avoidance, as indicated by lower reaction time, and thus answer mathematics problems more quickly (Pizzie & Kraemer, 2017). This may also be the case for interpretation bias. It would be useful for future research to collect and analyze reaction time data on measures of interpretation bias in a mathematics context to understand if students with higher levels of mathematics anxiety tend to have quicker reaction times to threatening interpretations of mathematics situations.
Last, we acknowledge that the item we used to assess gender (“What is your gender?”) does not align with the answer choices presented to participants, which are those that typically correspond with assessments of “sex” (biological terms of “Female” and “Male”). Our intention with assessing gender was to include a variable that denotes socially-expected norms associated with presenting ourselves as males or females (Hall, 2014), but the answer choices may have been confusing for some participants. Therefore, the gender analyses should be considered with this limitation in mind.
Conclusion
In our study, we investigated negative interpretation bias in a math context in a sample of college students, gender differences in this bias, and its association with mathematics anxiety. Our work provides two new measures of math interpretation bias that can be used in research measuring negative mathematics interpretation bias in the future. We found that male students had more adaptive interpretations of mathematics scenarios, that mathematics interpretation bias has a content specific relation with mathematics anxiety compared with test and general anxiety, and that mathematics interpretation bias has a significant and unique relation with mathematics anxiety that should be further studied. Overall, our work adds to the limited but increasing research on cognitive biases measured in a mathematics context (Li et al., 2023; Schmitz et al., 2019). Negative interpretation bias in a mathematics context should be examined in tandem with other mathematics-related cognitive biases to better contribute to our understanding of the cognitive models of anxiety dysfunction in mathematics contexts and similar interpretation accounts of math anxiety (Mathews & Mackintosh, 2000; Ramirez et al., 2018). Although more research is needed, our study indicates that negative interpretation bias is a promising cognitive process to study in a mathematics context as research continues to search for important factors that play a role in mathematics anxiety and achievement.
Supplemental Material
sj-docx-2-sgo-10.1177_21582440251361765 – Supplemental material for Investigating the Link Between Negative Interpretation Bias and Anxiety in a Mathematics Context
Supplemental material, sj-docx-2-sgo-10.1177_21582440251361765 for Investigating the Link Between Negative Interpretation Bias and Anxiety in a Mathematics Context by Connie Barroso, Colleen M. Ganley and Amy Casanova in SAGE Open
Supplemental Material
sj-xlsx-1-sgo-10.1177_21582440251361765 – Supplemental material for Investigating the Link Between Negative Interpretation Bias and Anxiety in a Mathematics Context
Supplemental material, sj-xlsx-1-sgo-10.1177_21582440251361765 for Investigating the Link Between Negative Interpretation Bias and Anxiety in a Mathematics Context by Connie Barroso, Colleen M. Ganley and Amy Casanova in SAGE Open
Footnotes
Appendix
Ambiguous Mathematics Scenarios Task (AMST).

| Items |
|---|
| 1. You review your notes from math class. As you read over them, you think about what you know. |
| 2. You walk into class and see the problems the instructor wrote on the board. You think about what you will be doing in math class that day. |
| 3. The instruction on the worksheet says to “Show your work.” After reading the first problem, you think about what you will need to write out to answer it. |
| 4. You look at the work your classmate wrote on the board when answering a math problem. Your work is different from theirs. |
| 5. In math class, your instructor tells you to work with a partner to do a math problem. You find a partner and begin to work together on the math problem. |
| 6. Your instructor hands you your math test back and the paper is facing down. You pick it up and turn the paper over. |
| 7. Your instructor is about to go over the math problems you just did. While you are waiting, you wonder if you got the answers right. |
| 8. Your instructor hands out the math test. As you start to take it, you think about how you will do. |
| 9. You show your classmate how you solved a math problem. They look at your work and you wonder what they are thinking. |
| 10. Your instructor is teaching about a new math concept. As you take notes, you realize you have questions about the concept. |
| 11. You look over the problems on your assigned math homework. You pick up your pencil to start the first problem. |
| 12. You are asked to explain why you got an answer on a math word problem in class. You look down at the answer you have before you say it out loud. |
| 13. Your instructor tells you the next math lesson builds on the last one. After they say this, they continue and start on the new lesson. |
| 14. You are taking a math course that all of your friends have already taken. You ask them about their experience and they start to tell you about the math course. |
| 15. You review your notes from math class. As you read over them, you think about what you know. |
Note. Instructions: “In this task, you are going to read through items that describe various scenarios. Try to imagine yourself in these scenarios and think about how you would feel. For the task, please rate how pleasant you think each scenario is, using a scale from 1 (extremely UNPLEASANT) TO 9 (extremely PLEASANT).”
Acknowledgements
We would like to thank the undergraduate research assistants who helped to collect data on the new measures that were integral to this project.
Ethical Considerations
This study received ethical approval from the Texas A&M University IRB (approval #IRB2021-0014M) on April 05, 2022. The IRB determined that this research involved minimal risk.
Consent to Participate
Participants received an information sheet and confirmed their participation and consent of the use of their responses prior to participating in the study.
Funding
The author(s) received no financial support for the research, authorship, and/or publication of this article.
Declaration of Conflicting Interests
The author(s) declared no potential conflicts of interest with respect to the research, authorship, and/or publication of this article.
Data Availability Statement
Data will be made available upon reasonable request.
Supplemental Material
Supplemental material for this article is available online.
References
Supplementary Material
Please find the following supplemental material available below.
For Open Access articles published under a Creative Commons License, all supplemental material carries the same license as the article it is associated with.
For non-Open Access articles published, all supplemental material carries a non-exclusive license, and permission requests for re-use of supplemental material or any part of supplemental material shall be sent directly to the copyright owner as specified in the copyright notice associated with the article.