
Abstract
In this study, Luxembourg, the Maldives, and Singapore, which have high water productivity, and Afghanistan, Madagascar, and Kyrgyzstan, which have low water productivity, were comparatively examined and analyzed. This study aimed to analyze long-run water productivity using the FMOLS, DOLS, and CCR models. While a 1% increase in freshwater resources per capita in Luxembourg increased water productivity by 0.14%, it decreased it by 0.90% in Singapore. These opposing effects may arise from differences in water management structures, water access patterns, policy priorities, and national infrastructure. On the other hand, while water productivity in Luxembourg reflects a more conscious policy choice, it can be stated that water productivity is largely implemented as a necessity in Singapore. In the models for the Maldives, Madagascar, and Kyrgyzstan, the water resources variable was not found to be statistically significant. Although the coefficient of this variable is statistically significant for Afghanistan, its value is quite low, and it does not show a significant effect on water productivity. The increase in water withdrawal reduces water productivity by 63.22%, 30.11%, and 1.33% in Luxembourg, the Maldives, and Singapore, respectively. In all country models, GDP per capita was statistically significant, but the coefficients were low. The direct effect of economic growth on water efficiency was limited.
Plain Language Summary
The results showed that a 1% increase in freshwater resources per capita in Luxembourg led to a 0.14% increase in water productivity. In other countries, water resources are not essential determinants of water productivity, whereas water withdrawal has a negative effect on productivity. The depletion of natural resources, rainfall, economic growth, and the impact of population on water productivity are observed at different levels in countries. It is extremely important to increase water productivity to ensure the sustainability of freshwater resources, which are necessary and limited for the survival of all living organisms. Although more than two-thirds of the world are covered with water, the amount of freshwater is only 2.5%, and only 0.03% is accessible. This shows that water resources are limited and must be protected, and that water must be used effectively and efficiently.
Keywords
Introduction
Water, which is the basic source of life and an indispensable part of existence, is of great importance in terms of the survival of living beings, the continuity of economic activities, and the security of energy supply. Factors such as industrialization, population growth, and climate change have increased water demand, leading to the depletion of water resources. This situation has increased the importance of limited daily water resources. Water is one of the key elements of the UN 2030 Agenda for Sustainable Development. Goal 6 aims to provide water and sanitation for all and to sustainably manage water resources.
The recognition of the right to water as a human right has developed over a long period, with many international initiatives. The United Nations World Water Conference, held in Mar del Plata, Argentina, in 1977, can be considered the first step. This conference was very important because it was the first major global meeting to emphasize that water is a basic and indispensable necessity for human life. The declaration published as a result of the conference stated that every individual should have the right to access sufficient and clean water and assigned responsibilities to states regarding the sustainable management of water resources (Gleick, 1998).
Another important stage of this process was the United Nations Committee on Economic, Social, and Cultural Rights’ (CESCR) declaration of access to water as a fundamental human right in 2002. It has been stated that water is not only a natural resource but also a vital component of human dignity and the right to life. Unfortunately, this statement is not legally binding. Access to clean and safe drinking water was officially declared as a fundamental human right by the United Nations General Assembly in 2010. Water rights were legally recognized globally in 2010 (CESCR, 2002; UN-Water, 2023).
The world’s water resources are decreasing and this decrease has been observed to be much faster in recent years (Figure A1). Groundwater levels, which are freshwater resources, decrease by an average of 1 m annually worldwide. However, approximately 80% of the world’s population are exposed to high-level threats to water security (Vörösmarty et al., 2010). According to World Bank data, water resources have decreased by up to 30% in some regions (UN-Water, 2021). According to the United Nations (UN), one-third of the world’s population is likely to experience water scarcity by 2050. The United Nations 2023 World Water Report emphasizes that 40% of the world’s population is at risk of water scarcity; this rate could increase to 50% by 2050, and more than 4 billion people will experience persistent water scarcity. This report draws attention to the fact that climate change, along with drought and water stress, poses a global security problem. In addition, the World Economic Forum states that drought is one of the top five global risk factors. Another striking statement states that urgent steps must be taken to protect and sustainably use water, which is vital to the common future of humanity, and that it must be protected through global cooperation.
According to data from the United Nations, approximately 40% of the world’s population may be at risk of water scarcity by 2050. In this context, water efficiency is critical for the efficient and sustainable use of water. Without increasing water efficiency, it is impossible to protect water resources and prevent future water crises (Global Commission on the Economics of Water Report, 2024).
The amount of water is also decreasing in countries with the highest water resources in the world (such as Brazil, Canada, and Russia). Although Brazil is one of the countries with the most freshwater resources in the world (approximately 27,015 m3 per person), water resources are rapidly depleting owing to the destruction of rainforests and the excessive use of groundwater. The Amazon River Basin contains approximately 12% of Brazil’s water reserves, but these reserves have decreased by 20% between 2010 and 2020. According to FAO and IPCC reports, it is predicted that Brazil’s water resources could decrease by up to 10% by 2050 due to climate change. A decrease in the amount of water, especially in the Amazon Basin, may have global impacts (FAO, 2018; UN-Water, 2020). In Canada, which accounts for 20% of the world’s freshwater reserves (approximately 74,529 m3 per capita), water resources have decreased by 30%, particularly in regions such as Alberta and British Columbia (FAO, 2018). This decrease was due to rising temperatures. According to the Canadian Meteorological Service, average temperatures in western Canada have increased by more than 1.7°C since 1950. Another reason is that Alberta is Canada’s largest oil sand producing region. Large amounts of water are used in the processing of the oil sand. In addition, agricultural irrigation activities increase water withdrawals, especially during the summer months, leading to decreases in ground and surface water.
Furthermore, major cities in Canada are projected to face water shortages by 2050. According to the Alberta Department of Agriculture and Forestry, water use in agriculture increased by approximately 20% between 2000 and 2020. Russia has one of the largest water resources in the world (approximately 29,790 m3 per capita), and most of its water resources are concentrated in Siberia. Notably, since the 1990s, the level of water resources in Russia has decreased by 15%. A study conducted in 2020 revealed that water pollution in Russia reached 45%, thereby reducing water availability. Globally, 70% of freshwater resources are used for agricultural irrigation, while water consumption increases by 1% to 2% per year. This situation, especially when combined with the fact that 60% of water resources are in the hands of 20 countries, is predicted to reach serious dimensions on a global scale, threatening life, social balance, and economic stability (UN-Water, 2021; FAO, 2021; Gleick, 2014). More than 2 billion people worldwide live in water stressed areas, and 780 million people do not have access to clean water (United Nations-Water, 2021). If even countries with abundant freshwater resources experience water problems and are expected to do so shortly, water resource depletion will become too important to ignore. On the other hand, concerns about water security are much greater in countries with relatively limited water resources (such as Sweden, Norway, Japan, and Finland). By contrast, countries with extremely limited or almost no freshwater resources (such as Kuwait, Bahrain, the United Arab Emirates, Qatar, the Maldives, and Singapore) are currently experiencing the most serious effects of the water crisis. According to World Bank data, global freshwater demand is expected to increase by 40% in the next 30 years. In this context, the concept of water efficiency is of critical importance not only in terms of protecting existing resources, but also in terms of using these resources in an economically, environmentally, and socially sustainable manner (UN World Water Development Report, 2023).
Although there are studies in the literature on the sustainable use and efficiency of water, the number of studies that directly focus on water efficiency and address its long-run economic and environmental effects in a holistic manner using empirical analyses is quite limited. In this study, instead of examining single country or nonhomogeneous country groups (such as the EU and OECD), the analyses were conducted by selecting the top three countries with the highest and lowest performance in terms of water efficiency. In this direction, water efficiency models for each country were estimated in the long-run, and intragroup and intergroup comparisons were made. While these objectives constitute the boundaries of this study, they also contribute to filling an important gap in the literature.
Because water and water resources are available in every area, they have a very wide field of study. Therefore, to address the subject in a more focused manner, the study areas should be limited to certain aspects. In this study, the focus was determined as the examination of freshwater productivity. In this context, it was aimed to investigate the answers to the following questions.
- What are the levels of freshwater resources in countries with high and low water productivity?
- Is water efficiency implemented out of necessity or as a conscious policy choice?
- Is there a relationship between water efficiency and water resources, water withdrawal, precipitation, the depletion of natural resources, economic growth and population? If so, what is the direction of the relationship?
- What are the key factors behind success in countries where water efficiency policies have been successfully implemented?
This study consists of seven sections. Following the entry section, water resources, importance, and distribution, the third section examines the countries involved in water efficiency and analysis, the methods used in the analysis in the fourth section, in the fifth section, forecast results, results, and evaluations in the sixth section, and suggestions and policy inferences in the seventh section.
Econometric Methodology
Fully modified ordinary least squares (FMOLS), dynamic ordinary least squares (DOLS), and canonical cointegrating regression (CCR) methods are used to estimate cointegration relationships in time series analysis. All three are designed to obtain long-run coefficients; however, they differ in terms of calculation techniques and assumptions.
Fully Modified Ordinary Least Squares (FMOLS) Method
To eliminate the problems caused by the long-run correlation between the cointegration equation and stochastic independent variables, Phillips and Hansen (1990) proposed an estimator that includes semiparametric correction. The FMOLS estimator is asymptotically unbiased and standard Wald tests using asymptotic chi-square statistical inference can be performed with completely effective normal asymptotics (Phillips & Hansen, 1990). Traditional cointegration methods are based on the condition that the series are stationary in difference. However, an important advantage of these methods is that they provide reliable results by increasing the interpretability of the obtained coefficients. FMOLS eliminates this problem by correcting the parameterization that causes an endogeneity problem with the kernel estimators. In addition, FMOLS uses the covariance matrix of the error terms to eliminate problems arising from the long-run correlations between the cointegration equations and stochastic processes.

Equation 1 shows the water productivity model estimated using the FMOLS method. The coefficients (β) in the model show the long-run relationship of each independent variable with water productivity.
The FMOLS estimator uses prior estimates of the symmetric and one-sided long-run covariance matrices of the residuals, and after the estimation, Equation 1 can be obtained. Equation 2 can be written from direct difference regressions (Phillips & Hansen, 1990).

Where Ω and Λ are the long-run covariance coefficients calculated using

and an estimated bias correction term

Where Ω and Λ are the long-run covariance coefficients calculated using

The FMOLS estimator is given by

FMOLS estimation is the construction of long-run covariance matrix estimators Ω and Λ. The FMOLS method ensures consistent estimation of coefficients in equations, eliminates autocorrelation in error terms, and corrects heteroscedasticity and finite sample bias (Phillips & Hansen, 1990).
Dynamic Ordinary Least Squares (DOLS) Method
Saikkonen (1992) and Stock and Watson (1993) developed the DOLS method, which creates an asymptotically effective estimator in the cointegration relationship. This method states that the error term in the cointegration model is completely independent of the random changes in the past of the independent variables (regressors), and has no linear relationship with them. Thus, an important step was taken to ensure the accuracy and consistency of the model (Stock & Watson, 1993).

Where:
α: Constant term and β: Long-run cointegration coefficient
p and q: Lag lengths
DOLS estimates Equation (5) using the differences in past period differences (lags)
If autocorrelation exists, classical OLS estimators will be biased, and reliable estimates will not be obtained. Stock and Watson developed the DOLS method by dynamically estimating the bias and endogeneity problems using the parametric method. Consistent and unbiased estimators of long-run coefficients were obtained using the DOLS estimator. Thus, deviations arising from problems, such as autocorrelation and heteroscedasticity in the estimators, are corrected (Priyankara, 2018).
Unlike FMOLS, the DOLS method allows the modeling of dynamic structures in a more comprehensive manner. DOLS provides more consistent results by using lagged and future period differences to correct for autocorrelation and heteroscedasticity of error terms in the model. DOLS provides consistent and reliable estimates, especially for nonstationary time series and cointegration relationships. The inclusion of lagged differences also reduces small sample biases (Stock & Watson, 1993).
Canonical Cointegrating Regression (CRR) Method
Park’s (1992) Canonical Cointegrating Regression (CCR) has developed a powerful method to eliminate the correlation between the error term and independent variables in cointegrating regressions. Unlike the FMOLS and DOLS methods, it makes the error term independent by retransforming the data, and thus guarantees the asymptotic normality of the least squares estimators.
As in FMOLS, the first step in CCR is to obtain the estimates of
The CCR estimator is defined as the ordinary least squares method applied to the transformed data.

Park (1992) showed that CCR transformations eliminate two basic problems: endogeny and asymptotic bias. In traditional cointegration regressions, there may be a long-run relationship between the independent variables (stochastic regressors) and error term. In other words, the independent variables may not be completely exogenous, but may be correlated with the error run. The CCR method eliminates this long-run correlation, ensuring that the independent variables behave as if they were truly independent.
In classical regression methods, if there is a simultaneous correlation between the independent variables and error term, the estimated coefficients are biased. CCR transformations eliminate this bias and increase the consistency and reliability of estimates.
The CCR method can convert data and estimate parameters not only in classical cointegration relationships but also under structural change conditions (Herzer & Nowak-Lehmann, 2006). In this respect, this method offers reliable predictions even in the presence of structural breakage. The FMOLS and DOLS methods with this feature provide a significant advantage.
In summary, FMOLS eliminates autocorrelation and finite sample bias by performing semiparametric corrections. DOLS includes short-run dynamics in the model by adding lagged and forward difference terms. CCR provides the most effective estimates by completely canceling the relationship between the error term and the independent variables.
Econometric Estimation Results
In this study, the factors affecting water productivity were estimated by selecting three countries with both high and low water productivity. It was aimed at conducting long-run analyses with Fully Modified Least Squares (FMOLS), Dynamic Least Squares (DOLS), and Canonical Cointegrating Regression (CCR) models.
Variables that may affect water productivity include water resources (annual renewable freshwater amount per person), water withdrawals (Annual amount of fresh water withdrawn for agricultural, industrial, and domestic uses), precipitation, depletion rate of natural resources (The ratio of economic loss resulting from the use of natural resources to GDP), economic growth, and population growth (Table A1).
Water productivity (constant 2015 US$ GDP) and renewable internal freshwater resources per capita (cubic meters) were obtained from the Food and Agriculture Organization (FAO-AQUASTAT) data. The other variables were compiled from the World Bank database. The models created for each country were estimated separately and presented under subheadings below.
Estimation Results of Long-Run Models for Luxembourg
Before moving on to long-run estimates, it was analyzed whether the series contained a unit root. In this context, ADF and PP tests were applied first, but when there was inconsistency between the results of both tests, the KPSS test was additionally used.
The H0 hypothesis, which suggests that the variables in the model do not have cointegration in the long-run, is rejected. Therefore, there is a long-run relationship between the variables, and they move together (Table 1).
Results From Unit Root Tests.

Note. ADF Dickey-Fuller test, PP Phillips-Perron test and KPSS Kwiatkowski-Phillips-Schmidt-Shin tests are shown. In ADF and PP tests, Null Hypothesis has a unit root, while in KPSS test, Null Hypothesis is stationary. The table shows the critical values; ADF − 3.97, − 3.42, − 3.13; PP − 3.97, − 3.41, − 3.13; KPSS 0.73, 0.46, 0.34.
The H0 hypothesis, which suggests that the variables in the model do not have cointegration in the long-run, is rejected. Therefore, it is seen that there is a long-run relationship between the variables, and they move together (Table 2).
Engle-Granger Cointegration Test.

Note. Null hypothesis: Series are not cointegrated.
MacKinnon (1996) p-values.
The Fully Modified Least Squares (FMOLS), Dynamic Least Squares (DOLS), and Canonical Cointegrating Regression (CCR) models yielded high and close results for R2. The sum of the squares of the error terms was lowest in the DOLS model. Table 3 presents the estimation results of the models.
Cointegration Test With FMOLS, DOLS, and CCR.

In the case where the R2 values of the three methods in the model are approximately at the same level and high, a comparison is made based on the sum of the error terms of the models (residual sum of squares). As a result of these comparisons, the fact that the DOLS model minimizes the error terms makes it stand out in terms of producing consistent and reliable results. Therefore, although they had similar explanatory powers, the DOLS model was preferred as the more appropriate empirical method.
According to the DOLS model, a 1% increase in freshwater resources per capita in Luxembourg increases water efficiency by 0.14%. The low impact rate can be explained by the limited water resources of Luxembourg, which ranks 153rd globally (1,562,343,766 m3). The positive impact of this relationship shows that this country attaches importance to water efficiency without waiting for water resources to decrease and adopts a long-run sustainable water management approach.
Luxembourg’s efficient policies implemented in water management ensure a more sustainable use of water, owing to its advanced infrastructure and innovative technologies. While its small population contributes to the efficient use of resources by limiting water demand, environmental awareness and sustainability investments also encourage the efficient use of water.
A 1% decrease in freshwater withdrawal in Luxembourg increased water efficiency by 63.22%. Although Luxembourg ranks second in water efficiency, a 63.22% increase in total water withdrawals indicates that there are still significant inefficiencies and risks to sustainability in water use, suggesting that a high-water efficiency rating does not mean that current water management practices are flawless, and that improvement efforts must continue to manage water resources more effectively.
Water efficiency in Luxembourg may depend more on environmental policies, innovative technologies, and sustainable water management practices than on economic growth. The combination of these factors can provide more efficient and sustainable use of water resources.
A 1% decrease in freshwater withdrawal in Luxembourg increased water efficiency by 63.21%. This increase can be directly related to the decrease in water withdrawal and is achieved through more careful use of water resources. Advanced water saving technologies, the effective use of recycled water, and water pricing policies have reduced freshwater withdrawal and encouraged more efficient use of water.
Water efficiency in Luxembourg may depend more on environmental policies, innovative technologies, and sustainable water management practices than economic growth. The combination of these factors can provide more efficient and sustainable use of water resources.
Estimated Results of Long-Run Models for the Maldives
When the first difference of the variables was taken, the H0 hypothesis, which states that there was a unit root, was rejected, and it was determined that the variables WP, FW, WD, DEP, GDP, and P were stationary in the first difference. The test results are presented in Table 4.
Results From Unit Root Tests.

The H0 hypothesis, which states that the variables in the model do not have cointegration in the long-run, is rejected. Therefore, Table 5 shows that there is a long-run relationship between the variables, which move together.
Engle-Granger Cointegration Test.

MacKinnon (1996) p-values.
The R2 value of the Canonical Cointegrating Regression (CCR) model was higher than those of the other models, and the DOLS model showed the lowest sum of squares of error terms. According to the DOLS model, the WD, DEP, and GDP variables were statistically significant. Although the Maldives ranks 226th in terms of freshwater resources per capita (5,812,218,834 m3), it ranks 3rd in water efficiency. Table 6 presents the estimation results of the models.
Cointegration Test With FMOLS, DOLS, and CCR.

A 1% increase in total water withdrawal in the Maldives led to a significant decrease in water efficiency of 30.11%. This high rate of water withdrawal indicates overuse of existing freshwater resources. Water withdrawal in the Maldives is mostly for domestic and tourism purposes, whereas agricultural water withdrawal is almost negligible. Because water resources are limited, the sustainable use of water and purification technologies is of vital importance. Therefore, this negative impact on water efficiency in the Maldives is an indicator of both the limited water supply and the management difficulties brought about by increasing demand. This situation reveals the need for more controlled policies on water withdrawal and the adoption of water saving technologies.
A 1% increase in natural resource depletion in the Maldives increased water efficiency by 44.37%. As natural resource depletion increases in the Maldives, water needs to be used more efficiently. The statistically significant effect of GDP on water efficiency in the Maldives, but the very low coefficient (3.2 × 10−07) indicates that economic growth does not have a significant effect on water efficiency.
Estimation Results of Long-Run Models for Singapore
When the first difference of the variables is taken, the H0 hypothesis, which states that there is a unit root, is rejected. The variables WP, FW, WD, PRE, DEP, GDP, and P were stationary in the first difference (Table 7).
Results From Unit Root Tests.

The H0 hypothesis, which states that the variables in the model do not have cointegration in the long-run, is rejected, and it is seen that there is a long-run relationship between the variables and they move together (Table 8).
Engle-Granger Cointegration Test.

MacKinnon (1996) p-values.
In the Fully Modified Least Squares (FMOLS), Dynamic Least Squares (DOLS), and Canonical Cointegrating Regression (CCR) models, R2 is high and close to each other. It is seen that the sum of squares of error terms is the lowest in the DOLS model. According to this model, the coefficient showing the effect of freshwater resources per capita in Singapore on water efficiency is not statistically significant and therefore cannot be commented on. Table 9 presents the estimation results of the models.
Cointegration Test With FMOLS, DOLS, and CCR.

Singapore, where a 1% increase in total water withdrawal decreases water efficiency by 1.33%, stands out for its low water withdrawal levels as a small island state with limited natural freshwater resources (218th in the world ranking). It is not surprising that water withdrawal is low in countries with limited water resources. Another reason for the low rate in Singapore is the decisive effect of water withdrawal policies on water efficiency. Singapore, whose total water withdrawal amount is quite low compared to the other two countries, uses its extremely limited freshwater resources largely for domestic and urban needs and industrial activities.
A 1% increase in the depletion of natural resources in Singapore increased water efficiency by 3.27%. As the depletion of natural resources in Singapore increases, more efficient water use is necessary. Solutions, such as water recycling, seawater desalination, and sustainable water management, have been introduced to increase water efficiency.
When comparing the three countries, the effects of the water withdrawal variable on water efficiency differ significantly in Luxembourg, the Maldives, and Singapore. Higher water withdrawal may be one of the reasons why Luxembourg (ranked 153) has more water resources than the Maldives (ranked 226) and Singapore (ranked 218). It should also be noted that water withdrawal and water efficiency differ among countries due to many factors, such as water management policies, legal regulations, infrastructure and technology level, economic sector structure, climate and geographical conditions, population density, public awareness, diversity of water resources, and economic capacity. In other countries, the water withdrawal coefficient was found to be statistically insignificant and therefore not interpreted.
A 1% increase in rainfall in Singapore increased water efficiency by 2.76%. This situation ensures that effective water management and conservation policies developed against water scarcity become more effective. In Singapore, GDP per capita affects water efficiency, but this effect is quite low as the coefficient is low (0.01). Economic growth has limited direct impact on water efficiency.
In Singapore, when population growth decreased by 1%, water efficiency increased by 7.93%. In Singapore, which has limited freshwater resources, even a small decrease in population significantly reduces total water demand, relieves pressure on available resources, and increases water efficiency. This requires more effective and efficient water use and management.
On the other hand, population growth may not always negatively affect water efficiency. In countries where the population is increasing and water management is being implemented effectively, the increasing need may trigger policy-based efficiency measures by creating the need to use water more efficiently. In this context, sustainable water policies and efficiency enhancing reforms may become a priority in these countries.
Considering the general increase in population on a global scale in today’s conditions, the analysis of this variable becomes even more critical. In a world where population growth is inevitable, it is extremely important to restructure water management systems to adapt to this demographic change and to transform them to adapt to sustainable water use.
Estimation Results of Long-Run Models for Afghanistan
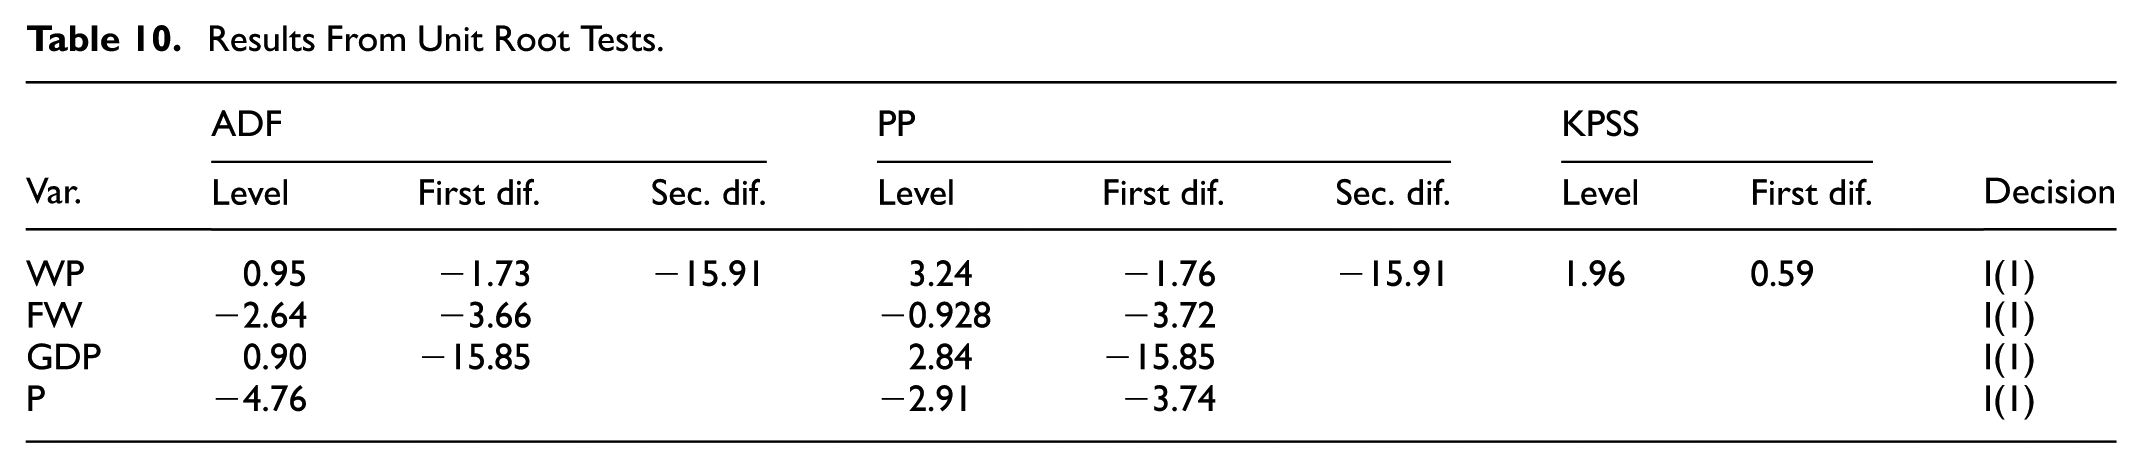
The H0 hypothesis, which states that it contains a unit root, is rejected. Therefore, it was determined that the variables WP, FW, GDP, and P were stationary in their first differences. The test results are presented in Table 10.
Results From Unit Root Tests.
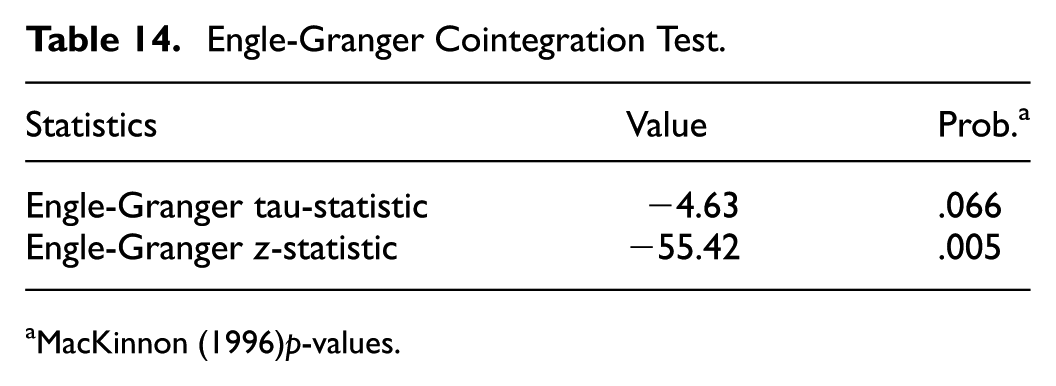
The H0 hypothesis, which suggests that the variables in the model do not have cointegration in the long-run, is rejected. Therefore, there is a long-run relationship between the variables, and they move together (Table 11).
Engle-Granger Cointegration Test.

MacKinnon (1996) p-values.
It was observed that the sum of the squares of the error terms was minimized in the DOLS model. In the long-run equation, the coefficients of all the variables are not statistically significant; therefore, it is not possible to comment (Table 12).
Cointegration Test With FMOLS, DOLS, and CCR.
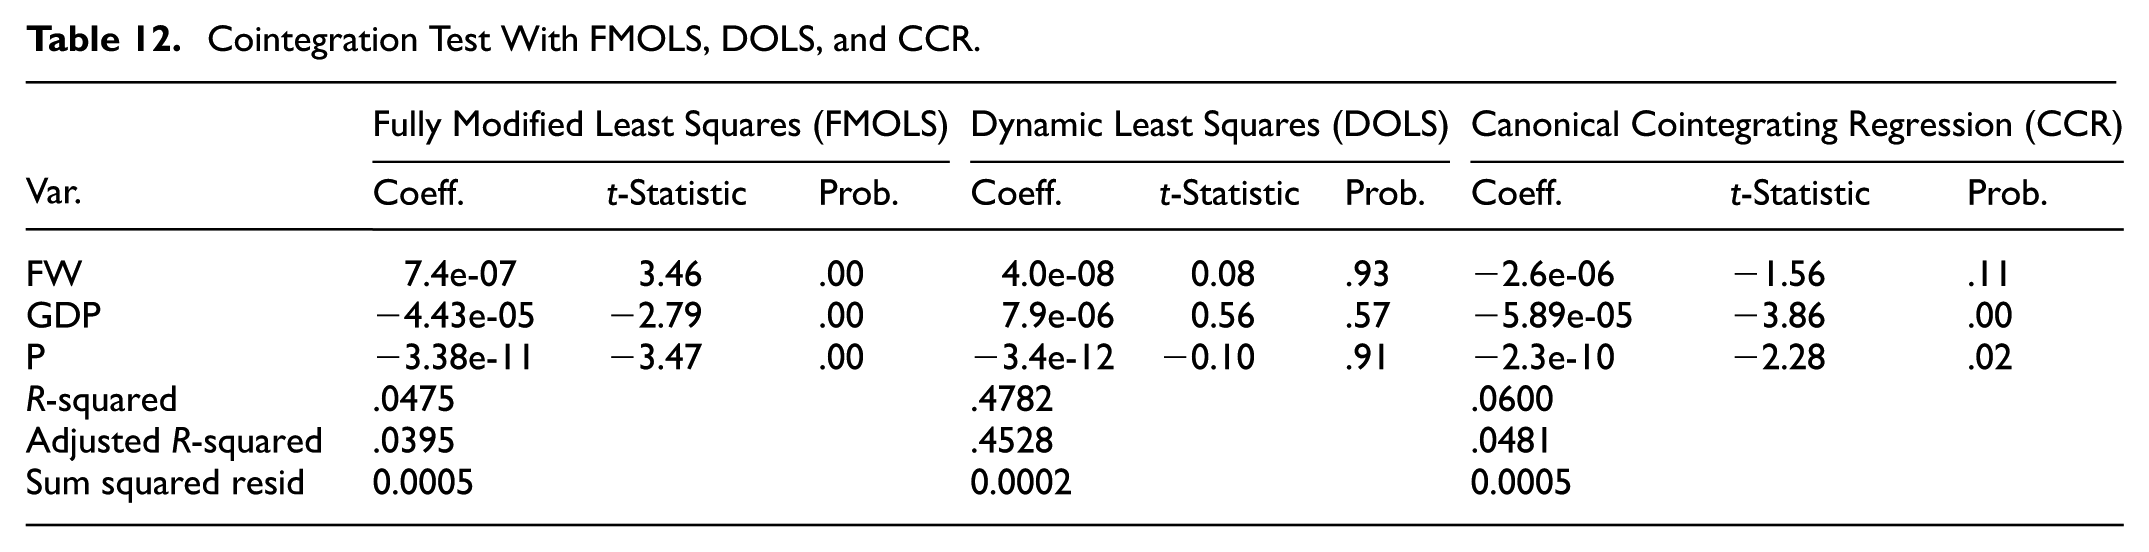
The R2 values of the models used in the study, except for the Afghanistan model, are approximately 0.99 in all models and tests for all countries. In the Afghanistan model, although the other tests were low, the R2 value obtained using the DOLS method was found to be 0.47. Afghanistan had the lowest performance in terms of water efficiency. In other words, Afghanistan has almost no water efficiency development and is ranked last in the world rankings. Therefore, it is unlikely that a country that has not achieved water efficiency can be explained, to a large extent, by explanatory variables.
In such a case, it would be methodologically misleading to expect a high level of explanatory power, as long as no efficiency behavior emerges, regardless of which independent variables are used. Therefore, it can be said that the low R2 value in the Afghanistan example is a contextual result, not of the model, but of the country’s weak water efficiency structure and insufficient independent variables (factors such as freshwater per capita ≈ 2,000 m3, water withdrawal 94%, and weak water infrastructure).
Estimation Results of the Long-Run Models for Madagascar
When the first difference of the variables is taken, the H0 hypothesis, which states that there is a unit root, is rejected, so it is seen that the variables WP, FW, WD, PRE, GDP, and P are stationary in the first difference (Table 13).
Results From Unit Root Tests.

The H0 hypothesis, which suggests that the variables in the model do not have cointegration in the long-run, is rejected. Therefore, a long-run relationship exists between the variables, and they tend to move together (Table 14).
Engle-Granger Cointegration Test.
MacKinnon (1996) p-values.
It is seen that the sum of squares of error terms is the lowest in the DOLS model. The coefficient of the FW variable is not statistically significant. Table 15 presents the estimation results of the models. According to the DOLS model, water productivity increased by 0.004% with a 1% decrease in freshwater withdrawal in Madagascar. However, the fact that the coefficient is quite low indicates that the change in water withdrawal has a limited effect on water productivity.
Cointegration Test With FMOLS, DOLS, and CCR.

Even if one of the independent variables in the model, which belongs to Madagascar, which ranks second to last in the world water efficiency ranking, is truly an effective factor, it is possible that this effect will appear to be limited as a coefficient. At a low productivity level, the regression coefficient is likely to be relatively small because the variable remains within a narrow range. This situation may be due to the low dependent variable, namely, water efficiency, rather than the inadequacy of the model.
On the other hand, the coefficient showing the effect of water withdrawal on water efficiency in the model belonging to Madagascar was estimated to be negative and 0.004. Madagascar, which has more water resources than other countries, is expected to have a very low effect on water withdrawal from its water resources.
In Madagascar, a 1% increase in precipitation increased the water productivity by 0.06%. Increased precipitation can increase the water supply by recharging groundwater and surface water resources for agriculture, industry, and drinking water. However, the low coefficient indicates that the effect of increasing precipitation on water productivity is limited.
In Madagascar, a 1% increase in GDP increased water productivity by 0.003%. Economic growth increases water productivity, but this effect is limited. Although the statistically significant population coefficient in Madagascar indicates that the population variable affects water productivity, the fact that the coefficient is close to zero reveals that this effect is extremely weak.
Estimation Results of Long-Run Models for Kyrgyzstan
When the first difference of the variables was taken, the H0 hypothesis, which stated that there was a unit root, was rejected; thus, it was determined that the WP, FW, WD, PRE, GDP, and P variables were stationary in the first difference (Table 16).
Results From Unit Root Tests.

The H0 hypothesis, which suggests that the variables in the model do not have cointegration in the long-run, is rejected. Therefore, there is a long-run relationship between the variables, which move together (Table 17).
Engle-Granger Cointegration Test.

MacKinnon (1996) p-values.
The sum of the squares of the error terms was lowest in the DOLS model. The coefficients of FW, WD, and P was not statistically significant. According to the DOLS model, while the amount of precipitation has a negative effect on water productivity, economic growth has a positive effect; however, the effect of both variables on water productivity is quite weak (0.001) (Table 18).
Cointegration Test With FMOLS, DOLS, and CCR.

The negative impact of precipitation on Kyrgyzstan’s water efficiency may seem surprising at first glance. It is generally expected that increased precipitation will enrich water resources and, thus, increase water efficiency. However, this situation may have adverse effects, depending on the country’s structural, institutional, and water management. Especially in conditions where there is insufficient infrastructure to collect, store, and distribute rainwater, increased precipitation causes water to flow away rather than contributing to water efficiency. This shows that for precipitation to become efficient, not only natural conditions but also an effective water management system are required. On the other hand, in regions where water is relatively abundant, there is less need for efficiency policies, which delays the adoption of efficiency-oriented reforms and technologies.
The statistical insignificance of some coefficients obtained in countries such as Afghanistan and Kyrgyzstan may be due to the internal dynamics of the countries rather than the modeling specification. Management problems, institutional and infrastructural deficiencies, and political instability in these countries prevent the effective implementation of water policies, which negatively affects the increase in water efficiency. On the other hand, limitations in data quality and comprehensiveness reduce the power of econometric analyses and may reduce the explanatory power of the model. This situation may cause models to fail to fully reflect the relationships that exist in real life. Therefore, the low significance levels in these countries can be considered a reflection of both the empirical limitations and structural realities.
As the institutional capacity and financial resources of each country differ, it is not possible to implement the same water efficiency policies in all countries. Especially in countries such as Afghanistan and Kyrgyzstan, low-cost solutions (such as simple rainwater collection systems made with local materials, improvement of traditional irrigation techniques, community level education, and awareness raising activities) can be seen as more applicable strategies than high-cost advanced irrigation technologies.
As there is more than one country, variable, and method in the analysis, the estimation results are summarized below for a clearer view of the results.
■ Luxembourg ranks 153rd globally in terms of freshwater resources per capita (1,562.34 m3). It ranks 2nd in terms of water efficiency.
■ A 1% increase in freshwater resources per capita in Luxembourg increased the water efficiency by 0.14%.
■ A 1% decrease in freshwater withdrawal in Luxembourg increased water efficiency by 63.21%.
■ Although GDP has a positive effect on water efficiency in Luxembourg, the rate of this effect is quite low.
■ The results show that the most important factor affecting water efficiency in Luxembourg is the decrease in water withdrawal.
■ Maldives rank 226th in the world in terms of freshwater resources per capita with 58.12 m3 and 3rd in terms of water productivity.
■ A 1% decrease in freshwater withdrawal in the Maldives increased water productivity by 30.11%.
■ A 1% increase in the depletion of natural resources in the Maldives increased water productivity by 44.37%.
■ The effect of GDP on water productivity in the Maldives was very low, almost zero.
■ As a result, it is seen that the factors that most affect water productivity in the Maldives are the decrease in water withdrawal and depletion of natural resources.
■ Singapore ranks 218th in the world in terms of freshwater resources per capita, with 1100198 m3 and 4th in terms of water productivity.
■ The coefficient of the water resource variable was not statistically significant.
■ A 1% decrease in freshwater withdrawal in Singapore increased water efficiency by 1.33%.
■ A 1% increase in the depletion of natural resources in Singapore increased water efficiency by 3.27%.
■ A 1% increase in precipitation in Singapore increased water efficiency by 2.76%.
■ The relationship between water efficiency and GDP per capita in Singapore was significant, but the coefficient was quite low.
■ A 1% decrease in population growth in Singapore increased water efficiency by 7.93%.
■ As a result, the factors that most affect water efficiency in Singapore are water withdrawal, depletion of natural resources, precipitation, and population variables.
■ Afghanistan ranks 165th in the world with 1,178.74 m3 of freshwater resources per capita, and is the last in terms of water productivity.
■ The coefficients of all the variables in the long-run equation were not statistically significant.
■ Madagascar ranks 50th in the world with 1,135,020.91 m3 of freshwater resources per capita and is second to last in terms of water productivity.
■ It is observed that the coefficient of the water resources variable is not statistically significant.
■ A 1% decrease in freshwater withdrawal in Madagascar increased the water productivity by 0.004%.
■ A 1% increase in precipitation in Madagascar increased the water productivity by 0.06%.
■ A 1% increase in GDP in Madagascar increased water productivity by 0.003%.
■ The population coefficient in Madagascar is close to zero, and this effect is extremely weak.
■ As a result, it can be seen that the factors that affect water productivity the most in Madagascar are water withdrawal, precipitation, and economic growth variables, but the effect is limited.
■ Kyrgyzstan ranks 72nd in the world in terms of freshwater resources per capita and has 7,141.79 m3 of water; however, it is third from the bottom in terms of water productivity.
■ The coefficients of the water resources, water withdrawal, and population variables were not statistically significant.
■ Precipitation has a negative effect on water productivity in Kyrgyzstan, while economic growth has a positive effect on water productivity, but these effects are quite weak.
When all of these summaries are evaluated in general terms,
■ Water withdrawal has a negative effect on water efficiency in all countries except Kyrgyzstan and Afghanistan, which is highest in Luxembourg (63.21%) and the Maldives (30.11%). It is noteworthy that this effect was low in Singapore (1.33%) and very low in Madagascar (0.004%).
■ Although Afghanistan has freshwater resources compared to the Maldives and Singapore, it is in the 226th or last place in terms of water efficiency.
■ Despite having a higher level of freshwater resources per capita than all the countries examined in this study, Madagascar is in the second to last place in terms of water efficiency.
■ Although Kyrgyzstan is in the 72nd place, it is in the third to last place in terms of water efficiency.
To more clearly see the positions of the countries in the world rankings in terms of water resources and efficiency, Table A2 was created. This ranking includes 226 countries. The first column includes three countries with high water efficiency and the fourth column includes three countries with low water efficiency.
In addition to the study objectives, the answers to the research questions stated in the Introduction section are answered in detail in the relevant sections of the study. In this section, answers to the questions are presented collectively and in a summary form.
What are the Levels of Freshwater Resources in Countries With High and Low Water Productivity?
The countries that are at the top of the world rankings in terms of water efficiency are Luxembourg, Maldives, and Singapore, while Kyrgyzstan, Madagascar, and Afghanistan are at the bottom of my rankings. The rankings in terms of water resources were Madagascar, Kyrgyzstan, Luxembourg, Afghanistan, Singapore, and the Maldives (Table A2). These countries strikingly demonstrate that there is not always a direct relationship between water efficiency and the abundance of water resources.
Is Water Efficiency Implemented Out of Necessity or As a Conscious Policy Choice?
In Luxembourg, a 1% increase in freshwater resources per capita increased water efficiency by 0.14%. In Luxembourg, where water resources are limited, even a small increase in the freshwater supply per capita has a positive effect on efficiency when combined with current policies to use water more efficiently and productively. This also shows that water resources are used in a careful and planned manner in the country. In Luxembourg, water is viewed as a conscious and planned policy choice rather than a necessity. In Singapore, a 1% increase in freshwater resources per capita reduced water efficiency by 0.90%. Singapore is currently using water more out of necessity than preferred for efficient use. The sign of the coefficient indicates that even when water resources are reduced by a small amount, there may be a slackening in water efficiency. This may lead to a decrease in efficiency in the short-run. In other words, more resources may result in less careful use.
Is There a Relationship Between Water Efficiency and Water Resources, Water Withdrawal, Precipitation, the Depletion of Natural Resources, Economic Growth and Population? If So, What is the Direction of the Relationship?
According to the findings; In Luxembourg, FW (+), WD (−), In Maldives, GDP (+); WD (−), DEP (+), GDP (+); In Singapore, FW (−), WD (−), DEP (−), PRE (−), GDP(+), P (−); In Madagascar, WD (−), PRE (+), GDP (+), P (+); In Kyrgyzstan, PRE (−), GDP (+) has an effect.
What are the Key Factors Behind Success in Countries Where Water Efficiency Policies Have Been Successfully Implemented?
Despite their limited natural resources, Luxembourg, the Maldives, and Singapore have achieved remarkable success in water efficiency owing to strong infrastructure, effective water management policies, and high public awareness.
Conclusions and Evaluations
Worldwide, 2.2 billion people lack access to safe drinking water, and this problem is particularly pronounced among those living in rural areas. Moreover, four out of five people lack basic drinking water services. In addition, according to the Water Conference held in 2008, two out of every three people will face the problem of thirst by 2025.
Smart and innovative solutions in water management can prevent water waste using digital sensors and artificial intelligence supported analysis. The reuse of water in agriculture and industry through recycling and reuse is extremely important for ensuring sustainable water management. In this context, efficient water use not only ensures the protection of water resources but also ensures the long-run water security of societies.
In Luxembourg, a 1% decrease in freshwater withdrawal increased water efficiency by 63.21%. Advanced water technologies and water pricing policies have reduced total freshwater withdrawals and increased water efficiency. When examining water efficiency for Luxembourg, the most important factor is the decrease in water withdrawal. This decrease in water withdrawal ensured that the water resources were used more efficiently. This enabled Luxembourg to use its water resources more efficiently and sustainably.
In all country models, although the coefficients of the GDP variable are estimated to be statistically significant, the fact that the coefficient size is quite low indicates that the effect of economic growth on water efficiency is limited. This situation shows that economic growth will not directly increase water efficiency; however, it can contribute through indirect effects (e.g., capacity to invest in water infrastructure with higher budgets, technological improvements, and institutional development). Therefore, an increase in GDP alone does not guarantee water efficiency; it reveals how economic growth is managed, to what extent it is integrated with water management policies, and that economic growth should be considered together with environmental policies.
Maldives supply water via rainwater harvesting, desalination, and groundwater. A 1% increase in natural resource depletion in the Maldives increased water efficiency by 44.37%. The depletion of natural resources increases water efficiency by encouraging the adoption of water saving measures, the development of innovative water management solutions, and the spread of sustainable water use policies. The factors that most affect water efficiency in the Maldives is the decrease in water withdrawal and depletion of natural resources. While a reduction in water withdrawal can lead to more efficient use of existing resources, the depletion of natural resources necessitates more careful management of water.
A 1% reduction in freshwater withdrawal increased water efficiency in Singapore by 1.33%. Singapore is implementing innovative solutions, such as recycling systems (NEWater), desalination plants, and efficient water management policies for water supply. Reducing freshwater withdrawal increases water efficiency by enabling the more efficient use of these systems.
A 1% increase in natural resource depletion in Singapore increased water efficiency by 3.27%. The scarcity of resources encourages individuals and businesses to consume and conserve water consciously.
In Singapore, a 1% increase in rainfall increased water efficiency by 2.76%. This situation ensures that effective water management and conservation policies developed against water scarcity become more effective. Measures such as water recycling, desalination and conscious water use contribute to more efficient use of resources by increasing water efficiency.
A 1% decrease in population in Singapore provides a 7.93% increase in water efficiency; population reduction is important for reducing water demand and using water resources more efficiently. While high population density and increasing demand put pressure on water infrastructure, a decrease in population alleviates this pressure and allows for more efficient use of water.
As a result, it is seen that the factors that most affect water efficiency in Singapore are decrease in water withdrawal, depletion of natural resources, rainfall and population variables. These factors play an important role in determining strategies for more efficient use of water. In the long-run equation estimated with data from Afghanistan, which ranks last in terms of water efficiency, it is seen that the coefficients of all variables are not statistically significant. According to the DOLS model, a 1% decrease in freshwater withdrawal in Madagascar leads to a 0.004% increase in water productivity. However, the coefficient was quite low, indicating that the change in water withdrawal had a limited effect on water productivity.
A 1% increase in precipitation increased water productivity in Madagascar by 0.06%. Precipitation provides water by feeding groundwater and surface water resources to agriculture, industry, and drinking water. However, a low coefficient indicates that the effect of increased precipitation on water productivity is limited. Although the population coefficient is statistically significant in Madagascar and the population variable affects water productivity, the fact that the coefficient is close to zero indicates that this effect is extremely weak. As a result, it is seen that the factors that most affect water productivity in Madagascar are the decrease in water withdrawal and amount of precipitation.
Kyrgyzstan ranks 72nd in the world in terms of freshwater resources per capita of 7,141.79 m3; however, it ranks third from the bottom in terms of water productivity. While rainfall had a negative effect on water productivity, economic growth had a positive but relatively small effect on water productivity.
Despite having many more water resources than all other countries examined in this study, Madagascar is ranked second to last in terms of water efficiency. Afghanistan, which has an advantage over the Maldives and Singapore in terms of freshwater resources, has the highest water efficiency. Kyrgyzstan, on the other hand, ranks third to last in terms of water efficiency, with 72nd place in terms of water resources. These rankings and ratios indicate that having more water resources does not necessarily result in higher productivity. Factors such as water management, infrastructure investments, and technological developments are more important in having a decisive effect on productivity. However, since each country has its own conditions and policies, different factors have different effects on water efficiency. This situation emphasizes the importance of strategies that determine each country’s specific needs and priorities in terms of water efficiency.
Recommendations and Policy Implications
The distribution of water resources shows regional differences; while water resources are relatively abundant in some regions, they are quite limited in other regions. However, these resources are decreasing even in countries with abundant water resources. This situation necessitates the development of policies to increase water efficiency.
In this context, when developing policies on water efficiency, it should be taken into account that the needs of countries with high and low water efficiency are different. Countries with high water efficiency differ from each other due to their different characteristics. This situation requires each country to develop different water management strategies and policies specific to itself.
Luxembourg can increase its water efficiency by making rainwater storage systems mandatory in newly constructed buildings, ensuring the efficient use of water in various areas such as irrigation and cleaning. Although the Maldives have initiated various strategies and projects to increase water efficiency, certain steps may need to be taken to achieve higher efficiency.
The Maldives can review its policies for protecting local water resources and inform local people about this issue within the framework of the “National Water Resources Management Plan” launched in 2016. In addition, modern irrigation techniques for efficient water use can be expanded, particularly in agriculture. To promote water efficiency, local farmers can be provided with solutions to improve water management in agriculture and training. The Maldives can also develop regulations to promote water saving infrastructure in hotels and resort to ensure water efficiency in the tourism sector. It can make water use in the sector more sustainable by offering special incentives for projects such as “Eco Friendly Water Management.” The Maldives can invest in technological innovations for water efficiency, focusing on projects such as the expansion of seawater desalination technologies and solar powered water treatment systems. Such projects can significantly increase the water efficiency of the Maldives.
Although Singapore has a high-water efficiency, it may face future water security problems owing to its limited freshwater resources. To increase water efficiency and ensure water security sustainably, Singapore can further increase its seawater desalination capacity. This can increase the number of NEWater facilities that use advanced wastewater treatment technology to treat wastewater for drinking water quality. However, because this process requires a large amount of energy, this situation should be considered when determining a policy. Since there is no nuclear power plant in Singapore, meeting the energy needs of fossil fuels can negatively affect the environment by causing carbon emissions. Therefore, the use of cleaner and more sustainable energy sources should be considered for water treatment processes.
Although Singapore is a successful country in terms of water efficiency, it may face future problems in water safety due to limited freshwater resources. To increase water efficiency and ensure water safety and sustainability, Singapore can further increase its seawater treatment capacity. Using advanced wastewater treatment technologies, the number of water plants that improve drinking water quality can be increased. However, because this process requires a large amount of energy, this situation should be considered when determining the policy. As there is no nuclear power plant in Singapore, it can adversely affect the environment by causing carbon emissions to meet the energy needs of fossil fuels. Therefore, the use of cleaner and more sustainable energy resources in water treatment processes should be considered.
In addition, it can effectively evaluate this resource in urban areas by expanding rainwater collection systems. To achieve water efficiency, Singapore can further increase water efficiency by promoting water saving techniques in agriculture, such as drip irrigation systems and water efficient farming methods. With these strategies, Singapore can be prepared against future water problems by further increasing water efficiency.
Countries that provide water productivity are an important example of countries with water scarcity, as well as providing water efficiency within their boundaries. Countries that provide water efficiency can guide other countries to meet water needs by sharing water treatment, recycling, and smart water management systems through knowledge and technology transfers. They can promote more effective water management at the individual and institutional levels by spreading awareness about sustainable water use through education and awareness programs. In this way, they not only contribute to global water security but also guide the shaping of global policies by strengthening cooperation in water management. In addition, collaboration with local governments and international organizations can be established for water efficiency, and experience sharing and technical support can be provided. To increase water efficiency, Afghanistan can use more efficient systems, such as drip irrigation, instead of traditional irrigation methods and modernize the existing irrigation infrastructure. However, water management and efficiency can be achieved by cooperating with specialized organizations with experience and technical assistance. Because drinking water supply is also a major problem, the establishment of water treatment systems can provide access to clean water. Strengthening the legal framework and establishing an effective water management policy are important steps for increasing water efficiency in Afghanistan.
Kyrgyzstan, despite being rich in water resources, has problems with water efficiency; it needs to focus on improving the effective use and sustainable management of existing water resources. Irregular distribution of water in Kyrgyzstan and inadequate water infrastructure are factors that adversely affect water efficiency.
The old and inefficient water infrastructure in Kyrgyzstan has also led to water loss. To solve this problem, the modernization of water distribution systems and the renewal of existing water networks are of great importance. Water management systems that enable the monitoring of data on efficient water use and intervention, when necessary, are necessary. In Kyrgyzstan, irrigation efficiency is low because the agricultural sector accounts for the largest share of water consumption. Therefore, more efficient techniques, particularly drip irrigation systems, should be implemented instead of traditional irrigation methods. However, recycling and purification of water used in the industrial and agricultural sectors in Kyrgyzstan is another important step towards increasing water efficiency. Reusing wastewater and water saves water and contributes to sustainable management of existing water resources.
No policy alone can achieve more than one target, such as productivity, equality, and environmental sustainability. Therefore, policy packages must maintain a balance among these objectives. Complementary policies are needed in the reform process to resolve structural problems in the relevant sectors. For example, subsidies provided to water intensive industries may weaken the effect of water prices on demand regulations.
Therefore, water management policies should include long-run sustainable strategies rather than short-run solutions. A comprehensive approach should be adopted for the protection, efficient use and equitable distribution of water resources. In addition, it is important to participate in stakeholder participation, encourage technological innovations and strengthen financial support mechanisms to be successful in policy reforms.
Measures such as water saving infrastructure investments, water recycling projects and incentive systems that optimize water use play a critical role in increasing water efficiency. In this process, it should not be forgotten that sectorial transformations are inevitable and supportive policies are developed to adapt to new regulations of main water users such as agriculture, industry and households.
It should not be forgotten that access to safe drinking water is a basic and universal human right. This right is critical not only for individuals to live a healthy life, but also for the implementation of all other human rights such as education, health and economic development. In this context, increasing water efficiency is not only about protecting existing water resources, but also ensuring that everyone has access to this basic right. Effective water management supports social wellbeing by contributing to a more equitable distribution of water through waste prevention and sustainable use strategies. Therefore, efficient use of water resources is an inevitable responsibility for environmental sustainability and the protection of human rights.
Footnotes
Appendix A
World Ranking of Water Resources and Productivity.
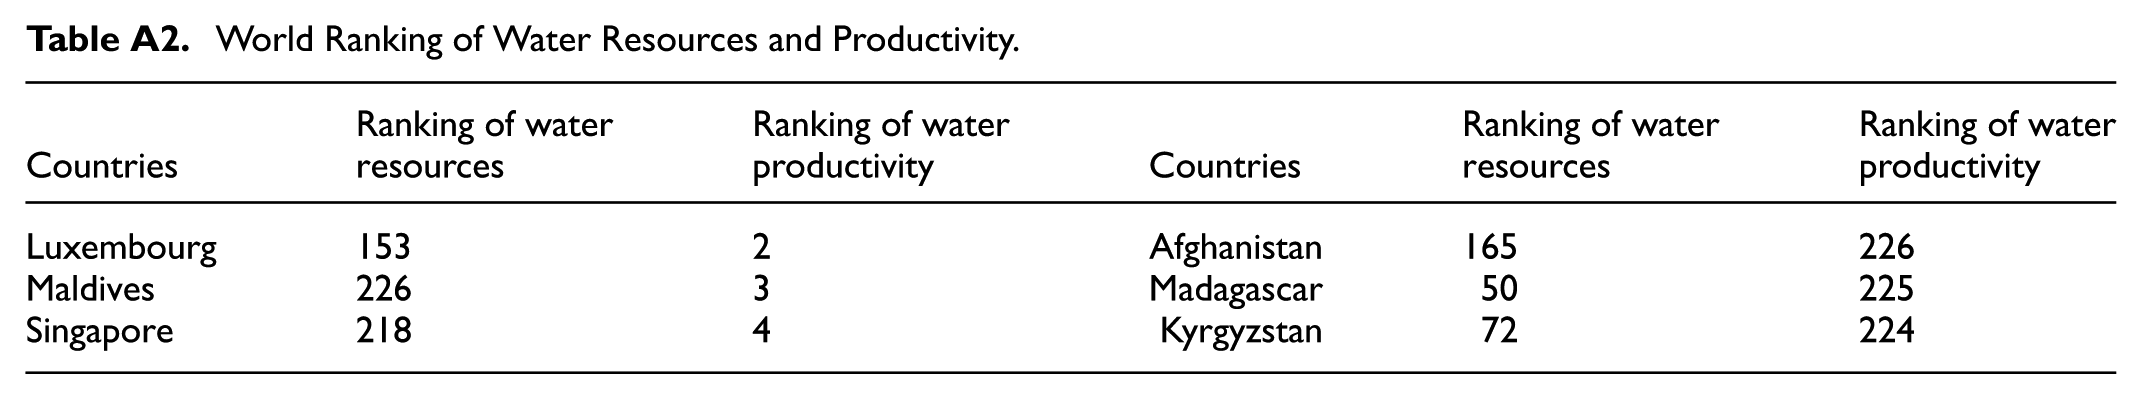
| Countries | Ranking of water resources | Ranking of water productivity | Countries | Ranking of water resources | Ranking of water productivity |
|---|---|---|---|---|---|
| Luxembourg | 153 | 2 | Afghanistan | 165 | 226 |
| Maldives | 226 | 3 | Madagascar | 50 | 225 |
| Singapore | 218 | 4 | Kyrgyzstan | 72 | 224 |
Consent for Publication
Authors give their permission to publish.
Author Contributions
Sabiha Oltulular: Conceptualization, Methodology, Software, Writing—Original draft preparation, Resources, Data curation, Supervision, Writing—Reviewing and Editing.
Funding
The authors disclosed receipt of the following financial support for the research, authorship, and/or publication of this article: This study has been supported by the Recep Tayyip Erdoğan University Development Foundation (Grant number: 02025007023650).
Declaration of Conflicting Interests
The author declared no potential conflicts of interest with respect to the research, authorship, and/or publication of this article.
Data Availability Statement
Data available on request from the authors.