
Abstract
This paper presents the Environmental Policy Performance Index (EPPI), a two-dimensional composite index designed to evaluate the effectiveness of environmental policy in a comprehensive and balanced way. The EPPI integrates both policy inputs – such as government expenditures on environmental protection and pollution-related taxes – and policy outputs, measured through indicators of environmental quality. By combining these dimensions, the index enables a more nuanced understanding of how well public policy efforts are translated into tangible environmental outputs. Applied to 23 European countries over a multi-year period, the EPPI addresses key limitations of existing one-dimensional indices, which often assess either policy efforts or results in isolation. Our findings reveal that while some countries demonstrate strong alignment between policy intensity and environmental performance, others invest substantial resources without achieving commensurate improvements – suggesting the presence of inefficiencies, behavioural inertia, or structural constraints. To ensure comparability, both EPPI subindices are constructed using consistent data sources and timeframes. Importantly, we do not claim a causal relationship between inputs and outputs; rather, the EPPI is intended to support descriptive and comparative assessment. Countries are grouped into four performance profiles based on their input-output balance, providing actionable insights for policymakers. By offering a replicable and transparent methodology, the EPPI represents a methodological advancement with broader applicability beyond Europe. It contributes to the growing need for reliable and multidimensional tools that can inform environmental governance, track progress toward sustainability goals, and enhance international policy learning.
Plain language summary
This study introduces a new tool called the Environmental Policy Performance Index (EPPI) to measure how well environmental policies are working in 23 European countries. Unlike traditional methods that focus only on the outcomes of environmental policies, the EPPI looks at both policy inputs (like government spending and environmental taxes) and outputs (like reduced pollution and increased recycling). This two-part index helps us understand whether countries are getting good results for their efforts. Our findings show that some countries are achieving strong environmental outcomes with fewer resources, while others invest heavily but see limited progress due to challenges like outdated technology or ineffective strategies. By comparing these efforts and results, the EPPI highlights which countries are leading in environmental governance and which ones need to improve. This tool provides valuable insights for policymakers, helping them identify what works and how resources can be used more efficiently to achieve environmental goals. While this study focuses on Europe, the EPPI can be adapted to other regions worldwide to support sustainable development and tackle environmental challenges.
Keywords
Introduction
Europe’s vision for sustainable development aligns closely with the United Nations’ 2030 Agenda for Sustainable Development, which emphasizes a global commitment to combating poverty, inequality, and climate change (European Commission, 2016; United Nations, 2015). Achieving these ambitious goals requires good governance, a critical element for ensuring the balance between environmental, social, and economic dimensions of sustainability (Pimonenko et al., 2018).
In this context, well-informed decision-making is essential, as it relies on accurate and reliable data. A large body of research shows that high-quality information is essential for sound policy decisions (e.g. Cantarelli et al., 2023; Chengalur-Smith et al., 1999; Konisky and Woods, 2012; Norwood, 1990; Raghunathan, 1999; Stewart et al., 2022). Without precise and actionable metrics to evaluate policy performance, decision-making may be insufficiently informed or misguided.
Composite indices are an efficient way to assess policy performance, offering quick insights into complex, multidimensional issues while enabling comparisons across various entities. However, despite their utility, composite indices also carry several methodological limitations related to the selection of variables, data availability, and aggregation methods (OECD/European Union/EC-JRC, 2008). For instance, data must be available over long time periods and across many countries, while adhering to internationally agreed statistical definitions to ensure valid cross-country comparisons (Schmidt-Traub et al., 2017). These limitations can constrain the development of reliable indices.
Most well-known indices used to assess policy performance are output-based, quantifying the environmental challenges that policies aim to address (such as emissions) rather than policies’ stringency or efforts themselves (Sauter, 2014). Examples include the SDG Index, the Environmental Performance Index (EPI), and the Environmental Transition Performance Index. In contrast, the OECD’s Environmental Policy Stringency (EPS) Index measures policy inputs, such as government actions and regulatory measures, representing a significant contribution to input-based policy evaluation (Botta and Koźluk, 2014; Kruse et al., 2022). However, focusing on either inputs or outputs alone paints only a partial picture, making it difficult to assess whether policies are cost-effective or if some countries achieve better results with fewer resources.
Although many high-quality environmental indicators exist, they are often analysed in isolation or combined into indices that reflect only one aspect of policy performance. Most commonly, they capture either the policy side – such as regulatory stringency or public environmental expenditure – or the environmental condition side, including measures like air or water quality and emissions levels. This separation makes it difficult to evaluate whether substantial investments are accompanied by measurable improvements, or whether some countries can achieve significant improvements with limited resources.
The Environmental Policy Performance Index (EPPI) was developed to address this limitation. It integrates existing, internationally comparable indicators into a two-dimensional framework that captures both efforts and results. Rather than aiming to establish causality, the EPPI provides a diagnostic and comparative perspective on how environmental policy performance varies across countries. This structure is intended to support policy learning and benchmarking by highlighting patterns of alignment – or misalignment – between what governments do and what they achieve. The EPPI is built entirely on existing and internationally harmonized data, which makes it practical, scalable, and transparent. These features enhance both its analytical robustness and its relevance for policy dialogue.
Building on this rationale, the Environmental Policy Performance Index (EPPI) is structured as a composite measure comprising two sub-indices: EPPIin, which captures policy efforts through indicators such as government expenditures and taxes, and EPPIout, which reflects outputs based on environmental quality metrics. This structure allows for a comparative analysis of how well different countries align their environmental inputs with achieved results.
Importantly, this study applies the same countries, time periods, and methodologies to both EPPIin and EPPIout, ensuring that any discrepancies between policy efforts and environmental outputs are not attributable to differences in the data sources, periods analysed, or methodological inconsistencies. However, we do not claim a direct causal relationship between inputs and outputs. For example, we do not suggest that higher pollution taxes automatically lead to reduced emissions or that increased organic farming is directly caused by specific policy inputs. The two indices provide complementary perspectives on environmental policy performance, but the complexity of environmental systems, as well as technological and behavioural factors, means that multiple variables influence the relationship between inputs and outputs.
Using data from Eurostat, the EPPI facilitates the comparison of 23 European countries over time, offering a robust tool for analysing the relationship between environmental policy inputs and outputs. The inclusion of both subindices helps uncover discrepancies between policy efforts and environmental results, offering insights into where resources are well-utilized or misallocated. By adopting this dual-index approach, we provide critical insights into the environmental policy performance of individual countries, categorizing them into four distinct groups: high performers (high EPPIin and EPPIout), inefficient investors (low EPPIin and EPPIout), strategic achievers (low EPPIin, high EPPIout), and low performers (high EPPIin, low EPPIout). This classification provides valuable feedback to policymakers and contributes significantly to the broader scientific community’s understanding of environmental policy performance.
The remainder of this paper is organized as follows: Section “Environmental Policy Performance and Its Measurement” provides an overview of existing tools for environmental policy performance measurement, including some of their limitations. Section “Data” presents the data used in our analysis. Section “Methodology” explains the methodology employed for constructing the index. Section “Results and Discussion” discusses the results, including an analysis of both subindices and their relationship, as well as the categorization of countries based on their policy performance. Finally, the paper concludes with implications for further research and acknowledges the study’s limitations.
Environmental Policy Performance and Its Measurement
Environmental policy in Europe is shaped by a complex interplay of national autonomy and EU regulations. The European Green Deal (EGD) sets an overarching vision to transform the EU into a climate-neutral, resource-efficient economy by integrating various environmental domains into a cohesive framework (European Commission, 2019). By issuing nearly 30 strategic documents that address multiple areas and establish interconnected goals, the EGD aims to overcome policy fragmentation and address environmental challenges holistically (Charveriat and Holme, 2021; Paleari, 2024). However, while the EGD provides common EU standards, member states have discretion in implementation, leading to variations based on their socio-economic conditions and governance quality (e g. Bakkar et al., 2024; Bujdei-Tebeica, 2024). Studies have shown that while stricter EU policies, including taxes and emission regulations, are enforced, their effectiveness varies by national context and enforcement mechanisms (Albulescu et al., 2022; Buzogány & Cotta, 2024). This diversity of approaches necessitates evaluating policy performance through comprehensive indicators that incorporate governance and socio-economic factors.
Simplified, environmental policy can be defined as a set of government actions or decisions aimed at preventing or reducing harmful effects on the environment (e.g. Kraft, 1999; Lundqvist, 1996). Examining this definition, it becomes apparent that, like other policies, environmental policy can be assessed from three perspectives: evaluating the input, the output or policy performance (McDavid et al., 2018; OECD/European Union/EC-JRC, 2008). However, when evaluating complex public interventions, it is important to consider policy efficiency and effectiveness as two complementary performance aspects. Policy efficiency reflects the ability to transform input into output, while policy effectiveness measures performance in achieving given goals (Mergoni and De Witte, 2022).
Despite recognized importance, adequate measurements of environmental policy performance are lacking. To provide policymakers, as well as the general public, with a rough idea of a country’s status and whether it is moving in the right direction toward sustainable well-being, different indices have been developed. In general, (composite) indices are very popular due to their ability to offer quick insight into complex, multidimensional issues. Among these, several indices specifically focus on assessing progress toward achieving the Sustainable Development Goals (SDG), reflecting a broader commitment to addressing global environmental and social challenges. The SDG index stands out as the most comprehensive in this regard (Sachs et al, 2023). While it effectively tracks countries’ progress towards the SDG, its aggregation of diverse indicators – including socio-economic and institutional metrics – can obscure the specific contribution of environmental policy performance, potentially leading to an inexact representation of countries’ actual commitment to environmental issues. Therefore, some authors argue that it is necessary to disaggregate the SDG Index into more specific indices, such as development indices on one hand, and environmental indices on the other hand, which would allow for a more detailed tracking of progress towards SDGs in specific areas (Huan et al., 2021; Jabbari et al., 2020). A similar critique applies to the Sustainable Governance Indicators (SGI), which measure environmental sustainability alongside dimensions of democratic governance and forward-looking policy-making, and to recent proposals of new composite indices for the measurement of countries’ performance in the field of sustainable industrial development, such as the Green Industrial Performance (GIP) Index (Moll de Alba and Todorov, 2018, 2020, 2023) and the Inclusive and Green Industrial Performance (IGIP) Index (Halkos et al., 2021), which address all three dimensions of development, that is, social, economic, and environmental.
There exists a wide variety of indices specifically constructed to evaluate countries’ environmental performance. One of the most renowned ones is the Environmental Performance Index – EPI (Wolf et al., 2022), which has been used by many organizations, including the United Nations Environment Programme and the World Bank. The EPI measures the proximity of environmental outputs (ecosystem vitality and environmental health indicators) to the established policy target. Another recent development is the Environmental Transition Performance Index (ETPI), part of the broader Transitions Performance Index (TPI; European Commission, 2021). Like the EPI, the ETPI is primarily an output-based index, measuring environmental outputs such as emissions reductions and resource efficiency. The ETPI contributes to assessing countries’ progress in environmental transitions, reflecting the growing emphasis on sustainability (European Commission, 2022). Other measurements include the Climate Change Performance Index (CCPI), the Green Growth Index, the Eco-Innovation Index, the Ecological Footprint, and the Environmental Vulnerability Index (EVI).
However, the above-mentioned indices all have in common the fact that they measure environmental outputs. Relying solely on output indices to evaluate policy performance can be misleading for two reasons. Firstly, these indices often overlook the complex interplay between environmental results and the broader socio-political context in which they occur. For instance, factors like GDP per capita, urbanization, the quality of governance, democratic institutions, and bureaucratic capacity can all significantly influence environmental outputs (Adam and Tsarsitalidou, 2019; Block et al., 2024; Pimonenko et al., 2018). Therefore, a comprehensive assessment of environmental policy performance should account for both policy inputs and contextual variables. Secondly, by providing valuable insights into environmental outputs, these indices do not account for the stringency or effectiveness of the policies themselves, which makes them inappropriate for gauging policy performance (Pimonenko et al., 2018; Schaub, 2022). By construction, these indices reflect the challenges environmental policies aim to address, rather than the policies’ design or effectiveness (Sauter, 2014).
On the other hand, the literature also offers measurements that evaluate specifically the input side, namely the stringency of environmental policies. Early efforts relied on simple indices based on counts of enacted regulations and international treaties signed; however, such measures offer little insight into the actual stringency of environmental policies (Brunel and Levinson, 2013). Other measurements are based on self-reported information gathered with surveys. For example, Kalamova and Johnstone (2011) and Wagner and Timmins (2009) use the World Economic Forum survey indicator, which is obtained by asking business leaders about their perception of the environmental policy stringency. Beyond the subjectivity inherent in survey responses, the variation in questions across survey waves undermines comparability over time, rendering panel data analysis unfeasible (Brunel and Levinson, 2013). Other researchers use single policy instruments, such as the implicit tax rate on energy, the total revenue from environmental and energy taxes, and government expenditures on energy R&D (Galeotti et al., 2020), or a limited number of them (e.g. Fredriksson et al., 2004; List and Sturm, 2006; Newmark and Witko, 2007). However, using individual instruments can only provide partial assessments because countries pursue environmental goals through a mix of policy instruments that can vary widely across them (Kruse et al., 2022).Galeotti et al. (2020) compare various indicators of environmental policy stringency and demonstrate that their use in empirical analyses leads to different insights. They conclude that constructing a more comprehensive index – one that synthesizes information from multiple, complementary components – is advisable for capturing the multifaceted nature of environmental policy. Similar conclusions were drawn by Nourry (2008) regarding environmental sustainability indicators.
One of the most important contributions in this sense is the OECD’s Environmental Policy Stringency (EPS) index (Botta and Koźluk, 2014), which was updated in 2022 (Kruse et al., 2022). The EPS index consists of three equally-weighted subindices, which group market-based (e.g. taxes, permits, and certificates), non-market-based (e.g. performance standards) and technology-support policies. Since its introduction, it has been extensively employed in a wide range of studies examining the impact of environmental regulations on both economic and environmental outputs (e.g. Bigerna et al., 2020; Frohm et al., 2023; Olasehinde-Williams and Akadiri, 2024, etc.). Several studies have proposed alternative composite indices to capture the input side of environmental policy. Brunel and Levinson (2013), for instance, developed an emissions-based index grounded in the microeconomic principle that profit-maximizing firms adjust their use of inputs – including pollution – until marginal revenue products equal input prices. Accordingly, higher emission intensities are interpreted as reflecting lower pollution costs and thus laxer regulations. Building on this, Galeotti et al. (2020) apply Principal Component Analysis to aggregate the Brunel-Levinson indicators across various pollutants. Galeotti et al. (2018) propose a latent variable approach that estimates stringency from the residuals of an ordinal logistic three-level random intercept (TDRI) model.
Described composite indices suffer from methodological limitations related to data availability as well as their construction due to, for example, authors’ specific weighting and aggregation choices of the underlying indicators (both OECD/European Union/EC-JRC, 2008, and, more recently, Greco et al., 2019, provide an extensive discussion of such matters). Moreover, prevailing methodologies in assessing environmental policy performance often exhibit shortcomings by focusing exclusively on either input or output dimensions. Although several of the indices mentioned above are valuable tools, used not only to raise awareness of environmental issues but also to provide feedback to the general public and policymakers about the applied policy measures, they do not undertake the crucial task of evaluating both dimensions concurrently to provide a holistic assessment of policy performance. Moreover, several proposed indices even conflate the two dimensions, posing methodological challenges (e.g. Burck et al., 2023; Epule et al., 2021). To synthesize the strengths and weaknesses of major indices discussed, Table 1 provides a comparative overview. This highlights the distinctive contribution of the EPPI in providing a two-dimensional, empirically grounded tool for assessing alignment between environmental policy effort and results. As countries adopt increasingly stringent environmental regulations, there is a growing demand for robust tools to measure, compare, and evaluate the impact of their environmental policies (Kruse et al., 2022). In this regard, the EPPI index can be used not only for tracking progress but also for benchmarking performance and identifying policy leaders and laggards. In this way, our proposed tool contributes to a more refined understanding of environmental policy performance.
Key Limitations of Existing Environmental Policy Indices.

Data
To construct the two-part Environmental Policy Performance Index (EPPI), we developed a structured process for variable selection, aligned with the SMART (specific, measurable, achievable, relevant, time-bound) approach for variable selection. This process also draws from methodologies, applied in constructing other composite indices (e.g. Bartolj et al., 2018; Botta and Koźluk, 2014; Wolf et al., 2022) and incorporates criteria ensuring relevance, established methodology, verified results, spatial and temporal completeness, recency, and open data access. Following these tailored inclusion criteria, we prioritized indicators specific to environmental policy performance, distinguishing between policy inputs and outputs. This data-driven approach, commonly used in constructing similar indices (e.g. Environmental Sustainability Index, Environmental Performance Index), provides a reliable basis for cross-national comparison. However, such indices face inherent limitations due to trade-offs between including key contextually significant variables and the availability of appropriate data.
For the input-focused EPPIin subindex, we aimed to cover variables directly tied to national environmental policies managed by individual governments. Selected indicators on this side include metrics like pollution charges (e.g. resource, energy, transport, and pollution tax rates) and government subsidies (environmental expenditures), which reflect direct government action. Tradable permits, such as the EU Emissions Trading System (EU ETS), are excluded as they are managed at the EU level and do not capture national policy differences. Similarly to the EPSI (Botta and Koźluk, 2014), one of the most comprehensive indices measuring environmental policy, we were also unable to cover all groups of policy instruments, as defined by Czyżewski and Kryszak (2022), due to a lack of comparable data on market friction reduction data across countries. To partially address this limitation, we constructed a binary indicator capturing the presence of market friction reduction (MFR) policies using the OECD PINE database (OECD, 2025). This included instruments targeting improved information symmetry (e.g. eco-labels, public disclosure), liability enforcement (e.g. polluter pays mechanisms), and market access facilitation (e.g. water trading or conservation contracts). These instruments were identified using keyword-based classification applied to the database’s policy name and description fields. 1 While this variable is not used in the construction of the EPPIin subindex due to its binary nature, it allows us to explore in Section “The Relationship Between EPPIin and EPPIout” whether the presence of MFR instruments correlates with improved environmental outputs. This approach provides an initial step toward capturing a broader set of policy inputs that are conceptually important but not consistently quantifiable across countries or years.
For the output-focused EPPIout subindex, we selected indicators aimed at capturing the environmental policy performance. These variables reflect broader environmental goals, such as reducing resource consumption (material consumption, resource and energy productivity, share of renewable energy), improving sustainability in land use (organic farming), and reducing pollution (greenhouse gas emissions, waste generation and recycling rate, water exploitation). While organic farming primarily depends on EU-wide agricultural subsidies, differences between countries may still result from environmental expenditures that support sustainable land use, biodiversity, and pollution reduction. Additionally, taxes on resources, energy, and pollution can indirectly promote organic farming by raising the costs of conventional, input-heavy agriculture, making organic practices more attractive. Detailed explanations and data sources for all variables are provided in the Appendix (Table A1).
The final dataset, based on Eurostat, encompasses 23 countries 2 over the period from 2004 to 2021, providing a comprehensive temporal and geographical scope for our analysis. Detailed descriptive statistics are provided in Tables 2 and A3 in the Appendix. Within the EPPIin indicators, we observe increasing trends in resource and energy tax rates, suggesting an intensified policy focus on leveraging fiscal tools to address environmental challenges. In contrast, transport and pollution tax rates are on a decline, indicating possible shifts in policy emphasis or the evolving nature of environmental strategies. For the EPPIout component, trends show positive developments in resource and energy productivity, the share of renewable energy, organic farming, and the waste recycling rate, all of which are indicative of an advancing commitment to sustainable practices and efficiency in resource utilization. Meanwhile, trends in material consumption, waste generation, and greenhouse gas emissions are decreasing, suggesting successful outcomes of policies aimed at reducing environmental footprints. The trends for government environmental expenditures, categorized under EPPIin, alongside water exploitation in EPPIout, present ambiguous trends.
Overall Summary Statistics.

Source. Own work.
Methodology
The Environmental Policy Performance Index (EPPI) is a composite measure comprising two distinct dimensions: inputs and outputs. The EPPI is deliberately structured as a composite measure comprising two distinct subindices – EPPIin (policy inputs) and EPPIout (policy outputs) – to reflect the dual nature of environmental policy performance. Aggregating these two dimensions into a single index would obscure meaningful mismatches between policy effort and results-such as countries with high inputs but low outputs or vice versa. By separating inputs and outputs, the EPPI enables diagnostic assessment and more precise classification of country performance (e.g. strategic achievers, inefficient investors). Alternative approaches, such as computing an input-output efficiency ratio or using Data Envelopment Analysis (DEA), offer useful insights into policy efficiency, but they often require stronger assumptions (e.g. returns to scale, efficient frontier). Our approach prioritizes interpretability, policy relevance, and robustness, offering policymakers nuanced insights into where policy gaps or strengths exist.
The input-focused component, denoted as EPPIin, integrates variables indicative of environmental policy efforts, such as environmental protection expenditure. Conversely, the output-oriented segment, EPPIout, captures variables reflecting the consequences of these policies, for instance, greenhouse gas (GHG) emissions levels. Such reflective measurement model facilitates the computation of both EPPIin and EPPIout components utilizing exploratory factor analysis (EFA). EFA, which is one of the weighting methods recommended by OECD/European Union/EC-JRC (2008), offers two principal benefits: first, it effectively summarizes the variables, retaining a maximal amount of variation from the original data. Second, it preferentially weights variables exhibiting significant variation across countries, enhancing the utility of the index for international comparisons. The rationale behind employing factor analysis for weighting is to mitigate the issue of overlapping information among variables, thus preventing the “double counting” of indicators within the index.
Building upon the insights of De Winter and Dodou (2012), our methodology employs Principal Axis Factoring (PAF) as the primary estimation technique. This choice is motivated by the context of our study, which involves a limited number of indicators per factor and absence of their multivariate normality. To address potential biases in EFA results due to missing data, we employed a method of imputation that replaces missing values with the temporally nearest available data for the same country (see Table A2 in Appendix for the missing data description). Such an approach ensures continuity and improves the reliability of our dataset.
Guided by the JRC’s (Saisana et al., 2019) recommendation to treat data normality when absolute skewness exceeds 2.0 and kurtosis surpasses 3.5 or kurtosis reaches beyond 10, we employed winsorization technique to refine our dataset for enhanced analytical precision. Specifically, this adjustment was applied to the variables resource tax rate, transport tax rate, pollution tax rate, water exploitation, and waste generation. Winsorization mitigates the influence of extreme outliers by replacing them with the nearest values within the accepted range, thereby stabilizing variance and rendering the data more suitable for subsequent statistical analyses. 3 This methodological step ensures that our evaluation of environmental policy performance through the EPPI is both robust and reliable, adhering to best practices in data preprocessing.
Next, we standardized the variables (calculated z-scores) to avoid the problem of different measurement units according to the following formula:

where
One of the key parts of EFA is the determination of the number of factors. For each component of the EPPI, the number of factors was grounded in parallel analysis (PA), a technique first introduced by Horn (1965). PA is recognized as the most effective yet underused empirical method for factor retention, notable for its robustness against the distributional assumptions of the data (Dinno, 2009; Hayton et al., 2004). This method involves generating random datasets that match the original data in terms of sample size and the number of variables. Factors are then retained based on whether their actual eigenvalues exceed the average of the eigenvalues derived from these parallel, randomly generated datasets. To adopt a more conservative approach, as recommended by Glorfeld (1995), factors are retained only if their actual eigenvalues surpass the 95th percentile of these random eigenvalues. This process ensures a rigorous and statistically sound basis for factor selection, minimizing the risk of overfitting or underestimating the dimensionality of the data.
Following the EFA, we proceeded to calculate the weights for each variable to construct the composite two-part Environmental Policy Performance Index (EPPI). Adhering to the guidelines set forth by the OECD et al. (2008), the weighting procedure is designed to ensure that each variable’s contribution to the intermediate index reflects its relative importance and the degree to which it explains the underlying factor. For each variable (varj, where j = 1,…,p) within the intermediate index (Ii, where i = 1,…,f), the initial weight
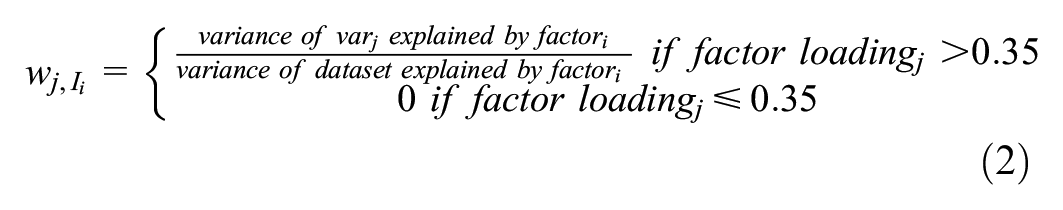
These initial weights are then normalized to ensure that the sum of weights for each intermediate index equals one, yielding the normalized weigh

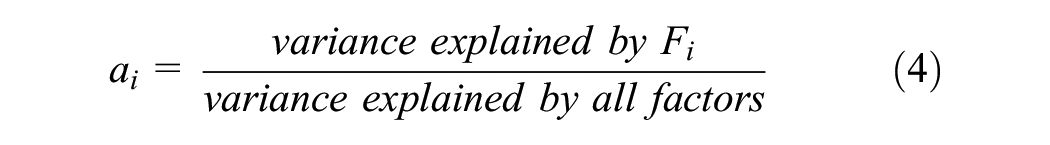
Furthermore, the weight of each intermediate index within the composite index is calculated as:
Consequently, the weight of each variable in the composite index,

In the concluding step of creating the two-part Environmental Policy Performance Index (EPPI), we calculate the EPPIin and EPPIout scores through linear aggregation. This approach is chosen due to the use of z-scores for standardizing variables, which makes geometric aggregation unsuitable because it cannot accommodate the negative values that result from standardization.
The relationship between the two parts of EPPI is then estimated with fixed effects (FE), random effects (RE) and spatial autoregressive models for panel data. The FE model controls for unobserved variables that are constant over time by focusing solely on within-entity variation, which is ideal for examining effects that vary across entities but not over time. The RE model, on the other hand, considers variations both within and between entities, assuming that the individual-specific effect is random and uncorrelated with the independent variables across all entities. The Hausman test can be used to decide which of the two is appropriate. Finally, the spatial autoregressive model extends these analyses by incorporating the spatial dependency of data, allowing for the assessment of how changes in one country’s EPPIin scores might influence neighbouring countries, thus capturing the interconnectedness of environmental policy impacts across geographical locations. We used two different spatial weighting matrices: contiguity matrix, where elements before normalization are equal to 1 if countries are neighbours or 0 otherwise, and inverse-distance weighting matrix, with elements before normalization equal to reciprocal of distance between countries.
Results and Discussion
Structure and Temporal Dynamics of EPPin and EPPIout
The outcomes of the parallel analysis for both EPPIin and EPPIout components are depicted in Figure A1 in the Appendix. The results indicate the presence of three factors for EPPIin and five factors for EPPIout. This finding is based on the observation that beyond these numbers of factors, the eigenvalues of the randomly generated data turn negative, despite the actual eigenvalues remaining above the 95th percentile of random eigenvalues for a higher number of factors. Additionally, the identification of three factors for EPPIin and five for EPPIout aligns with the recommendations from the screen plot stopping rule, providing further validation for our factor selection.
Table 3 showcases the variable weights for EPPIin and EPPIout using the z-score normalization method. The pollution and transportation tax rates receive highest weights in EPPIin, with government expenditures ranking low. In EPPIout, the highest and lowest weights get variables waste generation and energy productivity, respectively.
Variable Weights in EPPIin and EPPIout.

Source. Own work.
Note. Table presents weights obtained with z-score normalization of variables. Weights obtained through min-max normalization are identical.
Ideally, correlations between composite index and its indicators should not be so strong that any single indicator disproportionately influences the index, nor so weak that indicators are underrepresented. Results in Table 4 show that no correlation coefficient among the indicators exceeds 0.95, which prevents any one of them from dominating. All indicators show absolute correlations above 0.3, ensuring a balanced representation. Additionally, the data show coherent directional agreement, with no negative correlations between the indicators and both EPPIin and EPPIout. The lack of strong correlations with GDP per capita and population also supports the EPPI framework’s integrity, confirming it as a fair and unbiased method for assessing environmental policy performance.
Correlations of EPPIin and EPPIout with Underlying Indicators and Macroeconomic and Demographic Measures.

Source. Own work.
Figure 1 presents the progression of countries based on their EPPIin and EPPIout sub-indices from 2004 to 2021, respectively. Beginning with the ranking derived from EPPIin scores, notable shifts primarily occur among countries positioned in the lower half of the ranking. This observation implies that alterations in efforts to achieve environmental objectives have influenced the relative standings of certain countries. In several instances, modifications in environmental policies have resulted in significant advancements or declines in a country’s ranking position. Particularly noteworthy is Greece, which occupied a low rank in EPPIin scores in 2004 (the 18th position) but ascended to the 6th position in the ranking by 2021. This substantial rise can largely be attributed to significant increases in government expenditures dedicated to environmental policies, alongside heightened energy tax rates. Greece was also placed near the bottom of the OECD’s Environmental Policy Stringency (EPS) Index at the beginning of the observed period (Botta and Koźluk, 2014). While the EPS shows some improvement over time – especially during 2013–2015 – the magnitude of change is notably smaller. This suggests that the broader fiscal and policy effort captured by EPPIin reflects a more substantial shift in Greece’s environmental commitment than is visible through the narrower set of instruments covered by the EPS.
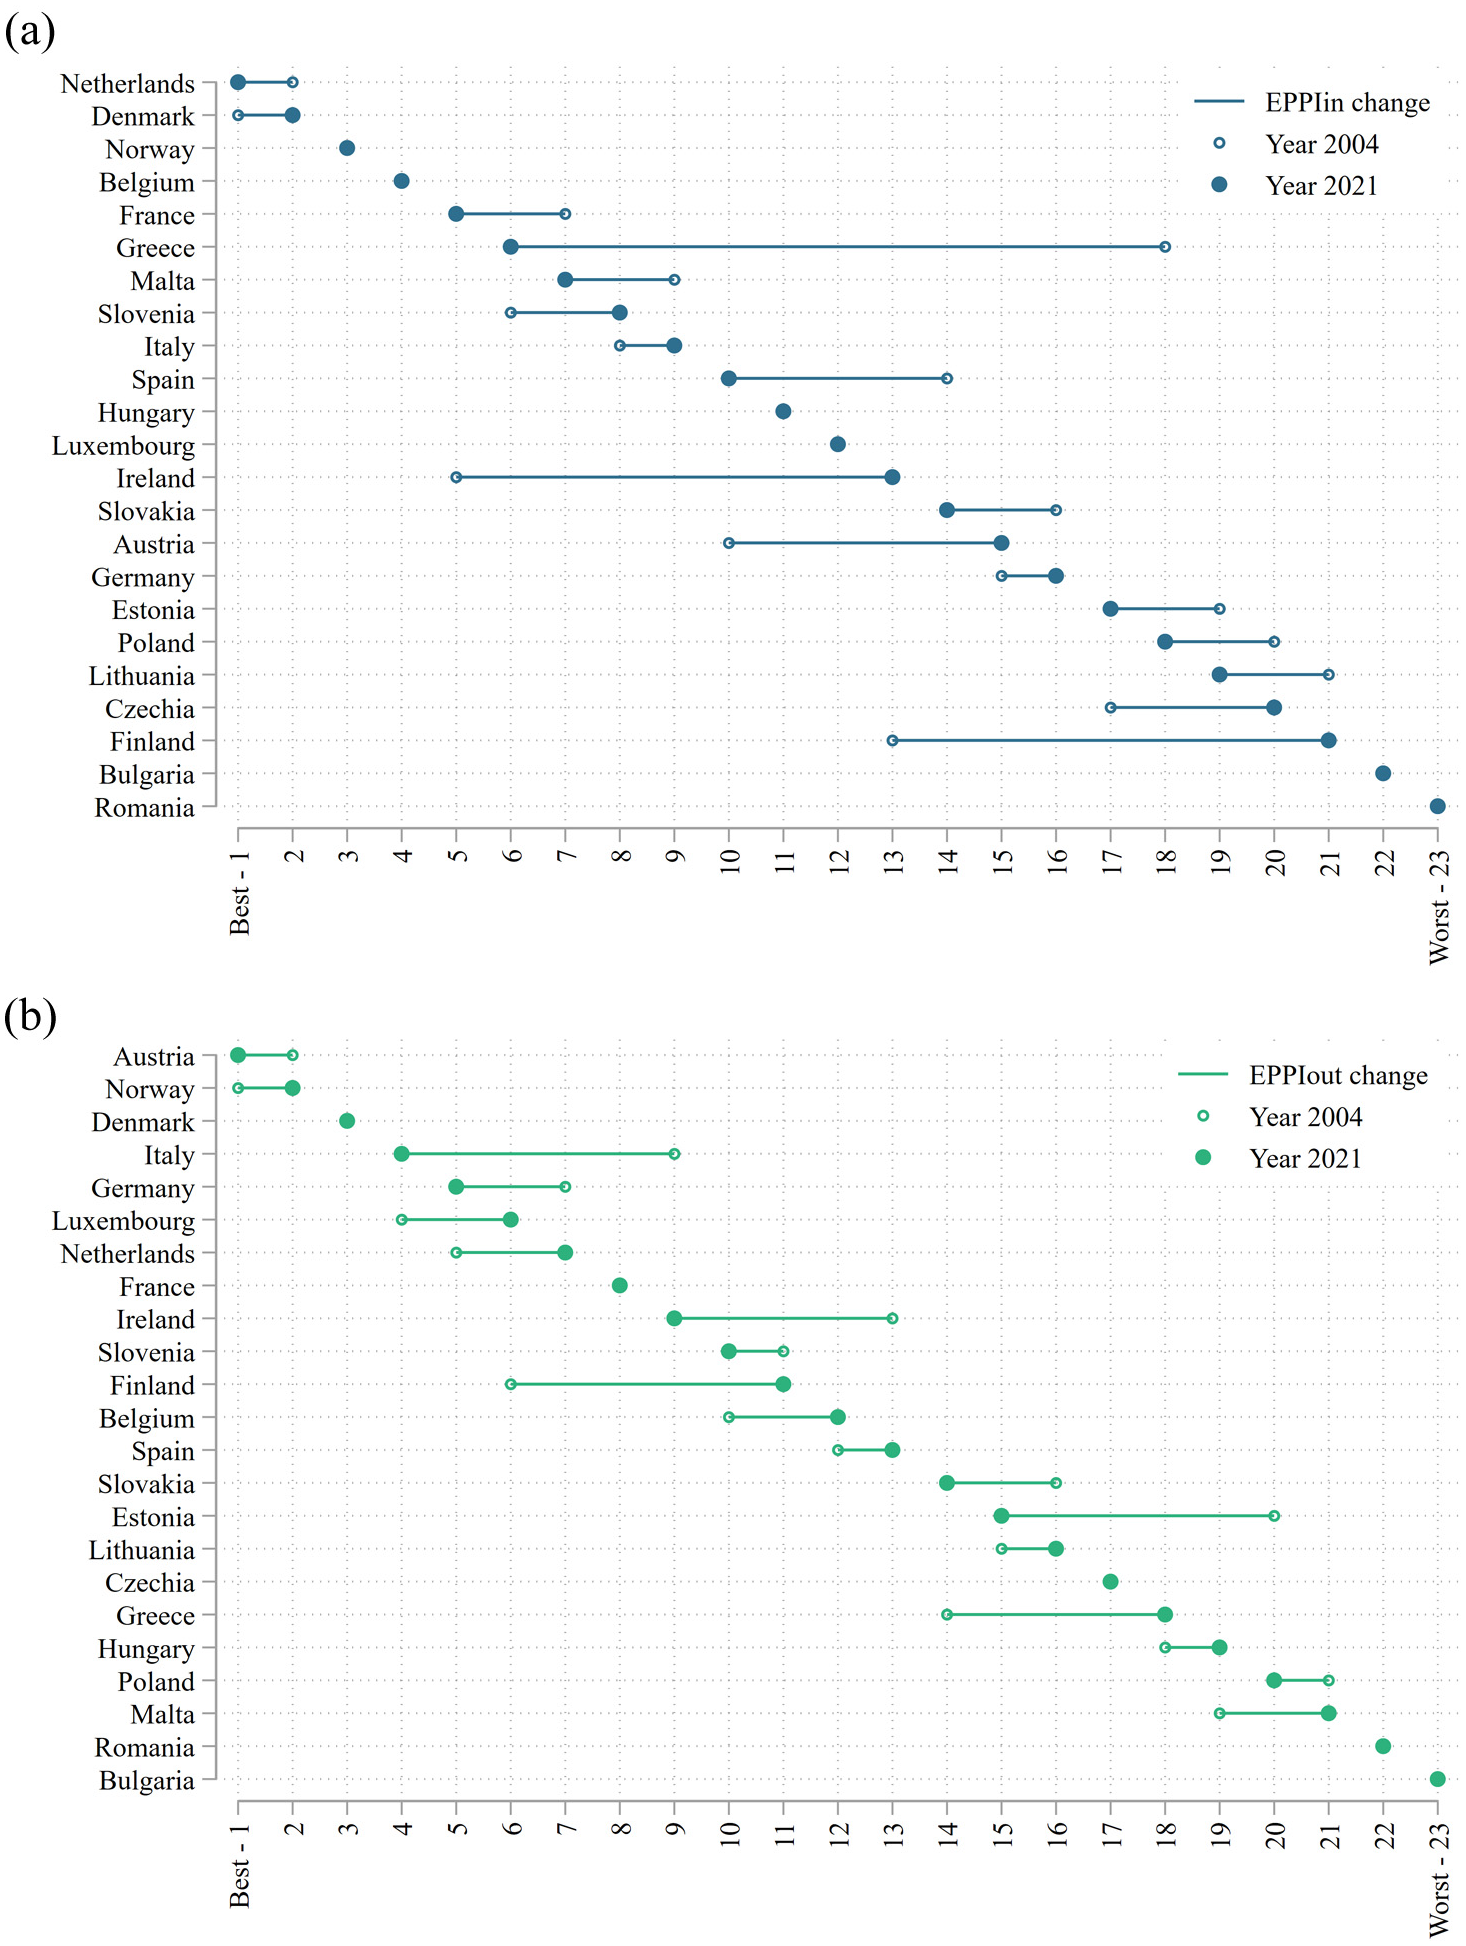
Ranking of countries in 2004 and 2021: EPPIin (a) and EPPIout (b).
Conversely, Ireland and Finland showed a relative decline across all measured indicators compared to other countries, culminating in a decrease of eight positions in 2021. This decrease is also not as clearly captured in the available data for the OECD’s EPS indicators (Botta and Koźluk, 2014; Kruse et al., 2022). For Ireland, the most significant decrease was in environmental expenditures, while Finland experienced a relatively larger drop in the resource tax rate. Interestingly, the top three countries, namely, the Netherlands, Denmark, and Norway, have remarkably sustained their positions with minimal alterations across the entire time series, demonstrating consistent and ongoing environmental efforts of the governments. This pattern reflects their long-standing commitments to environmental governance, strong institutional frameworks, and integration of environmental goals into national budgets and taxation systems. All three countries exhibit relatively high energy, transport, and pollution tax rates, early adoption of green technologies, and a history of public support for sustainable development initiatives. Further details about the evolution of the ranking of countries over time in EPPIin and EPPIout scores are provided in Figures A2 and A3 in the Appendix, respectively.
On the other hand, the ranking based on EPPIout scores exhibits considerably less variability in the positions of countries, indicating a lower degree of responsiveness in environmental quality despite shifts in environmental policies. Such result is expected, since environmental policies require more time to reflect in environmental outputs. Besides, a multitude of other factors can impact environmental policy outputs. While notable changes in rank are sparse, Italy and Estonia demonstrated an improvement of five positions in its EPPIout score over 2004–2021 period. The main drivers for Italy’s higher ranking were relatively deeper cuts in GHG emissions and a significant increase in the waste recycling rate. Estonia’s progress is further supported by findings from the Environmental Performance Index (EPI), which identified it as the country with the largest overall improvement in environmental performance over the past decade among all countries assessed (Block et al., 2024). However, this recognition was primarily due to its rapid decline in GHG emissions – whereas the main factor driving Estonia’s rise in EPPIout was a marked reduction in water exploitation, a dimension not captured by the EPI. Finland experienced the largest drop in ranking, primarily due to sluggish increases in waste recycling and modest decreases in GHG emissions.
The rankings of countries vary when comparing EPPIin and EPPIout indicators. This discrepancy provides valuable insights into how different nations implement and benefit from environmental policies. By exploring the relationship between these two sets of indicators, we can gain a deeper understanding of the nuances of environmental policy performance. This analysis will be further elaborated in the next subsection, where we will examine specific cases and trends.
The Relationship Between EPPIin and EPPIout
To display the dynamics of environmental policy performance, Figure 2 effectively captures the nuanced relationship between the EPPIin and EPPIout sub-indices, both of which are normalized according to equation (1).

The EPPIin–EPPIout relationship.
The dynamic interplay between the EPPIin and EPPIout sub-indices, as depicted in Figure 2, underscores the non-linear relationship between environmental policy inputs and outputs over time. Notably, the EPPIin sub-index displays a greater degree of variability compared to the EPPIout sub-index, a distinction accentuated within the largest cluster of data points. Adjacent to this primary cluster lies a secondary, albeit smaller, cluster characterized by elevated scores in both measures. Generally, an inverse U-shape relationship emerges between the two EPPI components, indicating complex dynamics in policy performance. Initially, increased inputs such as government environmental expenditure and various environmental taxes contribute positively to outputs, enhancing metrics like resource or energy productivity. This positive trend suggests that higher inputs improve policy implementation and compliance up to an optimal point. However, beyond this peak, the curve dips as additional inputs yield diminishing returns. The decline may reflect overregulation, which creates economic and compliance burdens. It may also result from inefficiencies due to misallocated resources or from hitting a saturation point where further improvements are limited by current technology and market conditions. Furthermore, recent years (marked in darker colours) demonstrate an enhancement in the EPPIout sub-index, thus corroborating the insights about positive developments of the environmental results, gathered from the analysis presented in Table A3 in the Appendix.
To further contextualize the EPPIin–EPPIout dynamics, Figure 2 incorporates an additional dimension by marking country-year observations with active market friction reduction (MFR) policies. These include instruments such as eco-labelling, liability regimes, or mechanisms that facilitate market access for environmentally beneficial practices. As visualized in red, these observations are disproportionately located within the upward-sloping portion of the inverse U-shape, particularly in the transition zone between moderate and high EPPIin levels. This pattern suggests that MFR policies may play a complementary role in enhancing the efficiency of policy inputs, potentially contributing to better environmental outputs without necessarily increasing expenditure or tax burdens. While not causal, this pattern supports the interpretation that the quality and composition of policy instruments – beyond their sheer quantity – are important in shaping environmental performance. Although we do not incorporate MFR policies directly into the EPPIin sub-index due to inconsistencies in data format and comparability, the regression results presented later demonstrate that this exclusion does not critically undermine the index’s reliability or explanatory value.
In terms of environmental policy performance, countries can be categorized into one of four distinct groups based on their respective scores in the EPPIin and EPPIout indices. The first group –high performers– consists of countries that achieve high output (EPPIout) scores with high inputs (EPPIin), indicating robust environmental governance and successful policy implementation. The second group –low performers – includes countries that score low on both indices, suggesting challenges in both the development and execution of environmental policies. The third group –strategic achievers – features countries with a lower EPPIin score but a high EPPIout score, which might reflect an efficient translation of limited inputs into significant environmental outputs, possibly due to innovative or highly adaptive strategies. Finally, the fourth group –inefficient investors– comprises countries with high inputs as indicated by their EPPIin score but low outputs as shown by their EPPIout score, pointing to inefficiencies or other barriers that hinder policy realization despite substantial investments.
In examining the temporal dynamics of EPPIin and EPPIout, it becomes evident that basing the four categorizations solely on the absolute values of these sub-indices is not methodologically sound. This approach does not account for the influence of technological advancements or changes in preferences, which can uniformly alter the values of EPPIin and EPPIout across all observed entities. Consequently, a more robust method involves the use of rankings, where the distinction between low and high categories is demarcated at rank 12. This ranking-based approach allows for a relative comparison that remains valid despite shifts in absolute values due to technological progress or preference alterations, ensuring that the categorization reflects current performance rather than historical data artefacts.
Figure 3 provides geographical maps of the four groups at the beginning and end of the observed period, specifically for 2004 and 2021. This visualization shows that some countries like Norway, Denmark, the Netherlands, France, Italy, and Slovenia consistently remained as high performers. Such a pattern aligns with previous research, which has similarly identified these countries as long-standing environmental frontrunners (e.g. Biancalani et al., 2024; EEA, 2024; EEA, EE, 2005). They share several structural and institutional strengths: long-standing commitments to environmental governance, robust regulatory frameworks, and a high degree of policy coherence. For instance, Denmark and the Netherlands implemented early and comprehensive green tax reforms (e.g. European Commission, 2024; Lenain, 2024; OECD, 2015, 2019), while France benefits from a low-carbon energy mix dominated by nuclear power (SGI, 2024; World Nuclear Association, 2025). Italy significantly improved its recycling and emissions performance over the period (ISPRA, 2024; Ronchi, 2024), and Slovenia, despite being a post-socialist country, effectively leveraged EU funds and demonstrated strong compliance with environmental legislation (European Commission, 2023b; SGI, 2024).

Environmental policy performance of countries in 2004 and 2021.
In contrast, most Eastern European countries – excluding Hungary – were persistently classified as low performers, reflecting both limited policy effort and modest environmental outputs. This pattern can be traced to a combination of legacy industrial structures, continued reliance on coal and resource-intensive sectors, and weaker administrative capacity. These countries often faced challenges in fully implementing EU environmental directives, leading to recurring infringement cases and slow progress in waste, air, and water management (e.g. European Commission, 2023a; Tang, 1993).
The maps also indicate shifts in environmental policy performance. For example, despite increased policy efforts, Spain and Greece did not improve their environmental outputs by 2021, placing them in the innefficient investors category. In both cases, elevated public expenditure and taxation efforts were undermined by institutional weaknesses, fragmented governance, and delays in implementation. Spain, for example, has struggled with coordination between national and regional authorities (SGI, 2024), while Greece continues to face challenges in waste infrastructure and compliance with EU environmental standards (European Commission, 2022).
Ireland and Austria reduced their policy efforts but achieved better outputs, ranking them as strategic achievers, alongside Finland and Germany. Ireland leveraged market-based instruments, such as carbon taxes, and benefited from structural economic shifts that reduced emissions (Eurostat, 2025). Austria, already a leader in environmental regulation, maintained high outputs through established systems for waste and energy management without requiring significant new investments. Similarly, Finland and Germany demonstrated the ability to sustain or improve environmental outputs through high regulatory quality, technological innovation, and efficient governance, even as direct policy inputs plateaued or declined. (Eurostat, 2025) These cases underscore that not only the quantity but the quality, consistency, and institutional embedding of environmental policy efforts are key to achieving strong environmental performance.
While the EPPI was constructed as a two-part index to descriptively compare policy inputs and outputs without assuming a direct causal link, we include an econometric analysis of the relationship between EPPIin and EPPIout to gain additional insight into environmental strategies. This analysis does not seek to imply causation; rather, it aims to explore whether general patterns exist – such as whether increased policy inputs tend to be associated with better outputs, and whether there are diminishing returns beyond certain input levels. Identifying such non-linearities and spatial dependencies contributes to understanding policy performance across contexts. By using lagged input measures, fixed effects, and spatial autoregressive models, we mitigate concerns about reverse causality and emphasize the exploratory nature of this analysis. Thus, while the EPPI’s construction remains strictly comparative and diagnostic, the accompanying regression analysis serves to enrich the interpretation of cross-country patterns and policy alignment.
The spatial regression model is critical, as environmental outputs are interconnected; decisions in one country can significantly affect outputs in neighbouring nations. By integrating spatial weights into our model, we effectively evaluate both the direct and indirect influences of EPPIin on EPPIout across various countries. Results are presented in Table 5. Specifically, models (1) and (2) employ random-effects and fixed-effects approaches, respectively, to regress the EPPIout score on the lagged EPPIin component and its square. The fixed-effects control for unobserved, time-invariant characteristics, while EPPIin from pior periods ensures that policy inputs precede environmental outputs. Together, these features help mitigate potential reverse causality – that is, environmental impacts could influence policy decisions just as policies can shape environmental quality (as pointed out in e.g. Czyżewski et al., 2022; Kleijn and Sutherland, 2003). To account for the interconnectedness of countries’ environmental policies, models (3) to (6) incorporate spatial autoregressive techniques, augmenting EPPIout levels with spatially lagged EPPIout indices from neighbouring countries alongside the independent variables utilized in models (1) and (2). We apply both random effects (models 3 and 5) and fixed effects estimators (models 4 and 6), employing two weighting schemes to ascertain spatial distance between countries: geographic contiguity in models (3) and (4), and inverse distance in models (5) and (6).
Effects of Policy Inputs (EPPIin) and Spatial Interdependencies on Policy Outputs (EPPIout).

Source. Own work.
Note. The table reports the estimated coefficients, with corresponding standard errors (in parenthesis below). The χ2 value of Hausman test between RE and FE model is 3.15, with a p-value equal to .207.
p < .1. **p < .05. ***p < .01.
In line with Figure 2, our analysis identifies a non-linear, inverse U-shaped relationship between environmental policy inputs (EPPIin) and environmental outputs (EPPIout). As EPPIin increases, EPPIout initially rises, reaches an optimum point, and then begins to decline if EPPIin continues to increase. This dynamic suggests a point of diminishing returns in environmental policy performance. The Hausman test, which we employed to discern the most suitable model for our data, does not reject the null hypothesis, indicating no systematic differences in the coefficients between models. Therefore, the Random Effects (RE) and the Fixed Effects (FE) models’ estimates are considered consistent, but RE’s are also efficient. According to this model, the peak of EPPIout is achieved when the EPPIin z-score is approximately 0.9 standard deviations above the mean level of EPPIin in 2004. Conversely, the Fixed Effects (FE) model suggests a slightly lower peak, at 0.7 standard deviations, reinforcing the robustness of our findings and highlighting the critical balance required in policy inputs to optimize environmental quality.
Since in spatial models changes in any regressor for any observation spill over and affect the values of dependent variables for all observations, we need to differentiate between the direct, indirect, and total impact of EPPIin. In all estimated spatial models, the spatial lag coefficient of EPPIout is statistically significant and positive, leading to larger indirect effects compared to the direct effects. Specifically, an increase in EPPIin in previous period directly enhances EPPIout within the same region. This improvement in EPPIout can then positively influence the EPPIout in neighbouring regions. As these adjacent regions experience improved EPPIout, this, in turn, feeds back to further enhance the EPPIout in the original region where EPPIin was increased, exemplifying the indirect effect of the initial policy input across the spatial system. Conversely, if a country reduces its EPPIin on period as a result of free riding, hoping to benefit from the environmental efforts of neighbouring regions without making similar investments, this could lead to a reduction in its own EPPIout in the next period. This reduction might not only lower the country’s environmental quality but could potentially weaken the environmental outputs in surrounding regions as well, diminishing the overall performance of regional environmental policies.
The strong spatial interconnections indicate the presence of bias in RE and FE models. However, the value of EPPIin after which increases are not desirable any more due to the diminishing returns are very close for the direct and total effects. The direct and total effects of EPPIin peak at roughly 0.9 and 0.7 in RE and FE model with inverse-distance spatial weighting matrix, respectively. The estimated peaks of those effects using contiguity weighting matric are lower: 0.7 for RE and 0.5 for FE model, respectively, but could be less reliable as the missing data on countries not included in the analysis might present a bigger problem than in the case of inverse distances – the later consider data for all countries and not just the neighbouring ones. This analysis suggests that the optimal policy should aim to maintain EPPIin within these identified peak ranges to maximize EPPIout efficiently. Managing policy inputs to stay within this optimal zone could prevent the inefficiencies associated with overstretching environmental efforts beyond the peak, ensuring more sustainable and effective policy performance across regions.
To test whether the presence of market friction reduction (MFR) policies is statistically associated with environmental policy outputs, we extended our spatial regression models by including a lagged binary indicator for these instruments. The results, presented in the last two columns of Table 5, indicate that MFR policies are positively and significantly associated with higher EPPIout scores, even after controlling for non-linear effects of policy inputs and spatial dependence. While causality cannot be inferred, these findings support the interpretation that incorporating institutional and informational instruments into environmental policy design may enhance overall performance, particularly when embedded in broader governance ecosystems.
The inclusion of MFR policies in the spatial models slightly reduces the magnitude of the coefficients on lagged EPPIin and its squared term. For instance, the EPPIin coefficient decreases from 0.115 to 0.100 (RE models) and from 0.095 to 0.079 (FE models), while the squared term remains largely stable. These modest changes suggest that the presence of MFR instruments accounts for some additional variation in environmental outputs, but they do not substantially alter the core inverse-U relationship between input intensity and output performance. This implies that while MFR policies play a complementary role, they do not displace the relevance of fiscal inputs.
Conclusion
The development of indexes such as the two-part Environmental Policy Performance Index (EPPI) provides essential tools for policymakers seeking to evaluate their environmental initiatives (Adam & Tsarsitalidou, 2019; OECD et al., 2008). Additionally, these indices serve as informative resources for the general public, shedding light on the environmental efforts of their respective countries and fostering accountability and transparency in governance. Unlike traditional indices that focus on single dimensions, the EPPI offers a comprehensive assessment by distinctly measuring both policy inputs and outputs, thereby providing a more refined understanding of policy performance.
This study underscores the pivotal role of policy inputs and performance in shaping environmental outputs, offering valuable insights for both public awareness and policymaking. Moreover, the nuanced relationship between EPPIin and EPPIout emphasizes the need for tailored policy approaches that balance input levels with desired environmental outputs. Additionally, the presence of technological or behavioural thresholds for countries exhibiting high levels of both inputs and outputs underscores the necessity for continuous innovation and adaptive strategies in environmental policy (e.g., Jacob and Ekins, 2020; Jordan and Huitema, 2014; Massey et al., 2014). The prominence of certain countries in EPPI rankings provides valuable guidance for policymakers, enabling them to identify leading practices and areas for improvement (OECD/European Union/EC-JRC, 2008). However, the dynamic nature of environmental challenges necessitates context-specific interventions and ongoing monitoring.
While our study primarily focuses on European countries, the methodologies and insights we have developed are both transferable and adaptable, offering a robust template for environmental policy assessment on a global scale. The core structure – combining standardized policy input indicators (e.g. government environmental expenditure, environmental taxes) with output measures (e.g. emissions, resource efficiency) – relies on widely recognized and internationally reported variables, many of which are available through global datasets such as the OECD, World Bank, UNEP, and IEA. For instance, countries in North America, East Asia, or Latin America often collect comparable data on pollution taxation, energy consumption, and greenhouse gas emissions, which would allow for replicating the two-dimensional EPPI framework.
Some regional adjustments may be necessary to account for differences in governance structures, data quality, or available policy instruments. For example, in low- and middle-income countries, environmental outputs may be more influenced by informal sector activity or lack of enforcement, requiring careful interpretation of input–output relationships. Moreover, while our current EPPIin subindex does not include tradable permit systems, as they do not vary meaningfully across analysed countries, such instruments would likely need to be included in regions where they are nationally administered. Nevertheless, the flexible design of the EPPI – built on a modular, empirically grounded composite structure – makes it suitable for comparative assessment in a range of institutional and developmental contexts, offering a valuable tool for global policy benchmarking and environmental performance tracking.
That said, we recognize that a deeper exploration of cross-regional applicability is essential. Applying the EPPI globally would require not only adapting certain indicators but also considering region-specific adjustment factors – not to modify EPPIin directly, which is already normalized, but to help interpret the relationship between inputs and outputs. Factors like governance quality, regulatory fragmentation, or administrative capacity could be included as moderating variables in regression models to help explain why similar policy inputs lead to different results in different countries. In addition, geographic and biophysical characteristics – such as climate conditions, population density, resource endowments, and environmental baselines – can shape achievable environmental outputs independently of policy. Incorporating such variables as controls or stratification criteria in future analyses would help isolate the true effect of policy effort and enhance cross-country comparability.
Although future data updates may introduce some variability due to, for example, winsorization, our sensitivity analysis indicates that the index remains largely stable over time, supporting its use for longitudinal environmental policy assessment. Nonetheless, it is imperative to acknowledge the limitations inherent in such assessments. These include the assumption of “good governance” as a critical factor and the need for more comprehensive measures of policy performance (Adam and Tsarsitalidou, 2019). Furthermore, there are always trade-offs between the availability, reliability and quality of data on one hand, and the inclusion of a broader selection of contextually relevant environmental policy indicators on the other. For example, this led to the exclusion of certain indicators, such as those measuring the reduction of market frictions in EPPIin.
To partially address this gap, we conducted a supplementary analysis using a binary variable identifying the presence of market friction reduction (MFR) across country-year observations. While not included in the composite index due to data format and comparability constraints, the inclusion of this variable in exploratory spatial regressions showed a positive and significant association with improved environmental outputs. Importantly, the coefficients on EPPIin and its squared term changed only modestly with the addition of the MFR variable, which underscores two key points: first, that the EPPIin sub-index is robust and reliable even when certain policy domains are not fully captured; and second, that MFR policies appear to complement rather than substitute for core fiscal instruments. These findings suggest that institutional and information-based measures enhance the efficiency of environmental inputs and warrant consideration in future expansions of composite policy performance metrics.
Future research could begin by incorporating additional indicators, thereby enhancing the ability of the EPPI to assess environmental policy comprehensively. Expanding this methodology to global datasets would provide actionable insights for policymakers worldwide. However, the application of EPPI to regions outside the same emissions trading system would require consideration of policy instruments like tradable permits, which play a key role in many countries’ environmental strategies (Döbbeling-Hildebrandt et al., 2024). Ultimately, such enhancements would enable a more robust, globally adaptable framework for evaluating policy performance, supporting sustainable development efforts and reinforcing environmental resilience in line with pressing global objectives.
Footnotes
Appendix
Keywords Used to Identify MFR Policies.

| Category | Keywords |
|---|---|
| Market-based instruments | Water trading, ecosystem services, wetland banking, offset registry, land stewardship, conservation contracts, service markets, permit bank, riparian rights, market access |
| Liability and compliance | Liability, polluter pays, insurance requirement, bond requirement, compensation fund, responsibility, compliance assurance, cleanup cost, restoration order |
| Information-based instruments | Label, labelling, eco-label, energy efficiency, information campaign, awareness, product disclosure, transparency, emissions register, public disclosure, right to know, information provision, inspection reports, reporting obligation, benchmarking, monitoring |
Ethical Considerations
This article does not contain any studies with human or animal participants.
Informed Consent Statements
Informed consent is not required.
Funding
The author(s) disclosed receipt of the following financial support for the research, authorship, and/or publication of this article: This work was supported by the Slovenian Research and Innovation Agency (Grant No. J5-4576 and Grant No. P5-0096).
Declaration of Conflicting Interests
The author(s) declared no potential conflicts of interest with respect to the research, authorship, and/or publication of this article.
Data Availability Statement
The datasets generated during and/or analysed during the current study are available from the corresponding author on reasonable request.
Declaration of Generative AI and AI-Assisted Technologies in the Writing Process
During the preparation of this work the author(s) used ChatGPT in order to improve readability and language. After using this tool/service, the author(s) reviewed and edited the content as needed and take(s) full responsibility for the content of the publication.