
Abstract
The purpose of this study is to examine the effect of using Web 2.0 tools in social studies teaching on middle school students’ metacognitive awareness levels and academic achievement. The study group of the research consists of a group of sixth grade students studying in a public middle school in Turkey in the fall semester of the 2020 to 2021 academic year. In the research, a mixed method utilizing both quantitative and qualitative methods has been employed. In the quantitative dimension of the study, “Metacognitive Awareness Scale” and “Academic Achievement Test” were used as data collection tools. In the qualitative dimension of the study, a questionnaire prepared by the researchers was used to obtain the opinions of the students in the study group about the use of Web 2.0 tools. The data obtained from the quantitative measurement tools were analyzed using the statistical package program (SPSS). The data obtained from the qualitative measurement tool were analyzed using the descriptive analysis method. According to the results obtained from the quantitative data of the study, the use of Web 2.0 tools in the social studies course increased the metacognitive awareness levels of sixth grade middle school students and their academic achievement towards the social studies course compared to the course taught in traditional ways. Looking at the results obtained in the qualitative dimension of the research, it was concluded that students developed a positive perspective towards Web 2.0 tools, increased their interest and enthusiasm for the lesson, facilitated learning, provided retention, reinforced the subjects, increased their motivation, and made learning fun.
Introduction
In the 21st century, technology and digitalization are accelerating. According to what is known as the “Law of Accelerating Returns” or “Kurzweil’s Law,” technological advances are increasing exponentially. So much so that in the current century, it is predicted that there will be approximately 20,000 years’ worth of technological progress or about a thousand times the progress made in the previous century (Kurzweil, 2017). Depending on these technological developments, it is thought that there will be many changes in teaching and learning methods in the future (Shahroom & Hussin, 2018). In the current century, the role of digital technologies in supporting learning and teaching has started to replace traditional non-digital tools (Greenhow et al., 2009).
Today, the education model in which students passively receive information and the textbook serves as the main teaching tool cannot adequately prepare students to be productive individuals in the digital age. (Fisher & Waller, 2013). It is therefore quite common for students to become bored in a traditional education model (Broadfoot, 2000). Traditional education methods therefore appear to be outdated (Hanley, 2005). In contrast to traditional education, in a classroom environment where technology is used effectively, skills such as cooperation, communication, problem solving and critical thinking are developed (L. A. Gibson & Sodeman, 2014). Today’s students should be able to have skills such as digital literacy, creative thinking, effective communication, teamwork (Firmin & Genesi, 2013).
Students in the digital age learn by exploring the information they access on the web, in addition to learning in a lecture-oriented school (Brown, 2000). In order to attract the attention and interest of today’s students, the use of different emerging technologies in educational environments seems to be an important need. Therefore, it can be said that an education based on digital teaching and learning features is necessary (Klibavicius, 2014). The lack of absolute need for physical proximity for the production of knowledge has contributed to the formation of teaching methods that use information technologies to sustain learning in education systems (Shahroom & Hussin, 2018). In this sense, Web 2.0 technology is thought to play an important role in meeting today’s educational needs.
Web 2.0
Web 2.0 was first coined by DiNucci (1999). The expression of the concept in its current form emerged as a result of a brainstorming session at an international conference organized by O’Reilly and MediaLive (O’Reilly, 2007). The concept of Web 2.0 is used to refer to the second generation of the World Wide Web (www). Web 2.0 is an internet environment that allows users to interact (Mai et al., 2014). In Web 2.0, information is generated and shared by users (Franklin & Harmelen, 2007). In this context, with Web 2.0, users are no longer consumers but free creators and producers. (Aretio, 2007). Therefore, Web 2.0 has a dynamic structure (King, 2011; O’Reilly, 2007). Judd et al. (2010) define Web 2.0 as allowing users to create, publish and share digital content on both new and existing social networks. With the “social” technological tools of Web 2.0, users have created a participatory culture by creating content in areas such as blogs, wikis, and video sharing sites (Fahser-Herro & Steinkuehler, 2009). Thanks to Web 2.0, users can create new forms of literacy by generating knowledge; they have the ability to control their online experiences and influence the experiences of others (Lage, 2014).
Web 2.0 enables a blended learning environment between physical and digital classroom environments according to the principles of collaboration and participation (Drexler et al., 2008; Greenhow et al., 2009). Since it is thought that meaningful learning is possible with the active participation of students (Hanley, 2005), Web 2.0 tools help students to learn meaningfully. In addition, Web 2.0 tools facilitate learning by helping to gamify the teaching environment (Cairncross, 2014). Web 2.0 technologies provide environments where users can create/preparation of new environments, participate in these environments, produce and edit content (Anastasiades & Kotsidis, 2013).
Instead of static websites, Web 2.0 offers interactive computing platforms where users can utilize user-generated content. In this way, users interact more with each other (Olaniran, 2009). The diverse features of Web 2.0 increase its importance for knowledge development and sharing, cultural exchange and networking (Attwell, 2007). Web 2.0, which we can refer to as the next generation Web, offers unique opportunities for users’ inquiry skills, collaboration, communication, and individual expression and literacy (Drexler et al., 2008).
Web 2.0 in Education and Social Studies
Geographical distances can now be overcome through information sharing and collaboration (Mai et al., 2014). The increase in the number of students using online learning environments (Allan & Seaman, 2013) has led to the need for renewal in education. Traditional teaching methods do not meet the expectations of students, and developments in information and communication technologies bring interactive and participatory learning environments instead of the rigid teacher-student model (Pieri & Diamantini, 2014). In this context, educators should adapt to developing technologies (Creighton, 2018; Faizi, 2018; Natriello, 2005) and support students’ ability to evaluate, criticise, and effectively transfer knowledge (Jouneau-Sion & Sanchez, 2013).
Web 2.0 tools encourage critical thinking by integrating students’ digital habits into educational processes (King, 2011) and make learning processes more engaging without distraction (Haleem et al., 2022). These tools provide accessible and interactive platforms that support knowledge acquisition and sharing (Albion, 2008; McLoughlin & Alam, 2014) and are compatible with constructivist pedagogical approaches such as project-based, collaborative learning (Kale & Goh, 2014). Web 2.0 integration in education enables students to learn through experience (Dede, 2008; Heafner & Friedman, 2008), increases student satisfaction (Ajjan & Hartshorne, 2008), encourages collaboration (El Mhouti et al., 2017; Lage, 2014), and increases academic achievement (Malhiwsky, 2010). It also supports the development of higher-order skills such as problem solving and conceptual understanding (Haleem et al., 2022; Leask, 2011).
Today’s students prefer independent, technology-supported learning processes as digital natives (Sarkar et al., 2017). Digital tools help students to create their own learning materials, realise their misconceptions, and use their knowledge in different contexts by increasing their academic achievement (Feyzioğlu et al., 2018). Rapidly developing technology transforms educational understandings, especially in the field of social studies education (Farisi, 2016).
National Council for the Social Studies (1994) emphasises that technology plays a critical role for a holistic understanding of education in social studies courses. Technology is an important tool for developing both content knowledge and process skills (Berson & Balyta, 2004). Social studies education requires students to construct and actively use knowledge (Gürbüzer et al., 2022). Current research reveals that social studies teaching should be enriched with technology (Cuenca et al., 2018). While these technologies develop skills such as problem solving, understanding historical context and cultural awareness (Nebel et al., 2009), they also enrich the learning experience through interaction and collaboration (Chou et al., 2015; Livingstone, 2015).
The future of Social Studies and the ability of students to become global citizens require the integration of technology into the Social Studies curriculum (Holcomb et al., 2009). The Social Studies course, which presents students with multiple abstract topics and concepts, helps ensure the lasting learning of these outcomes by providing real-life experiences through technological tools (Kantekin, 2023). Since Social Studies is a course that trains citizens, it should prepare individuals equipped with up-to-date technological knowledge by keeping up with technological developments and adapting to the conditions of the day. To achieve this, sufficient use should be made of the technological tools brought by the age during the course process.
Social Studies, with its connection to various disciplines, brings alternative teaching methods and Web 2.0 tools-digital technologies of the 21st century-that spark the interest of students in the digital age (Solomon & Schrum, 2007). Today, over 100 Web 2.0 tools are continuously being added. The diversity and interconnection of the various disciplines within Social Studies resembles the variety of Web 2.0 tools. This diversity of Web 2.0 tools offers applications that can be easily applied to the achievements of Social Studies at every grade level (Kulaca, 2023).
It has been observed that Web 2.0 tools in Social Studies classes enrich the learning environment, make learning easier, encourage students to engage with learning, increase the retention of knowledge, enhance academic achievement, contribute to the development of students’ attitudes and motivation toward the subject, support collaborative learning environments, and (Almalı & Yeşiltaş, 2020; Avcu, 2024; Bucak, 2024; Holcomb & Beal, 2010; Huang et al., 2013; Kantekin, 2023; Mert, 2023; Ocak, 2022; Özcan, 2024; Özmen, 2024; Sevigen; 2022; Yiğit, 2023; Yılmaz, 2022) positively contribute to the development of critical thinking, problem-solving, and communication skills (Chai & Kong, 2017, cited in Çelik, 2020).
Metacognition and Metacognitive Awareness
Metacognition and metacognitive awareness are important concepts that express an individual’s ability to control and monitor cognitive processes. Nelson and Narens (1994) defined metacognition as a bridge between memory, decision-making, motivation, and learning. This concept, which was first used by John Flavell (Nazarieh, 2016), was explained as having sufficient knowledge about one’s own cognitive processes (Flavell, 1976; as cited in R. Gibson, 1996). Similarly, Swiderek (1996) defined metacognition as the individual’s thinking of his/her own thoughts, while Schraw and Dennison (1994) considered it as awareness and control skills towards the learning structure. In general, metacognition enables individuals to acquire knowledge and remember concepts (Körükcü, 2020) and is a critical skill for successful learning. It allows to better manage cognitive skills and develop new skills by identifying deficiencies (Schraw, 1998). Learning-oriented students tend to have higher metacognitive skills and be more successful learners compared to performance-oriented students (Coutinho, 2007).
Metacognitive awareness is the awareness of how an individual thinks. Asking questions such as “How do I work best?” or “Which tools support my learning?” increases this awareness (Jaleel, 2016). Individuals with high metacognitive awareness can evaluate learning processes correctly and plan them effectively (Kuru & Çakmak, 2022). At this point, the role of technology is also important. Web 2.0 technologies are a dynamic teaching tool that supports information literacy based on metacognitive activities (King, 2011) and can provide deep learning (Bull et al., 2008).
Meyer et al. (2010) state that the use of technological tools increases students’ metacognitive skills and academic achievement, while Hamilton et al. (2022) emphasise that students with high metacognition levels have positive effects on learning outcomes. Web 2.0 tools can increase metacognitive skills by improving critical understanding (Adcock & Bolick, 2011) and contribute to the acquisition of thinking skills (Gul & Shehzad, 2012). Technology-supported learning environments can increase students’ metacognitive levels and increase their academic achievement (Amin et al., 2020; Feyzioğlu et al., 2018). This is particularly important for multidisciplinary subjects like Social Studies. In Social Studies, which encompasses multiple disciplines, metacognitive skills allow students to organize information related to different disciplines, establish connections, and evaluate it from various perspectives. It enables students to approach topics such as history, geography, and economics with a critical perspective, allowing them to make more informed and open-minded decisions. In this regard, the aim of this study is to determine how the use of Web 2.0 tools in Social Studies education affects middle school students’ metacognitive awareness levels and academic achievement. Additionally, the study aims to explore the impact of Web 2.0 tools on middle school students’ metacognitive awareness and academic achievement, as well as their views on the use of Web 2.0 tools in the classroom.
In line with this purpose, answers to the following sub-problems were sought:
Is there a statistically significant difference between the mean metacognitive awareness scores of the experimental group students before and after the use of Web 2.0 tools in the social studies course?
Is there a statistically significant difference between the mean academic achievement test scores of the experimental group students before and after the use of Web 2.0 tools in the social studies course?
Is there a statistically significant difference between the posttest mean scores of metacognitive awareness and academic achievement test mean scores of the experimental group students according to gender variable?
Is there a statistically significant difference between the post-test mean scores of metacognitive awareness and academic achievement test mean scores according to the daily internet usage frequency of the experimental group students?
Is there a statistically significant relationship between the academic achievement test scores and metacognitive awareness scores of the experimental group students?
Is there a statistically significant difference between the metacognitive awareness posttest scores of the experimental and control groups?
Is there a statistically significant difference between the academic achievement posttest scores of the experimental and control groups?
What are the views of middle school students on the use of Web 2.0 tools in social studies course?
How can the relationships between the use of Web 2.0 tools, metacognitive awareness, academic achievement, and other related factors be explained in line with the purpose of the research?
Method
Research Model
In this study, which aims to reveal how the use of Web 2.0 tools in Social Studies teaching affects students’ metacognitive awareness levels and academic achievement, mixed method was used. The main purpose of using mixed methods is to provide better explanations by using quantitative and qualitative methods together in solving the problem (Creswell, 2012). Both qualitative and quantitative methods provide different types of data and access different aspects of the phenomenon being studied; thus, by integrating qualitative and quantitative findings, the scope, depth, detail, and even validity of the study are enhanced (Morse & Maddox, 2014). In studies using this method, quantitative and qualitative data collection techniques are used either simultaneously or one following the other (Balcı, 2018). It is also a type of method that offers the researcher more than one perspective when approaching a problem and aims to reveal more evidence than quantitative and qualitative approaches alone (Creswell & Plano-Clark, 2007).
In this direction, “Explanatory Design,” one of the mixed method designs, was used in the study. In the first phase of the research, quantitative data were collected and analyzed; in the second phase, qualitative data were collected and analyzed to support the data obtained in the quantitative research process. In the quantitative dimension of the study, a quasi-experimental design with pretest-posttest control group was used. In the qualitative dimension of the study, basic qualitative research method was used to explain the quantitative data. In this study, a mixed-methods approach was used because the aim was to examine the impact of Web 2.0 tools on middle school students’ metacognitive awareness and academic achievement not only through numerical data but also based on students’ experiences and opinions, providing a more comprehensive analysis.
Study Group
The study group of the research was randomly assigned as an experimental group and a control group from the sixth-grade classes of a middle school affiliated with the Ministry of National Education in Turkey during the 2020 to 2021 academic year, with similar student numbers and achievement levels. The experimental group consists of a total of 21 students, with 8 females and 13 males, while the control group is comprised of 21 students, with 11 females and 10 males. Convenient sampling method was used to determine the study group in terms of easy accessibility.
Data Collection Tool
In order to collect the quantitative data of this study, the “Metacognitive Awareness Scale” developed by Karakelle and Saraç (2007) and the “Academic Achievement Test” consisting of questions related to the “People, Places and Environments Learning Area” of the sixth grade, which was developed by the researcher, prepared by taking expert opinions and tested for validity, were used. In order to collect the qualitative data of the study, the semi-structured “Interview Form on the Use of Web 2.0 Tools in Social Studies Education,” which was prepared by the researcher by taking expert opinions, was used to determine the opinions of the students participating in the study on the use of Web 2.0 tools in social studies education.
Data Collection Process
As a result of the COVID-19 pandemic affecting the whole world and Turkey being negatively affected by this situation, education continued online for a while. With the introduction of face-to-face education, a number of measures have continued. For this reason, the study was limited to include only sixth grade middle school students and the data required to be obtained within the scope of the research were collected online via Google form, not face-to-face.
Application Process
Before starting the study, the metacognitive awareness scale and the academic achievement test were delivered to the students in the study group via Google Form and the application process started after all of the students completed the measurement tools. Within the scope of the study, the students in the experimental group were given an online course consisting of 3 class hours per week for 8 weeks. The content of these lessons was prepared by the researchers using Web 2.0 tools. In the control group, the same acquisitions were taught in the same period of time with traditional narration from the textbook. Both groups were taught by the researcher, who was a social studies teacher (first author) at the school where the study was conducted. Within the scope of the study, the courses were conducted as online courses for both groups through distance education via Zoom application. Before the lesson, a link was sent to the students, and they clicked on the link and participated in the lesson online. At the end of the application process, the students in the study group were asked to fill in the metacognitive awareness scale and the academic achievement test with Google Form.
Teaching the Lessons in the Experimental Group
During the lesson, mind and concept maps prepared by the researcher were sent as links to the students via Coggle and Mindmeister applications. Students clicked on the link and examined the concept and mind maps and tried to have information about the content of the subject they would learn that day. For example, students have been provided with the opportunity to observe elements such as vegetation, climates, and factors affecting climate within the scope of physical geography. After the mind and concept maps were shown and analyzed by the students, presentations were made to the students through Prezi, Office Sway, and Mozaweb applications. During the presentation, the researcher stopped at certain points within the scope of the relevant subject and sent the students the link to the activity prepared on the Wordwall platform related to the content of the lesson s/he was teaching at that moment. Students clicked on the link and completed the activity related to the part of the lesson content they had learned so far that day. Then, the teaching of the lesson continued again and the link to the Wordwall activity was sent to the students within the scope of the subject and it was tried to ensure the active participation of the students in the lesson. For example, after the topic of tourism was covered, a Wordwall activity related to tourism was sent to the students. When the relevant learning outcome was completed, the researcher sent the test prepared on the Quizizz platform to the students as a link and the live tests were solved by the students participating in the study. Throughout the lessons, students were given the opportunity to re-answer questions where they made mistakes through Wordwall and Quizizz platforms. For example, students who completed the activity on the Wordwall platform and did not get full points were able to complete the activity again and get full points. The use of Web 2.0 tools during the application process, along with the corresponding learning outcomes, is shown in Table 1.
Application Process of Social Studies Education With Web 2.0 Tools.

Data Collection Tools
Metacognitive Awareness Scale adapted by Karakelle and Saraç (2007, p. 96) to collect the quantitative data of this study and the “Academic Achievement Test” consisting of questions related to the sixth grade “People, Places and Environments Learning Area,” which was developed and validity and reliability proofs were obtained by the researchers, was used.
Metacognitive Awareness Scale
The scale adapted by Karakelle and Saraç (2007) aims to measure the metacognitive skills of children aged 9 to 15 years. The scale consists of two forms, A and B, for use in different age groups. Form A, consisting of 12 items and developed for the 9 to 11 age group, is marked on a three-point Likert-type scale (always, sometimes, never) for each item; Form B, consisting of 18 items and developed for the 12 to 15 age group, is marked on a five-point Likert-type scale (never, rarely, sometimes, often, always) for each item. A high total score obtained from the scale indicates a high level of metacognitive skills. In the adaptation study, Principal Component Analysis was performed to determine the factor structure of Form A and to obtain validity evidence, and factor loadings between 0.43 and 0.76 were obtained. As a result of the analysis, it was determined that Form A consisted of a 4-factor structure. In this structure, factor 1 includes the features of regulation of cognition related to supervision, factor 3 includes the features of regulation of cognition related to monitoring, factor 2 consists of task-related features of cognition and factor 4 consists of awareness-related features of cognition. In order to determine the reliability of the scores obtained from Form A, Cronbach Alpha value was calculated and found to be .64. Similar to Form A, Principal Component Analysis was conducted for Form B to obtain validity evidence and factor loadings between 0.43 and 0.75 were obtained. As a result of the analysis, a 4-factor structure was obtained for Form B. In order to determine the reliability of the scores obtained from Form B, a test-retest was conducted approximately 3 weeks apart. The test-retest correlation value for Form B was found to be .72.
Academic Achievement Test
While preparing the questions for the Academic Achievement Test developed by the researchers within the scope of the scientific study, firstly, the achievements of the sixth grade learning area “People, Places and Environments,” the achievement tests published by the Ministry of National Education General Directorate of Measurement, Evaluation and Examination Services for the relevant grade level and unit within the scope of the study and the questions in the study fascicles were examined. After the examinations, the items were written according to the objectives and the revised Bloom’s taxonomy. The cognitive levels of the objectives in the test are presented in Table 2.
Examination of the Acquisitions in the Achievement Test According to YBT.

For the 4 objectives in the test, 25 items were written. The cognitive level of the written items is given in Table 3.
Examination of the Items in the Achievement Test According to YBT.

In order to obtain content validity evidence for the achievement test, the items were sent to 3 faculty members who are experts in the field of social studies, 1 language expert and 2 measurement experts; the experts were asked to evaluate the items as necessary, insufficient, and unnecessary. The content validity ratio was obtained by using the Lawshe technique with the opinions received from the experts. For 25 items, the content validity ratio was calculated as 1.00. Veneziano and Hooper (1997) stated that the minimum value should be 0.99 for 6 experts. Considering this value, it can be stated that sufficient evidence was obtained for content validity.
The academic achievement test was administered to a total of 232 sixth and seventh grade students. After the pilot application, the KR-20 reliability coefficient of the test was calculated to determine the reliability of the scores obtained from the test and found to be .85. Considering this value, it can be stated that reliability was achieved.
In order to collect the qualitative data of the study, a questionnaire consisting of open-ended questions prepared by the researchers based on expert opinions was used to determine the opinions of the students in the experimental group on the use of Web 2.0 tools in social studies education. The questionnaire was prepared by taking advantage of the relevant literature and the opinions of three faculty members who are experts in the field of social studies. This form includes questions aimed at determining the students’ opinions about the Web 2.0 tools used by the researcher during the training, their opinions about the effect on their learning situations, and their opinions about the effect on their interests and aspirations.
Data Analysis
When the research problems were examined; independent sample t-test was applied before the study for the experimental and control groups, which were formed to examine the use of Web 2.0 tools in the social studies course of middle school students and their metacognitive awareness scores and academic achievement, and it was concluded that there was no significant difference between the groups. In order to examine the effect of the use of Web 2.0 tools on the metacognitive awareness scores and academic achievement scores of sixth grade social studies students, a dependent groups t-test was applied to examine the pre-test and post-test scores of the experimental group. In addition, an independent sample t-test was applied to examine the difference between the experimental and control groups formed to examine the effect of the use of Web 2.0 tools on metacognitive awareness scores and academic achievement scores. Independent sample t-test was applied to examine whether metacognitive awareness scores and academic achievement scores differed according to the gender and daily internet usage hours of sixth grade social studies students. Post-test data of the experimental group were used to examine metacognitive awareness scores and academic achievement scores according to demographic variables. Pearson correlation analysis was used to examine the relationship between metacognitive awareness scores and academic achievement scores.
SPSS package program was used to evaluate the normality assumption and to carry out the analysis process. Descriptive statistics of metacognitive awareness scale and academic achievement test scores related to gender, daily internet use variables were presented and interpreted in tables (Table 4).
Descriptive and Normality Statistics of Pre- and Post-Test Scores in Experimental and Control Groups.
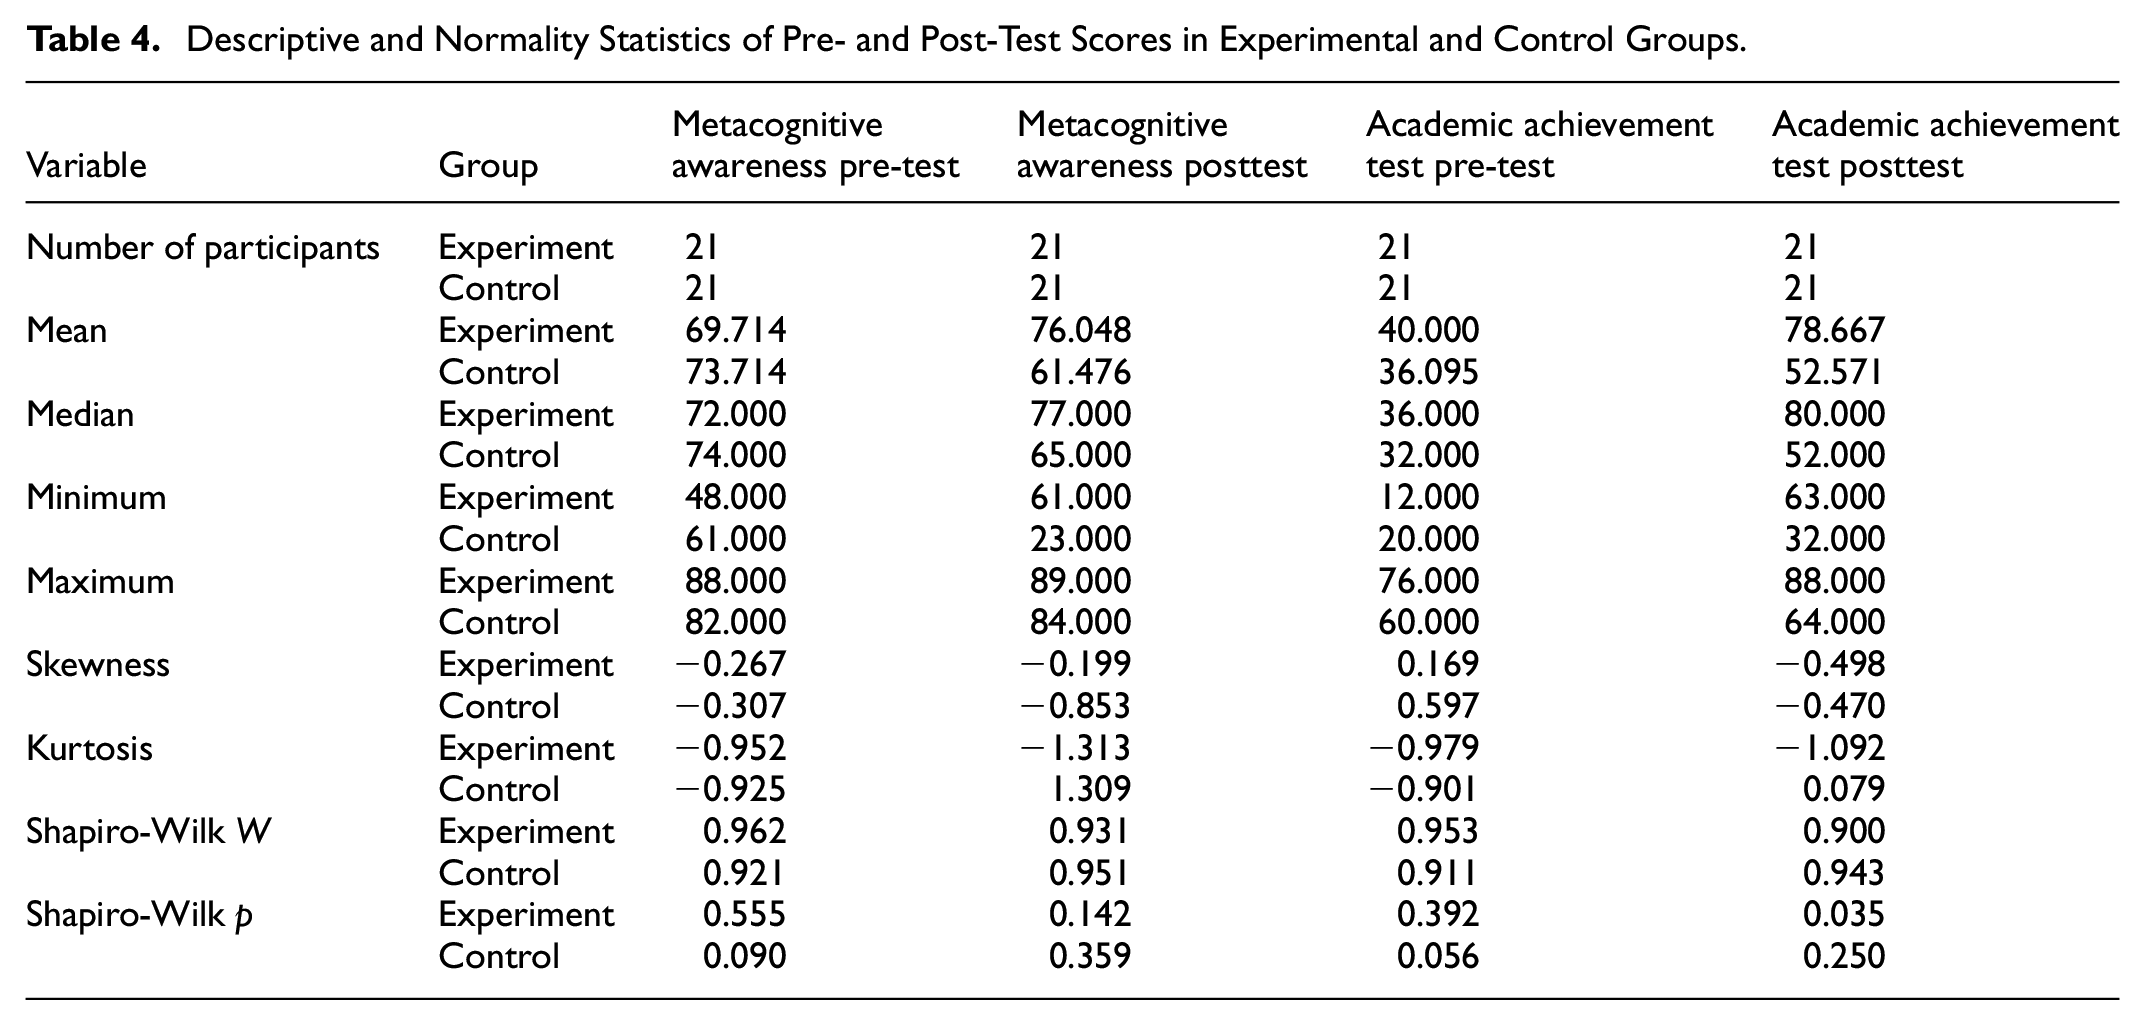
In order to evaluate the normality of the pre and post-test scores of the metacognitive awareness scale and the academic achievement test, the measures of central tendency of all groups were examined and found to be relatively close to each other. Skewness and kurtosis values in the range of −1 and +1 indicate that the distribution is close to normal (George & Mallery, 2020). When the skewness coefficients for both groups were analyzed, it was observed that all scores were within tolerance values. When the kurtosis values were examined, it was seen that there were values outside the tolerance values, but they were very close. If the skewness and kurtosis values show a distribution between +1.5 and −1.5, it can be said that the data show normal distribution characteristics (Tabachnick & Fidell, 2013). In addition, Shapiro-Wilk test was performed to examine whether the scores were normally distributed and normality was examined. As a result of the analysis, it was seen that normality was ensured in all scores except the post-test score of the experimental group academic achievement, p > .050. When all the evidence for the normality assumption is evaluated together, it can be said that the data show normal distribution characteristics; therefore, an independent sample t-test was conducted to determine whether there was a difference between the groups and a dependent sample t-test was conducted to determine whether there was a significant difference between the pre-test and post-test scores of the experimental group (Table 5).
Descriptive Statistics for Posttest Scores by Gender in Metacognitive Awareness and Academic Achievement Tests.
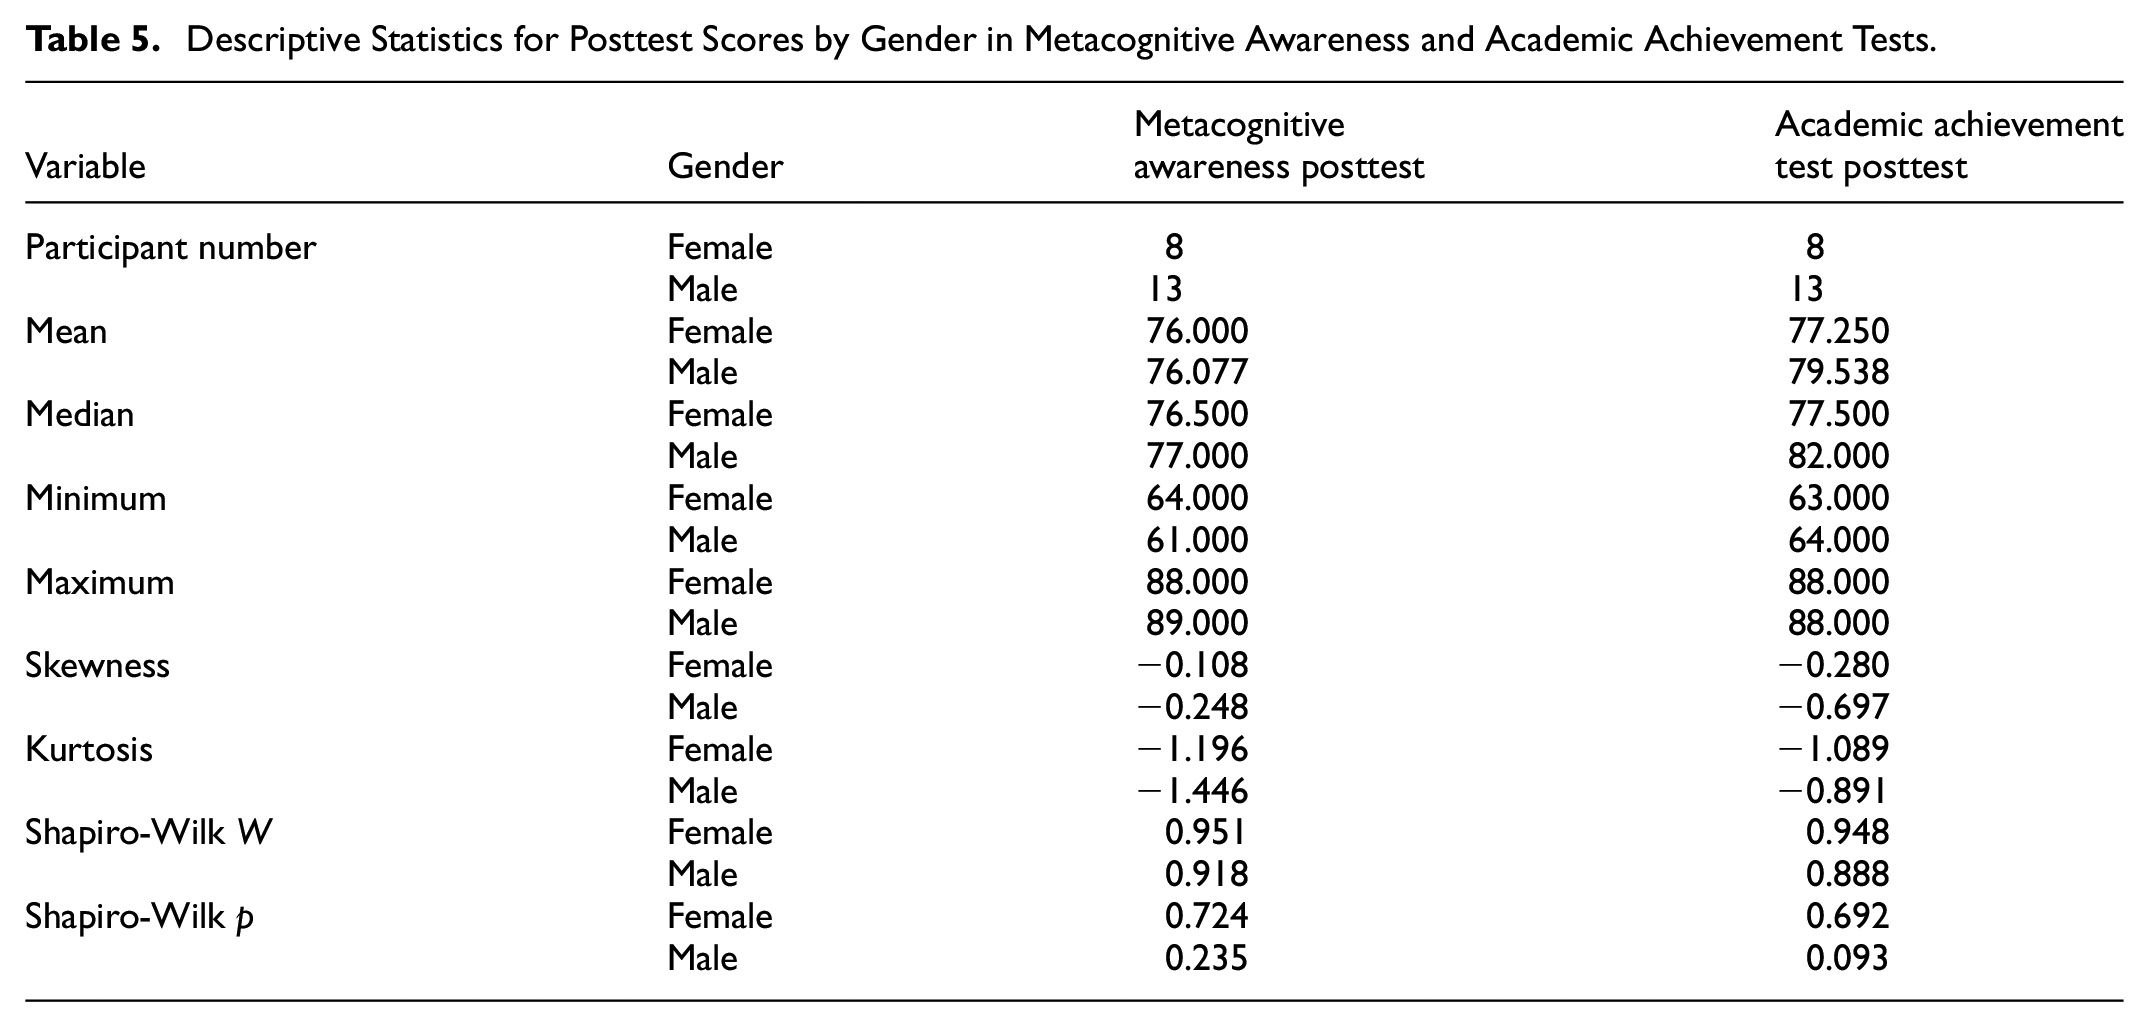
In order to evaluate the normality of the scores obtained from the metacognitive awareness scale and academic achievement test by gender, the measures of central tendency of all groups were examined and it was seen that they were relatively close to each other. When the skewness coefficients for both groups were analyzed, it was observed that all scores were within tolerance values. When the kurtosis values are examined, it is seen that there are values outside the tolerance values, but they are very close and in the range of −1.5 and +1.5. In addition, Shapiro-Wilk test was performed to examine whether the scores were normally distributed and normality was examined. As a result of the analysis, normality was observed in all scores, p > .050. When all the evidence for the normality assumption is evaluated together, it can be said that the data show normal distribution characteristics, so an independent sample t-test was conducted to determine whether there was a difference between the groups (Table 6).
Descriptive Statistics for Posttest Scores by Daily Internet Use in Metacognitive Awareness and Academic Achievement Tests.

In order to evaluate the normality of the scores obtained from the metacognitive awareness scale and the academic achievement test according to daily internet use, the measures of central tendency of all groups were examined and found to be relatively close to each other. When the skewness coefficients for both groups were analyzed, it was seen that all scores were within the tolerance values. When the kurtosis values were examined, it was seen that there were values outside the tolerance values but very close. In addition, Shapiro-Wilk test was performed to examine whether the scores were normally distributed and normality was examined. As a result of the analysis, it was seen that normality was achieved in all scores, p > .050. When all the evidence for the normality assumption is evaluated together, it can be said that the data show normal distribution characteristics, so an independent sample t-test was conducted to determine whether there was a difference between the groups (Table 7).
Independent Samples t-Test Results for Pretest Scores in Metacognitive Awareness Between Experimental and Control Groups.

Independent samples t-test was applied to prove that the experimental and control groups formed to compare the metacognitive awareness levels of sixth grade middle school students were selected unbiasedly. When the metacognitive awareness test scores were analyzed, no statistically significant difference was found between the groups. t(32.478) = 1.384. p > .05 (Table 8).
Independent Samples t-Test Results for Pretest Scores in Academic Achievement Between Experimental and Control Groups.

In order to prove that the experimental and control groups formed to compare the academic achievement test scores of sixth grade middle school students were selected unbiasedly, an independent samples t-test was applied. When the academic achievement test scores were analyzed, no statistically significant difference was found between the groups. t(40) = −0.779. p > .05.
Within the scope of the last sub-problem of the study, the qualitative data obtained as a result of the application of the “Using Web 2.0 Tools in Social Studies Education Interview Form” for sixth grade students after the training given using Web 2.0 tools were transferred to MAXQDA 2020 Plus qualitative data analysis program and analyzed by descriptive analysis method. Such software provides researchers with a systematic approach to working with large amounts of qualitative data, making comparisons between categories, and extracting themes from the data (Woods et al., 2016).
Findings
Findings on the Analysis of Quantitative Data
Findings Related to the Metacognitive Awareness Scores of the Experimental Group Students Before and After the Use of Web 2.0 Tools in the Social Studies Course
Dependent groups t-test was applied to compare the metacognitive awareness levels of sixth grade middle school students before and after the study. When the metacognitive awareness test scores were examined, a significant difference was found in favor of the post-test scores. t(20) = −2.113. p < .05. While the average metacognitive awareness test scores of the students before the study, the average metacognitive awareness test post-test scores increased to (Table 9).
Dependent Groups t-Test Related to Metacognitive Awareness Scale After Using Web 2.0 Tools.

Findings Related to the Mean Academic Achievement Test Scores of the Experimental Group Students Before and After the Use of Web 2.0 Tools in the Social Studies Course
Dependent groups t-test was applied to compare the academic achievement levels of sixth grade middle school students before and after the study. When the academic achievement test scores were examined, a significant difference was found in favor of the post-test scores. t(20) = −9.914. p < .05. While the average of the students’ academic achievement test scores before the study, the average of the post-test scores of the metacognitive awareness test increased to (Table 10).
Dependent Groups t-Test for Academic Achievement Pre-Test and Post-Test Scores.

Findings Related to the Post-Test Mean Scores of Metacognitive Awareness and Academic Achievement Test Mean Scores of Experimental Group Students According to Gender Variable
When Levene’s test for homogeneity of variances was performed for the metacognitive awareness scale (p value = .543 > .05), it was seen that the variances were homogeneous. As a result of the independent sample t-test, t(19) = 0.018. p > α = .05, the total score of the metacognitive awareness scale does not show a statistically significant difference according to gender (Table 11).
Independent Samples t-Test Results for Posttest Scores by Gender in Metacognitive Awareness and Academic Achievement.
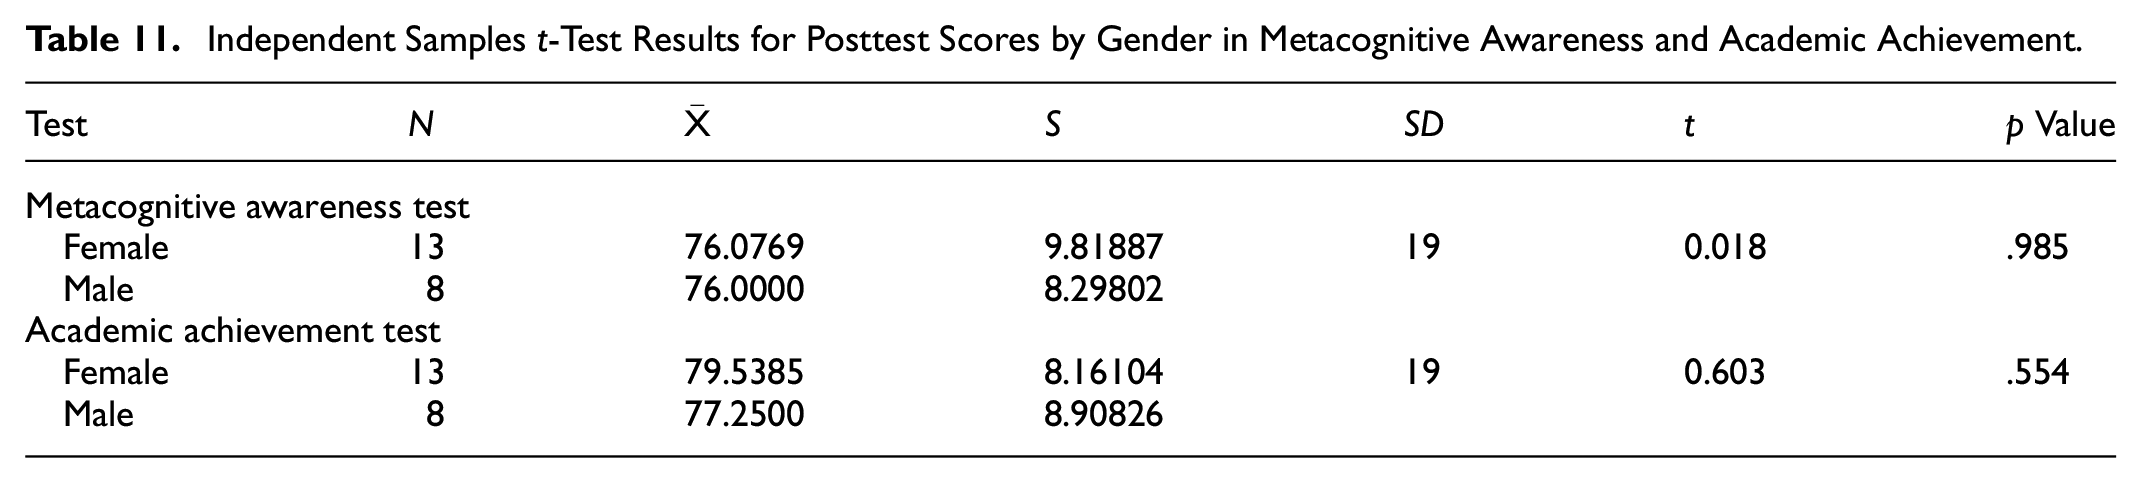
When Levene’s test for homogeneity of variances was performed for the academic achievement test (p value = .841 > .05), it was seen that the variances were homogeneous. As a result of the independent sample t-test, t(19) = 0.603. p > α = .05, the total score of the academic achievement test does not show a statistically significant difference according to gender.
Findings Related to Metacognitive Awareness Posttest Mean Scores and Academic Achievement Test Mean Scores of Experimental Group Students According to Their Daily Internet Usage Frequency
When Levene’s test for homogeneity of variances was performed for the metacognitive awareness scale (p value = .813 > .05), it was seen that the variances were homogeneous. As a result of the independent sample t-test, t(19) = 1.552. p > α = .05, the total score of the metacognitive awareness scale does not show a statistically significant difference according to internet use during the day (Table 12).
Independent Samples t-Test Results for Posttest Scores by Daily Internet Use Duration in Metacognitive Awareness and Academic Achievement.

When Levene’s test for homogeneity of variances was performed for the academic achievement test (p value = .077 > .05), it was seen that the variances were homogeneous. As a result of the independent sample t-test, t(19) = 1.222. p > α = .05, the total score of the academic achievement test does not show a statistically significant difference according to internet use during the day.
Findings on the Relationship Between Metacognitive Awareness Scores of Experimental Group Students and Academic Achievement Test Scores
As a result of the Pearson correlation test, a moderate significant relationship was found between the total scores of the metacognitive awareness scale and the total scores of the academic achievement test (p < .05; r = .547). The correlation coefficient varies between ±1 and the relationship decrease as the correlation coefficient approaches 0. Values between .30 and .70 are correlations of moderate strength. Therefore, the correlation between metacognitive awareness scale and academic achievement test is of medium strength (Köklü et al., 2007) (Table 13).
Pearson Correlation Between Posttest Scores of Metacognitive Awareness and Academic Achievement in the Experimental Group.

p < .05.
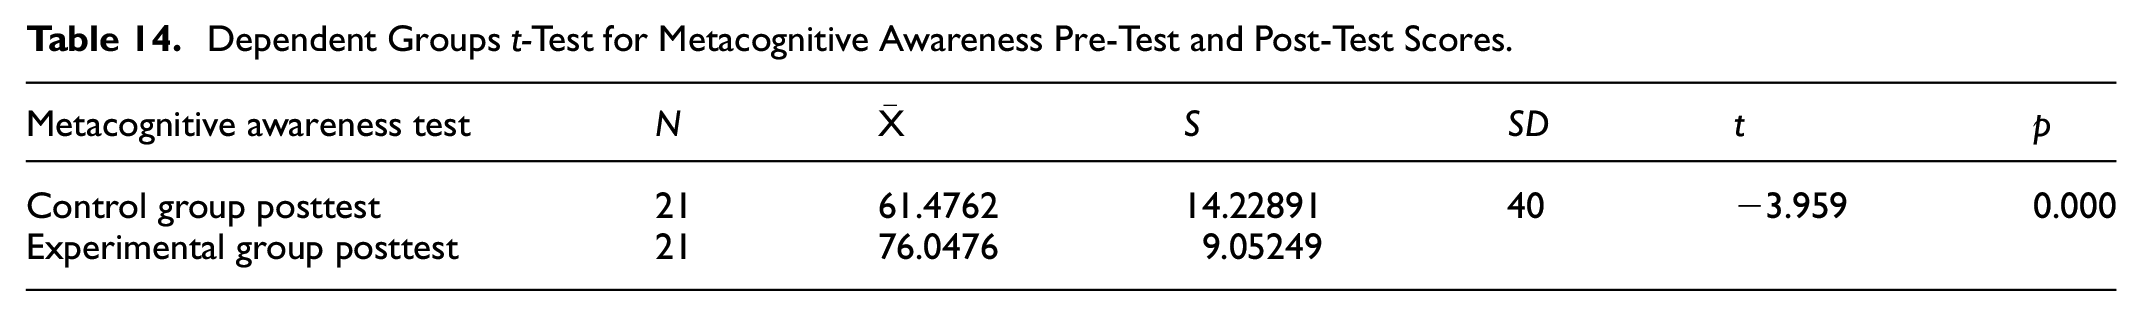
Findings Related to the Comparison of Metacognitive Awareness Posttest Scores of the Experimental and Control Groups
Dependent groups t-test was applied in order to compare the scores of the experimental and control groups of sixth grade middle school students’ metacognitive awareness levels. When the metacognitive awareness test scores were examined, a significant difference was found in favor of the experimental group test scores. t(40) = −3.959. p < .05. While the average of the metacognitive awareness test scores of the experimental group was the average of the metacognitive awareness test scores of the control group (Table 14).
Dependent Groups t-Test for Metacognitive Awareness Pre-Test and Post-Test Scores.
Findings Related to the Comparison of Academic Achievement Post-Test Scores of the Experimental and Control Groups
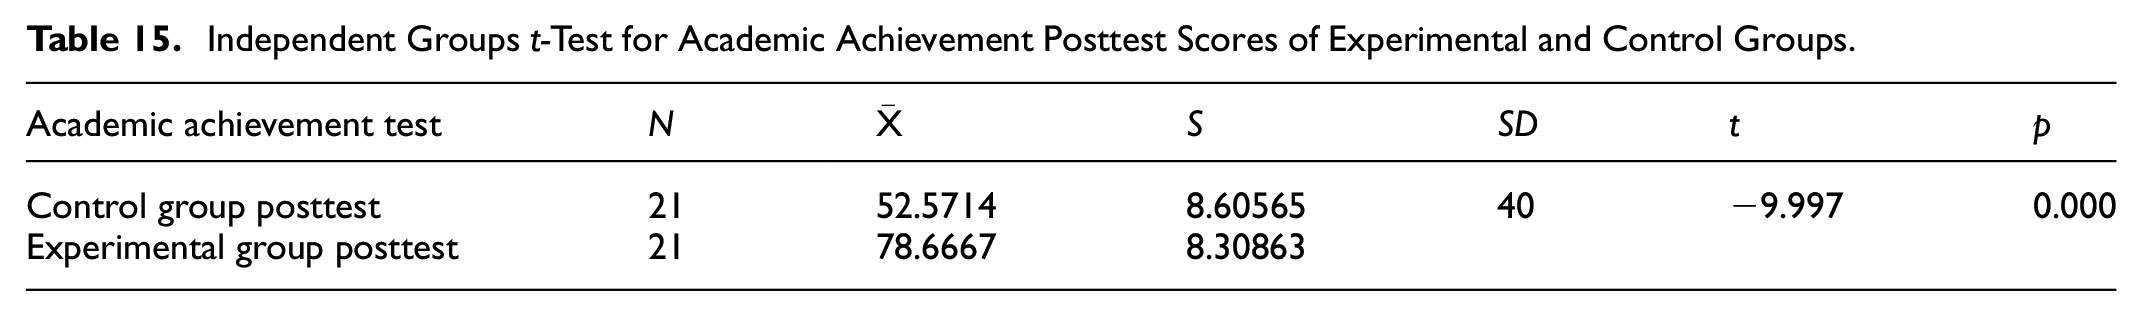
Dependent groups t-test was applied in order to compare the academic achievement levels of sixth grade middle school students in the experimental and control groups. When the academic achievement test scores were examined, a significant difference was found in favor of the test scores of the experimental group. t(40) = −9.997. p < .05. While the average of the academic achievement test scores of the experimental group was the average of the academic achievement test scores of the control group (Table 15).
Independent Groups t-Test for Academic Achievement Posttest Scores of Experimental and Control Groups.
Findings on the Analysis of Qualitative Data
Findings Related to Middle School Students’ Opinions on the Use of Web 2.0 Tools in the Education Process
When Figure 1 is examined, it is possible to say that the middle school students who participated in the study frequently found Web 2.0 tools “very useful (11).” In addition, it is seen that the students stated that Web 2.0 tools are “supportive in learning the subject (8),” “entertaining in the teaching of the lesson (6),” “reinforcing learning (5),” and “pleasing (2).” When the findings are evaluated in general, it can be said that 24 of the students in the study group used positive expressions about Web 2.0 tools, while 1 student did not express any opinion. Some of the answers given by the students participating in the study are as follows:
I think the tools our teacher uses in education are good for me and my friends. Because it supports us to understand better and helps us learn the subject. F2 Personally, I like learning and acquiring new knowledge. But the learning phase can sometimes be boring. Such question applications make learning both easier and more fun. I think such quiz platforms should be used in every course. F10 These applications are very fun and efficient. I am very happy doing these tests. M5

Model for the “Students’ Opinions on the Use of Web 2.0 Tools in the Education Process” category with MaxMaps.
Findings Related to Middle School Students’ Opinions on the Effect of Web 2.0 Tools Used in the Social Studies Course on Learning Processes
When the opinions of middle school students regarding the impact of Web 2.0 tools used in social studies lessons on their learning processes were examined, it was observed that 24 of them answered “positively affected,” while 1 student stated “did not affect.” The answers given by the students who stated that Web 2.0 tools contributed positively to their learning processes are given in Figure 2.

Model for the “Students’ Opinions on the Impact of Web 2.0 Tools Used in Social Studies Course on Their Learning Processes” category with MaxMaps.
When Figure 2 is examined, it is seen that middle school students frequently expressed the use of Web 2.0 tools in the social studies course as “it was reinforcing (7)” and “it made learning easier (7).” In addition, middle school students stated that Web 2.0 tools “increased motivation (4),” “Increased memorability (2),” “made me realize mistakes (2),” “broke my prejudices (1),” and “increased my success (1)” in relation to the effects of Web 2.0 tools on learning processes in the course. When the findings in the table are evaluated in general, it is possible to interpret that Web 2.0 tools reinforced and facilitated the subjects in the social studies course and increased their motivation towards the course. Some of the answers given by the students participating in the study are as follows:
This unit of the social studies course seemed to challenge me a lot. The fact that my teacher created such a lesson broke my prejudice against the social studies course. The topics became a fun learning level for me, not a challenge. F10 It was different from normal lessons. It was good for me to reinforce the subject. M2 It affected me. It helped me a lot to reinforce it. F11
Findings Related to Middle School Students’ Views on the Contribution of Using Web 2.0 Tools in Out-of-School Environments to Learning Processes
When the opinions of middle school students on the use of Web 2.0 tools in out-of-school environments were examined, it was seen that 18 of the students answered “yes, I used it” and 7 of them answered “no, I did not use it.” The opinions of students who used Web 2.0 tools on how they contributed to their learning are given in Figure 3.

Model for the “Contributions of Using Web 2.0 Tools in Out-of-School Environments to Students’ Learning Processes” category with MaxMaps.
When Figure 3 is examined, it is seen that students who use Web 2.0 tools in out-of-school environments frequently stated that “it made learning easy (6)” and “it created a fun learning environment (6).” In addition, students stated that “it helped me to reinforce the subjects (3),” “it helped me to focus on the lessons (2),” and “it helped me to realize my shortcomings (1).” When the findings in the table are evaluated in general, it is possible to interpret that students who use Web 2.0 tools outside of school have a facilitating effect on their learning and make learning fun. Some of the answers given by the students participating in the study are as follows:
I used it for my exams. It contributed a lot to my learning. F4 Yes, I have used them. Thanks to these applications, I understood the topics I didn’t understand or couldn’t reinforce. M6 Yes, I used it and I focused more on all my lessons and studied more. F14
Findings Related to Middle School Students’ Opinions on Whether Web 2.0 Tools Used in the Social Studies Course Increase Their Interest and Willingness for the Course
When the opinions of middle school students on whether Web 2.0 tools increased their interest and desire for the social studies course were analyzed, it was seen that 23 of the students answered “yes, it did” and 2 students answered “no, it did not.” The opinions of the students who stated that Web 2.0 tools used in the social studies course increased their interest in the course are given in Figure 4.

Model for the “Students’ Opinions of the Web 2.0 Tools Used in the Social Studies Course Increasing Their Interest and Willingness for the Course” category with MaxMaps.
When Figure 4 is examined, it is seen that the students frequently gave the opinion that “It made easier the learning of the subjects (11)” increased their interest and desire. In addition, students stated that Web 2.0 tools increased their interest and enthusiasm for the course because “it has various applications (6),” “it has an attractive design (4),” and “it is technological (2).” When the findings in the table are evaluated in general, it is possible to interpret that students’ interest and enthusiasm for the course increased thanks to Web 2.0 tools. Some of the answers given by the students participating in the study are as follows:
Yes, these tools made it easier for me to understand the subject better. F15 It increased. Because I didn’t like to learn from books etc. M7 Yes, it increased my interest and desire for the lesson. Because I liked the lesson more with the tools we used. F2
Findings Related to Middle School Students’ Opinions on the Use of Web 2.0 Tools in Different Courses
When the opinions of middle school students about the use of Web 2.0 tools in different courses were taken, it was seen that 24 of the students answered “yes, I would like to” and 1 student answered, “I don’t know.”Figure 5 shows the opinions of the students who would like Web 2.0 tools used in the social studies course to be used in different courses and how they would affect their learning in such a case.

Model for the “Students’ Opinions on the Use of Web 2.0 Tools in Different Courses” category with MaxMaps.
When Figure 5 is examined, it is seen that students frequently stated that if Web 2.0 tools were used in different courses, “my interest in that course would increase (11).” Additionally, students used phrases like “it would make learning easier (5),” “the class would become enjoyable (3),” “it would increase my motivation (2),” “it would reinforce the subjects (2),” “it would raise my curiosity (2),” and “it would enhance my love for the class (1).” When the findings in the table are generally evaluated, it is possible to say that using Web 2.0 tools in classes will increase students’ interest in that class. Some of the answers given by the students participating in the study are as follows:
Of course, I would want it to be used because it would help us understand better in other lessons like social studies. As for my thoughts about that lesson, I would like that lesson even more. F2 Of course, I would like to. These platforms contribute a lot to learning. If our teachers used these applications in other lessons, the learning phase would be easier. F10 I would like it to be. If it was used, I would gladly take that course. My opinion about that course would change and I would always be curious about that course. M5
Findings on the Relationships Between the Use of Web 2.0 Tools, Metacognitive Awareness, Academic Achievement, and Other Related Factors
When Figure 6 is examined, it is possible to observe the interconnected effects of Web 2.0 tools on key elements of the learning process, as identified in the study. Web 2.0 tools are shown to enhance “metacognitive awareness” by allowing students to better plan, monitor, and evaluate their own learning processes. Similarly, these tools are perceived as increasing “interest in the lesson” through their interactive and innovative nature, which in turn fosters greater “motivation” among students.

Model Showing the Effects of Web 2.0 Tools on Metacognitive Awareness, Academic Achievement, Course Interest, Motivation, Reinforcement of Learning and Retention.
The model demonstrates that “motivation” plays a pivotal role in promoting “academic achievement” by encouraging students to set goals and persist in achieving them. Additionally, the diagram highlights the reinforcement of learning (repetition and consolidation) and the long-term retention of knowledge (retention), which are direct outcomes of increased interest and motivation.
Conclusion and Discussion
The results of this study showed that the use of Web 2.0 tools in the social studies course positively increased the metacognitive awareness levels of sixth grade middle school students compared to the course taught in traditional ways. This result is in line with the findings of studies showing that the use of Web 2.0 tools in course learning increases (Kalemkuş & Bulut-Özek, 2022; King, 2011; Luckin et al., 2009; McLoughlin & Alam, 2014; Ramadhana et al., 2022; Tan et al., 2010; Zeidan et al., 2017) students’ metacognitive awareness levels. Unlike traditional education, a classroom environment where Web 2.0 tools are effectively used contributes to the development of collaboration, communication, problem-solving, critical thinking, and metacognitive thinking skills (L. A. Gibson & Sodeman, 2014; Kaya, 2008; Öztürk & Eren, 2020; Webb, 2005).
In the applications conducted in this study, Prezi, Mozaweb, Quizizz, Wordwall, Google Earth, Mindmeister, Microsoft Sway, and Coggle Web 2.0 tools were used. Looking at the use of the Web 2.0 tools used in this study in the literature, it can be said that Prezi has been effective in improving students’ critical thinking skills and conceptual knowledge (Restuti et al., 2021), has developed students’ critical thinking skills and conceptual understanding (Santiwi et al., 2022), has improved student learning outcomes (Pratama & Setyasto, 2024), and has been effective in enhancing students’ problem-solving skills (Saputri & Umamah, 2023). Quizizz serves as a versatile tool to reinforce learning objectives and promote critical thinking skills (Amiro, 2023), can increase student motivation, make learning more enjoyable (Kartini & Sriyanto, 2023; Ningtyas & Syaodih, 2021), and can develop students’ critical thinking skills (Junior, 2020; Nashar et al., 2021). Wordwall, a digital learning tool, improves the quality of learning and enhances learning outcomes (Sufraini et al., 2024) and increases students’ learning interest in Social Studies (Ramadhani et al., 2023). Google Earth, in addition to enhancing students’ spatial thinking, also develops critical technology and thinking skills (Diab & Awada, 2016; Karatepe, 2012). Mindmeister, a digital mind mapping tool, allows students to reinforce acquired knowledge, develop practical application skills, and promote the development of critical thinking (Panyukova, 2020). Microsoft Sway helps students learn problem-solving by understanding the material on scales and plans (Febrinasti et al., 2021). The use of Coggle (mind mapping) also contributes to the development of students’ creativity and critical thinking skills, particularly in the process of creating summary notes for the topics learned (Sulaiman & Abd Rahman, 2023).
According to the results of the research, when it was examined whether the metacognitive awareness levels of secondary school students differed according to gender in the pre-test and post-test, it was concluded that the metacognitive awareness levels of the students did not differ according to the gender variable in the pre-test and post-test. This result is similar to the results of studies conducted by Özçakmak et al. (2021), Gündüzalp (2021a), Merchan Garzón et al. (2020), Jaleel (2016), and Liliana and Lavinia (2011). However, it is seen that there are studies in which women have higher metacognitive awareness than men (Dincer & Cilek, 2022; Vrugt & Oort, 2008; L. Zhao et al., 2024). It can be said that this may be due to the fact that the sample group is different and the educational backgrounds of the participants in the groups are different. The study also examined whether the metacognitive awareness levels of sixth grade middle school students differed according to daily internet use in the pre-test and post-test, and it was concluded that the metacognitive awareness levels of sixth grade middle school students did not differ according to the variable of daily internet use in the pre-test and post-test. In a different study in the literature, there is no study examining whether daily internet use as a variable affects metacognitive awareness.
With the increase in access to personal computers and internet services, and the early exposure of the younger generation to information and communication technologies, Mossberger et al. (2003) suggested that gender differences in internet usage may decrease. The UCLA Internet Project (2004) supported this hypothesis by reporting that there was no gender difference in internet anxiety among young children. Clearly, the impact of gender differences on internet and computer usage has not been definitively established in the existing literature. Although there are many reasons that could contribute to inconsistent findings, a validated and comprehensive theoretical framework is needed to explain the relationships among the relevant factors (Huang et al., 2013).
According to the results of the research, it was also seen that the use of Web 2.0 tools in the social studies course compared to the course taught in traditional ways, the academic achievement of the social studies course of the sixth grade middle school students differed significantly in favor of the post-test as a result of the pre-test and post-test applications. As a result of this finding, it is possible to say that the use of Web 2.0 tools in the social studies course increases academic achievement in students. When the literature is reviewed, the findings of this study are in line with the results of studies conducted by Nayıroglu and Tutak (2023), Küçükaydın and Ulum (2023), Yunus and Hua (2021), Ergul Sonmez and Cakir (2021), Fadhilawati (2021), Khasanah and Lestari (2021), Hursen (2020), Korkmaz et al. (2019), F. Zhao (2019), Lage (2014), Frisch et al. (2013), Bender and Bull (2012), Baig (2011), O’Bannon and Britt (2011), Holcomb and Beal (2010), Malhiwsky (2010), and Shieh (2010).
In the study, when it was examined whether the academic achievement test scores of middle school students differed according to gender, it was concluded that the academic achievement test scores did not differ according to the gender variable. When the literature is examined, the findings of this study are not similar to the findings of the study conducted by Yunus and Hua (2021). In the study conducted by Yunus and Hua (2021), in the academic achievement of Quizizz, a Web 2.0 tool, between male and female students in the fifth grade of primary school, female students scored higher than male students in the post-test. In addition, Sawhney and Bansal (2015) found that the academic achievement of female students was significantly higher than that of male students. When it was examined whether the academic achievement test scores of middle school students differed according to daily internet use, it was concluded that the academic achievement test scores did not differ according to the variable of daily internet use. These findings of the study are not similar to the results of the study conducted by Taylor and Duran (2006), in which the achievement of students who frequently used the Internet was higher than those who did not use it. This may be due to the difference in the way students use the Internet over time.
The study also examined whether the metacognitive awareness levels of middle school students differed according to their academic achievement in the pre-test and post-test, and it was concluded that the metacognitive awareness levels of sixth grade middle school students differed according to their academic achievement in the pre-test and post-test. This result obtained from the study is similar to the studies indicating that there is a significant difference between metacognitive awareness and academics (Abdellah, 2015; Coutinho, 2007; Jegede et al., 1999; Özçakmak et al., 2021; Romainville, 1994; Sawhney & Bansal, 2015; Yadav et al., 2022; Young & Fry, 2008). This study and previous studies show that an increase in students’ metacognitive awareness levels also affects their academic achievement scores. (This relationship is also shown in Figure 6.) Apart from these studies, Dagal and Bayindir (2016) found that there was no significant relationship between metacognitive awareness levels of pre-service teachers and their academic achievement; Gul and Shehzad (2012) found that there was a weak relationship between metacognition and academic achievement.
When the results of the study are evaluated as a whole, it can be said that the qualitative findings support and complement the quantitative findings. Looking at the qualitative findings, it was first determined that the sixth-grade middle school students developed a positive perspective on the use of Web 2.0 tools in the educational process and found these tools to be very useful. In the study, when the opinions of sixth grade middle school students about the use of Web 2.0 tools in the education process were examined, it was determined that most of the students participating in the study developed a positive perspective towards Web 2.0 tools and found these tools very useful. In addition, when the opinions of middle school students on the effect of Web 2.0 tools used in the social studies course on their learning processes were examined, it was concluded that almost all students participating in the study found that these tools positively affected their learning processes and were effective in reinforcing the subjects of the social studies course, which has an interdisciplinary approach. These findings of the study are similar to the findings of studies conducted by Fadhilawati (2021), Mohamad et al. (2020), Lestari (2019), Sanmugam et al. (2019), Faizi (2018), and Yücel (2017) in which students found Web 2.0 tools motivational and reinforcing. Heafner and Friedman (2008) concluded that the use of wiki, a Web 2.0 tool, in social studies courses positively affected students’ self-efficacy and motivation.
In the study, when the opinions of middle school students on the contribution of using Web 2.0 tools in out-of-school environments to their learning processes were examined, it was found that the majority of students used Web 2.0 tools in out-of-school environments. It was concluded that middle school students’ use of these tools in out-of-school environments contributed positively to their learning, made learning more fun and improved their perspectives on the course. These findings of the study are similar to the results of studies in the literature indicating that Web 2.0 tools are fun for students (Öztürk & Eren, 2020; Pede, 2017; F. Zhao, 2019).
In the study, when the sixth grade middle school students’ opinions about the Web 2.0 tools used in the social studies course increased their interest and enthusiasm for the course were examined, it was concluded that most of the middle school students participating in the research concluded that Web 2.0 tools increased their interest and enthusiasm for the course. These findings of the study are similar to the results of the study conducted by Holcomb and Beal (2010) and Williams and Chinn (2009) who stated that Web 2.0 tools increase students’ interest, curiosity, and creativity. These findings can also be said to be similar to the results of the studies indicating that Web 2.0 tools are instructive (Bender & Bull, 2012; Chou et al., 2015; Gündüzalp, 2021b; Öztürk & Eren, 2020; Rogers-Estable, 2015; Usoro et al., 2014). The study also, when examining the opinions of sixth-grade middle school students about the use of Web 2.0 tools in different subjects, it was observed that almost all students expressed the view that these tools should be used in the learning of various subjects and in the teaching processes of different subjects. When looking at the literature on this topic, similar results can be observed regarding the use of Web 2.0 tools in different fields. For example, in science classes, it has been found that Web 2.0 tools enhance students’ motivation, academic achievement, and metacognitive thinking skills (Bostan Sarıoğlan & Şentürk Özkaya, 2023; Demirezer & İlkörücü, 2023; Hamlı & Hamlı, 2021; Harrison, 2009; Ortaakarsu & Sülün, 2022), and in Information Technology classes, they have improved students’ motivation, academic achievement, and metacognitive thinking skills (Gündoğdu & Korucu, 2018; Kalemkuş & Bulut-Özek, 2022).
Limitations and Suggestions
This research is limited to the sixth grade social studies course and the People, Places, and Environments learning area. Future research can examine the use of Web 2.0 tools at different grade levels. In addition, studies to be conducted in different subjects of social studies course can contribute to the research findings and literature.
Another limitation of the study is that it cannot reveal the long-term effects of Web 2.0 tools on student achievement and interaction. In this context, future studies can focus on longitudinal research examining the sustainable effects of Web 2.0 technologies. The relationship of Web 2.0 tools with pedagogical approaches such as project-based or inquiry-based learning can be investigated. Furthermore, mediating or moderating factors that may influence the relationship between student characteristics and learning outcomes should be examined in more detail.
Some of the difficulties that teachers may encounter in the process of using Web 2.0 tools in education and suggestions for solutions are as follows:
Most of the Web 2.0 tools for educational purposes are paid and this may create a financial burden for educators. Therefore, free, or open-source tools should be explored and prioritized. In addition, the Ministry of National Education and educational institutions can provide bulk license or subscription support by allocating budget.
Students may not have access to the necessary devices (smartphones, tablets, computers, etc.) to use Web 2.0 tools. Schools should reduce this barrier by providing students with internet connection and necessary equipment.
Educators’ lack of knowledge of Web 2.0 tools can reduce their interest in using them. Teachers should be trained to increase their technological competence, these trainings should be shared on platforms such as social media, and successful practices should be rewarded to increase the interest of other teachers.
Preparing activities with Web 2.0 tools may require additional out-of-class time for teachers. To reduce this problem, previously prepared content can be reused, and materials developed by expert organizations can be integrated into the curriculum. In addition, teachers can learn about Web 2.0 technologies through seminars and courses offered by the Ministry of National Education.
Continuous use of Web 2.0 tools may cause students to lose interest over time. For the sustainability of interest, it is recommended to use different tools alternately and to prefer Web 2.0 tools that include gamification techniques.
Footnotes
Funding
The author(s) received no financial support for the research, authorship, and/or publication of this article.
Declaration of Conflicting Interests
The author(s) declared no potential conflicts of interest with respect to the research, authorship, and/or publication of this article.
Data Availability Statement
The datasets generated and/or analyzed during the current study are available from the corresponding author upon reasonable request.