
Abstract
The development of information and communication technologies has created limitless prospects for using augmented reality (AR) in various fields. Unfortunately, the multitasking nature of AR systems prevents learners from successfully reflecting and retaining knowledge. This study developed and designed a learning analytics dashboard (LAD) with three components: personal learning data, social comparison, and visualization of the learning process, to promote knowledge acquisition and metacognitive awareness among AR learners. A total of 31 intermediate-level Japanese learners participated in an experiment involving pre-tests, post-tests, and a delayed test to assess the LAD. Learners engaged with the AR learning system for Japanese compound verb learning and utilized the LAD to monitor and reflect on their AR learning activities. Behavioral data were analyzed using Lag Sequential Analysis (LSA), while learning performance was evaluated through one-way repeated-measures ANOVA tests. The findings indicate that the use of the LAD significantly improves learning outcomes and metacognitive processes, such as knowledge of cognition and regulation of cognition. Additionally, there were different usage patterns of the dashboard among learners, which corresponded to significant differences in their learning outcomes and changes in metacognitive awareness. Learners who primarily focused on the learning process and social comparison components of the dashboard demonstrated improved knowledge retention. Conversely, those who mainly concentrated on personal learning data experienced the most significant gains in metacognitive awareness. This study also provides crucial design insights on the integration of dashboard components with cognitive efforts to maximize learning outcomes.
Plain language summary
This study examined the effectiveness of a learning analytics dashboard (LAD) with three components (personal learning data, social comparison, and visualization of the learning process) in promoting the knowledge acquisition and metacognitive awareness of 31 non-native learners of Japanese in learning Japanese compound verbs. The results indicated that the use of LAD significantly improves learning outcomes and metacognitive processes, such as knowledge of cognition and regulation of cognition, and second, that students who concentrated on the learning process and social comparison showed the most improved performance in knowledge retention, while those who concentrated on personal learning data showed greater improvements in metacognitive awareness. This study contributes significantly to the field of LA by providing evidence that the integration of LAD into AR learning environments can meet the multifaceted challenges posed by concurrent multitasking, thus facilitating a more monitored and reflective learning experience. The research also highlights the benefits of combining dashboard components with cognitive efforts to ensure that metacognitive awareness is effectively harnessed to improve learning.
Keywords
Introduction
Learning methods have been revolutionized by technological advancements and the increasing usage of smart mobile devices. This paves the way for incorporating AR in various fields. By combining virtual learning information with actual learning materials, AR enhances the learning context’s relevance (Fan et al., 2020). AR is progressively exhibiting its significant potential and benefits for facilitating language learning. AR combines real-world items with virtual content and provides learners with an authentic learning context, enabling them to acquire the target language in a realistic manner (Parmaxi & Demetriou, 2020). AR learning activities provide more learner interest and engagement than the traditional textbook-based instructional approach (Weerasinghe et al., 2022). The visual-haptic visualization feature of AR aids learning through multisensory experiences and enhances the interaction between the learner and AR materials (Santos et al., 2014; Wen, 2020). This addresses the learners’ need for more engaging and interactive learning experiences, which can be particularly beneficial in maintaining motivation in language acquisition. However, the implementation of AR in language learning is not without challenges. The multitasking nature of AR learning systems can sometimes overwhelm learners, hindering their ability to reflect accurately on their learning process and set appropriate learning goals (Garzón et al., 2019). Additionally, learners may become overly focused on the novelty of the technology itself, potentially distracting them from the core learning objectives (Gelan et al., 2018). For example, in AR environments, learners who lack adequate scaffolding often exhibit superficial learning behaviors, such as merely browsing for information, and do not fully engage with the learning content (Ibáñez et al., 2015). Without appropriate scaffolding, learners are less likely to focus on meaningful tasks, indicating a deficiency in self-regulated learning or attention to the learning process. These challenges highlight a critical need for tools that can help learners navigate the complexities of AR language learning environments more effectively.
As AR introduces a novel learning environment, understanding learners’ learning behaviors and interactions within this environment becomes pivotal. Although AR offers immersive sensory experiences, notably visual and haptic, it is imperative to understand the learning process in an AR learning environment, an in particular to recognize when learners are experiencing difficulties (Wu et al., 2013). Consequently, there is a pressing need for a tool that can gather, interpret, and display learning data in a manner accessible to both educators and learners. Learning Analytics (LA) is useful for assisting learners to make meaning out of their own learning data (Aljohani & Davis, 2012). As an effective tool for supporting learners’ monitoring and reflection, the LAD has been designed to provide a visual display on the screen that combines and organizes the relevant information needed to achieve one or more goals (Teasley, 2017). Research on LADs has confirmed that they improve learning outcomes, reflection, and metacognitive awareness, among other indicators (Bodily & Verbert, 2017; Jivet et al., 2017). For example, college students who utilized the dashboard for online courses achieved better learning outcomes than those who did not (Jivet et al., 2017). However, Kokoç and Kara (2021) noted that few studies have investigated how LAD affects learning behaviors, such as improved learning outcomes and metacognitive awareness. Therefore, this study aims to bridge this gap by developing and integrating a LAD into an AR language learning system, analyzing and comparing changes in learning behaviors and metacognitive awareness across different LAD usage patterns, and exploring the impact of LAD use on learning outcomes and metacognitive awareness in an AR learning environment. Specifically, the study will first analyze the differences in learning outcomes and metacognitive awareness before and after using LAD in an AR language learning environment to determine the effectiveness of the developed LAD in improving language acquisition and metacognitive awareness. Then, by identifying LAD usage patterns in the AR language learning environment, the study will understand how learners interact with the dashboard and which components are most beneficial. Additionally, examining how changes in learning behaviors, learning outcomes, and metacognitive awareness differ among learners with different dashboard usage patterns in the AR language learning environment will help determine the impact of dashboard interactions on language learning and metacognitive processes.
Literature Review
AR Language Learning Environment
AR is defined as the reality-virtuality continuum in real-time, with three key features: integration of virtual and reality, real-time interaction, and 3D registration (Azuma, 1997). These features make AR systems very effective in language acquisition applications, as opposed to mixed reality (MR) and virtual reality (VR). Unlike VR, AR superimposes digital elements in the real world, allowing learners to remain connected to their physical surroundings. This contextual integration is crucial in language learning, where learners often need to interact with real-world objects or situations to better master vocabulary, grammar, or usage (Ibrahim et al., 2018). In contrast, virtual reality creates a fully immersive environment, which may be beneficial for the simulation of certain types of tasks, but the learner is completely removed from the physical environment, which may limit the natural application of language in context and increase the cognitive load (Maas & Hughes, 2020). On the other hand, MR combines elements of AR and VR, but its reliance on more complex technology and infrastructure may increase the cost and complexity of implementation (Shen et al., 2023). AR is more cost-effective and accessible than MR or VR, as it typically requires only a mobile device or tablet rather than specialized equipment (Weerasinghe et al., 2022). Additionally, AR systems are less likely to cause motion sickness or discomfort in simulators, which can be an issue in fully immersive VR environments (Childs et al., 2023).
Numerous studies have demonstrated that AR language-learning systems can enhance learning performance in multiple areas of language skills, including speaking, vocabulary, pronunciation, and reading (Garzón et al., 2019; Ibrahim et al., 2018; Parmaxi & Demetriou, 2020). In particular, regarding the use of AR systems for vocabulary learning, Wen (2020) designed an AR game specifically for learning Chinese characters, exploring the learning outcomes and cognitive engagement of Chinese characters radicals among elementary school students in Singapore. The findings indicate that students utilizing the AR tool were actively immersed in language-learning tasks, leading to an increase in cognitive engagement (Wen, 2020). A study evaluating the learning impact of an AR Japanese vocabulary system called Vocabulary (Weerasinghe et al., 2022) found that learners using AR notably outperformed learners using traditional methods in an immediate recall test and exerted significantly less mental effort during the learning process. A significant portion of AR vocabulary-learning systems utilize word cards as markers for learning activities (Fan et al., 2020). These encompass spelling activities in which letter cards are used to construct words, knowledge visualization activities to recognize the words on the cards, and activities that integrate card combinations and knowledge visualization. For instance, a flipped English classroom used an AR board game by scanning the relevant cards to view the puzzles to aid in vocabulary learning, and a comparison with a traditional paper puzzle game revealed that the AR learning environment outperformed it in terms of vocabulary acquisition and creative thinking (Hung & Yeh, 2023). In addition to marker-based AR systems, several vocabulary-learning environments have been developed using GPS and other geographical location technologies. For instance, Song et al. (2023) created an AR vocabulary learning system using Google Street View that assisted students in acquiring English words through objects depicted in the scene. Consequently, the findings from Parmaxi and Demetriou’s (2020) systematic review of research published between 2014 and 2019 on AR applications in language learning indicate that AR not only enhances outcomes across various language skills, but also fosters motivation, satisfaction, engagement, and enjoyment in the language learning process, among other benefits.
However, several challenges have been reported when applying AR language learning systems. Primarily, the multitasking nature of AR requires learners to execute numerous tasks within a short period of time (Xing et al., 2023). For instance, during AR in vocabulary learning activities, learners frequently need to hold the mobile device for scanning repeatedly while also moving the marker to adjust the angle or combine operations. Such multitasking tasks might distract learners from maintaining focus on their learning process, thereby hindering their ongoing self-reflection and optimization of their study methods (Garzón et al., 2019; Ibáñez et al., 2015). Therefore, it is imperative to offer additional assistance to learners to bolster their understanding of the learning process and provide them with opportunities for reflection. Second, Parmaxi and Demetriou (2020) noted that the learning process in AR environments differs from that in traditional learning settings. In AR learning environments, learners are often attracted to the AR technology itself, inadvertently sidelining learning content and overshadowing the learning process (Gelan et al., 2018). Consequently, learners may use language learning strategies they are accustomed to, which cannot be effectively applied or learned in an AR learning system. Moreover, fostering metacognitive awareness during language learning is crucial (Chamot, 2005). Metacognition, broadly defined as “cognition of cognition,” plays a crucial role in enhancing learners’ awareness and control of their cognitive processes (Flavell, 1979). Oxford (1990) provides a comprehensive framework for understanding metacognition in language acquisition. She posits that metacognitive strategies, such as planning learning tasks, self-monitoring, and self-evaluation, are essential for successful language acquisition. These strategies assist learners in focusing on the target language and in structuring their learning more efficiently. Through metacognitive awareness, learners comprehend their own cognitive processes, enabling them to manage their strategy selection and application, plan their learning approaches, monitor their performance, find solutions to challenges, and self-evaluate upon task completion (Zhang & Goh, 2006). Particularly in AR language learning activities, metacognitive awareness is important for learners. Since the learner is often central to the AR learning process, it becomes imperative for the learner to recognize whether they are progressing well on their tasks, identify and monitor learning difficulties, and adjust their learning strategies and processes. However, a limited number of AR language systems aim to heighten learners’ metacognitive awareness; only 3 of 70 AR studies from 2014 to 2019 addressed metacognition (Parmaxi & Demetriou, 2020). LAD has the potential to address these challenges. Specifically, in the enhancement of learners’ metacognitive awareness, LAD assists learners in more effectively monitoring and adjusting their learning strategies through that visualizations afford students opportunities to review and reflect on the learning process, thereby aiding learners in handling the complexities of multitasking and applying strategies in AR learning environments.
Learning Analytics Dashboard
LADs include visual features such as charts, graphs, metrics, and alert mechanisms that enable learners to monitor, reflect on, and make decisions regarding their learning (Kim et al., 2016). LAD has emerged as a powerful tool in the field of educational technology, providing visual representations of learner data to support monitoring, reflection and decision-making during the learning process (Karaoglan Yilmaz, 2022; Schwendimann et al., 2016; Valle, Antonenko, Dawson, et al., 2021). As education increasingly moves toward digital and blended environments, the role of LADs in enhancing learning outcomes and metacognitive awareness has become a focus (Bodily & Verbert, 2017; Jivet et al., 2021). The theoretical underpinnings of LAD design and assessment are largely rooted in self-regulated learning (SRL) theory (Zimmerman, 2000). This framework assumes that effective learning involves cyclical stages of planning, performance and reflection. LADs are designed to support these processes by providing learners with timely and relevant information about their learning activities and progress. Matcha et al. (2019) demonstrated that LADs designed based on the principles of SRL effectively supported learners’ metacognitive processes and enhanced their ability to plan, monitor and reflect on their learning processes.
Bodily and Verbert (2017) found that data that is visualized in LAD communicates learning analytics more effectively, enabling learners to quickly grasp and act on the information presented. For example, Aljohani et al. (2019) enhanced the frequency of students’ accessing a learning system and their engagement by employing visualizations on the dashboard, such as bar charts, to represent the average frequency and performance of learners versus different learners. LAD significantly influences the comprehension of complex learning data (Valle, Antonenko, Dawson, et al., 2021a); in particular, by designing data visualizations based on social comparison theory (Teasley, 2017). By utilizing LAD, learners can monitor not only their own progress but also other learners’ progress, interactions, and learning processes within the environment. Valle, Antonenko, Valle, et al. (2021b) designed and developed a descriptive LAD and a predictive LAD to further enhance motivation and learning outcomes in an online course by informing learners about their performance, the average scores of all learners, the relative levels of all learners, and predicting performance on the final score with line graphs. Additionally, to facilitate better comparison with other learners, Fleur et al. (2023) developed an upward-oriented comparative LAD that successfully aided learners in understanding their achievement levels and establishing goals, thereby enhancing extrinsic motivation and learning outcomes. This approach not only enables learners to identify areas of successful learning and potential challenges but also assists in regulating the learning process, thereby enhancing improvement outcomes and bolstering knowledge retention (Kim et al., 2016). For example, college students who utilized the dashboard for online courses achieved better learning outcomes than those who did not (Jivet et al., 2017).
In addition to enhancing learning outcomes, LADs have shown potential in developing learners’ metacognitive skills. Metacognitive awareness comprises two dimensions: cognitive knowledge and cognitive conditioning, which involve aspects of declarative, procedural, and conditional knowledge; planning; information management strategies; and monitoring, evaluation, and debugging strategies (Harrison & Vallin, 2017). For instance, by providing real-time feedback, LADs can facilitate the development of metacognitive abilities among students. Chen et al. (2019) designed a LAD comprising a knowledge monitoring dashboard and a strategy use dashboard to assist students in planning, monitoring, and regulating their learning strategies during self-regulated learning, thereby enhancing their metacognitive skills. The results indicated that reflective behaviors facilitated by the LAD (e.g., removing unnecessary annotations) help enhance students’ metacognition in terms of knowledge dimensions (Chen et al., 2020). Metacognitive awareness is also pivotal in language learning, aiding learners in identifying the most effective language learning methods, thereby enhancing learning outcomes (Rahimi & Katal, 2012). The AR language learners need to identify whether they are progressing in a task, but they also need to recognize and track learning challenges and adapt their learning strategies and processes accordingly. The LAD can provide real-time feedback on learner performance, interactions with AR elements, and progress toward learning goals, thereby further supporting self-regulated monitoring and reflection. Hence, LAD assists learners in clearly comprehending these challenges and their progress, thereby encouraging self-reflection and improving their learning methods. It aligns with metacognitive strategies in language learning (Oxford, 1990) and supports the learner’s planning, monitoring, and assessment processes. However, most research has concentrated on traditional online learning environments, and the potential of LADs within emerging educational technologies such as AR remains largely unexplored. The unique challenges and opportunities inherent in AR language learning environments necessitate specialized LAD designs to effectively support learners in these immersive contexts. Furthermore, while LAD is often used to enhance metacognitive awareness, reflection, and behavioral modification, few studies have been conducted of how the behavioral patterns influenced by LAD impact learning outcomes and changes in learning behaviors (Kokoç & Kara, 2021). Evaluating the effectiveness of LAD interventions not only improves learning effectiveness and metacognitive awareness but also requires a thorough analysis of usage patterns of LAD and changes in learning behaviors before and after employing LAD.
Our study aims to fill these gaps by investigating the design and evaluation of the LAD in AR Japanese language learning environments. Unlike most LAD studies conducted on conventional online learning platforms (e.g., Massive Open Online Courses; Schwendimann et al., 2016), we utilized theories such as social comparison to design and implement a LAD specifically developed for an AR Japanese language learning environment. Through the use of a mixed-methods approach—including psychometric data collection, qualitative interviews, and log data analysis—this study explored patterns of LAD usage, learning behaviors before and after its implementation, and changes in metacognitive awareness. We sought to reveal the unique role of the LAD in supporting language learning in AR environments. This study endeavors to provide effective solutions for overcoming the current challenges of AR learning systems, enhancing the metacognitive awareness of learners and improving their learning effectiveness.
Previous Study: AR Japanese Compound Learning System
In previous studies (Geng & Yamada, 2019, 2020, 2023), an AR system for learning Japanese compound verbs were designed and developed to address the difficulties of unclear combination conditions and opacity of meaning in compound verb learning. The AR learning system comprises paper verb cards and an application: learners utilize the application to scan single cards or combinations of two cards to acquire verbs (see Figure 1). The verb cards are printed with single verbs that can be combined to form compound verbs. The single verbs consist of basic and core verbs that can be combined with multiple basic verbs. Learners can acquire not just basic verbs but also compound verbs through the different operations. As depicted in Figure 1, when learning single verbs, the core and basic verbs can be scanned using the application camera function. Thereafter, the verb’s animation, explanation, and example sentence are displayed on the screen. The learning of compound verbs requires the learner to correctly identify the core and basic verb cards that form the compound verb, arrange these two cards together and scan the combination using an application. After the correct combination of cards has been scanned, the system shows an animation of the compound verb and an explanation of the meaning. If the verbs on the two cards cannot be joined to form a compound verb, the system will display an error message indicating that the combination is incorrect.

The AR Japanese compound verb learning system.
Previous research (Geng & Yamada, 2020, 2022), demonstrated the learning effectiveness of AR learning systems, namely that performance on compound verbs improves significantly after learning with the system. Knowledge retention has not been thoroughly studied to date, and learners’ performance on delayed tests tends to be reduced compared to post-tests (Geng & Yamada, 2020). According to the findings of Geng and Yamada (2023), the experimental design was such that learners were free to use any combination of cards and were not prompted with concepts about core and basic verbs. Therefore, there was a great deal of randomness and blindness in the card combinations and learning process. This makes it difficult for learners to track their current learning progress and evaluate their learning process to establish their next learning goals more effectively (Verbert et al., 2014). Therefore, we developed and designed the LAD to facilitate learning outcomes and metacognitive awareness using an AR language learning system and posed the following four research questions:
RQ1: What are the differences in learning outcomes and metacognitive awareness before and after using LAD in AR language-learning environments?
RQ2: How do learners’ dashboard usage patterns differ in AR language-learning environments?
RQ3: How do changes in language learning outcomes and AR learning behaviors differ among learners with different dashboard usage patterns?
RQ4: How does metacognitive awareness differ among learners with varying dashboard usage patterns in AR language-learning environments?
Methodology
Experiment Design
Participants
This experiment was designed to address the research questions with 31 participants (14 males and 17 females), who were nonnative speakers of Japanese, most of them Chinese and one Malaysian. They were international students studying at a university in Japan with an intermediate level of Japanese (N2 and N3 levels on the Japanese Language Proficiency Test, organized by the Japan Foundation). Although the participants often faced compound verbs in their daily lives, they had no systematic learning experience.
Experimental Procedure
The experiment consisted of four steps and lasted 125 min. Figure 2 illustrates the experimental procedure. First, participants were asked to complete a pretest and a Metacognitive Awareness Inventory (MAI) to determine their understanding and prior metacognitive awareness of Japanese compound verbs. In Step 2, the participants engaged in a compound verb-learning activity using the AR learning system and the LAD. During the learning activity, participants used the AR learning system for 40 min to learn compound verbs and then immediately answered Post-Test 1. Posttest 1 was implemented to assess participants’ performance after using only the AR system. Following the test, participants monitored and reflected on the previous AR Learning activity using a dashboard for 10 min. Based on the results of the dashboard, they spent 15 min using the AR system to further learn compound verbs. At the end of the AR learning activity, the dashboard was employed once more for a comprehensive review. Each participant participated in the experiment separately, without being influenced by the other participants. After the learning activity, post-test 2 was administered to evaluate learners’ learning performance after using the LAD. In Step 4, the participants took a delayed test and interview one week later to evaluate their retention of compound verbs. The interviews focused on the changes that occurred before and after the use of LADs, as well as on the AR language learning environment that integrates LADs.

The procedure of the experiment.
Learning Analytics Dashboard
We combined elements of social comparison and achievement goal orientation theory and developed three parts, including eight views based on existing AR language learning system issues. These three parts are visualization of current learners’ personal learning data, comparison of personal and all learners’ learning data, and visualization of the learning process (see Figures 3 and 4). Furthermore, these three parts correspond to different views, respectively. We used D3.js and Chart.js to build the dashboard. Six former AR learning system learners and five LA specialists participated in piloting the dashboard by responding to the system usability scale (SUS: Brooke, 1996) and being interviewed. The mean value of the SUS score was 80, and the dashboard’s usability was good. Furthermore, minor modifications were made based on the results of interviews to improve the dashboard further.
Personal learning data: To assist learners in monitoring their learning activities by providing personal data on their learning activities, learning progress, learning frequency, and time spent.
1. Number of verbs learned: The number of single and compound verbs learned and those not learned.
2. Learning progress: Learning progress for all verbs and single and compound verbs separately.
3. The time of learning verbs: The total learning time for single verbs, compound verbs, and incorrect combinations, and the average learning time for each verb in the learning activity. Furthermore, there is a view of the top four most time-consuming terms for single verbs, compound verbs, and incorrect combinations.
4. The frequency of learning verbs: This view lists the overall and average frequency of verbs learned and the top four frequency verbs learned for single verbs, compound verbs, and incorrect combinations.
5. Learning rankings: This shows the current learner’s ranking of learning progress, verb learning time, number of verbs learned, and number of incorrect combinations of all learners. The color of the ranking number is green when the learner is at the top and red when the learner is at the low end.
Comparison of personal and all learners data’: This view serves as a resource for monitoring the learning activities of other learners as a direct comparison to regulate their own learning activities (Teasley, 2017; Jivet et al., 2017).
6. Comparison of personal and total learners’ learning time: The bar charts show the average learning time per single and compound verb for the current learner and all other learners. The green bars represent the data for current learners, and the gray bars represent the average data for all learners to enable comparison.
7. Comparison of personal and total learners’ learning frequency: This view also employs bar charts to illustrate the average learning frequency of verbs for the present learner and all learners.
Visualization of the learning process: This offers learners visual cues of the learning process to their mastery of the compound verb (e.g., the distinction between core and basic verbs), thus further reflecting on the learning process for knowledge retention.
8. Learning process: This view shows a visualization of the learning process. The blue, red, and green circles correspond to the learning behaviors of single verbs, incorrect combinations, and compound verbs, respectively. The sequence of the circles reflects the order in which learning behaviors occur, while the arrows indicate the time gap between two learning behaviors. Furthermore, the deeper the circle’s color, the more frequently the verb was learned, and the greater the circle’s area, the longer the learning time of the verb.

The personal learning data part of the dashboard.

The parts of comparison of personal and all learners’ data and visualization of the learning process.
Instruments and Data Analysis
Four tests (pre-test, post-test 1, pre-test 2, and delayed test) were designed to evaluate the participants’ knowledge of compound verbs, learning performance, and knowledge retention. The questions and options were the same on all four tests; however, the sequence of questions and options was randomized. Each test consisted of true/false questions assessing knowledge of the combining conditions of compound verbs, and multiple-choice questions assessing verb meaning for a total of 41 points. Furthermore, to ensure the accuracy of the tests, two teachers with more than 20 years of experience in teaching Japanese reviewed and revised the questions and options.
The MAI (Harrison & Vallin, 2017) was used to measure participants’ pre and post metacognitive awareness. The MAI consists of 19 items along two dimensions: knowledge of cognition (8 items) and regulation of cognition (11 items). The knowledge of cognition dimension includes declarative, procedural, and conditional knowledge: Declarative knowledge refers to the knowledge about the learners (e.g., “I know what kind of information is most important to learn”), procedural knowledge refers to knowing how to learn (e.g., “I am aware of what strategies I use when I study”), and conditional knowledge relates to knowing when and why to acquire knowledge (e.g., “I know when each strategy I use will be most effective”; Schraw & Dennison, 1994). The regulation of cognition dimension includes planning (e.g., “I set specific goals before I begin a task”), information management strategies (e.g., “I use the organizational structure of the text to help me learn”), monitoring (e.g., “I periodically review to help me understand important relationships”), evaluation (e.g., “I ask myself if I learned as much as I could have once I finish a task”), and debugging strategies (e.g., “I change strategies when I fail to understand”) to facilitate the regulation of learning. All items are scored on a 5-point Likert scale ranging from 1 (not applicable at all) to 5 (very applicable).
During the learning event, raw data and dashboard logs were collected from the AR learning systems of all 31 participants. After cleansing the invalid data, 37,252 learning data points were obtained. For dashboard data, the reading duration of each view was determined by calculating the reading behaviors and time to ascertain the dashboard's usage pattern. Furthermore, there are six different learning behaviors in the AR learning system, including learning the core and basic verbs, combining the compound verb, incorrectly combining cards, pausing to scan, and stopping learning. The AR learning system behaviors and definitions are reflected in Table 1. Thereafter, we further processed the AR learning behavior data before and after temporally utilizing the dashboard to code them into sequences. Moreover, the AR learning behavior data before and after using the dashboard were processed as events and encoded into sequences.
The Behaviors in the AR Learning System and Its Definition.

The frequency of behaviors on the dashboard is not deemed a meaningful indicator (Kim et al., 2016). Therefore, each view’s reading duration was analyzed by clustering k-means to respond to RQ1. To validate participants’ behavioral changes in the AR learning system, lag sequential analyses (LSA) were applied to the behavior sequences before and after dashboard use. LSA determines if the probability of one event occurring after another is statistically significant to identify activity sequences and the order of behaviors (Bakeman & Gottman, 1997). Furthermore, a one-way repeated measures analysis of variance (ANOVA) was used to analyze whether there were differences between scores on the analyzed pre-test, post-test 1, post-test 2, and delayed tests. ANOVA and post hoc analyses were conducted to compare the differences in test scores and metacognitive awareness before and after the experiment for participants with different dashboard behavioral patterns.
Results
The Learning Outcomes and Metacognitive Awareness Before and After LAD Use in the AR Language Learning Environment
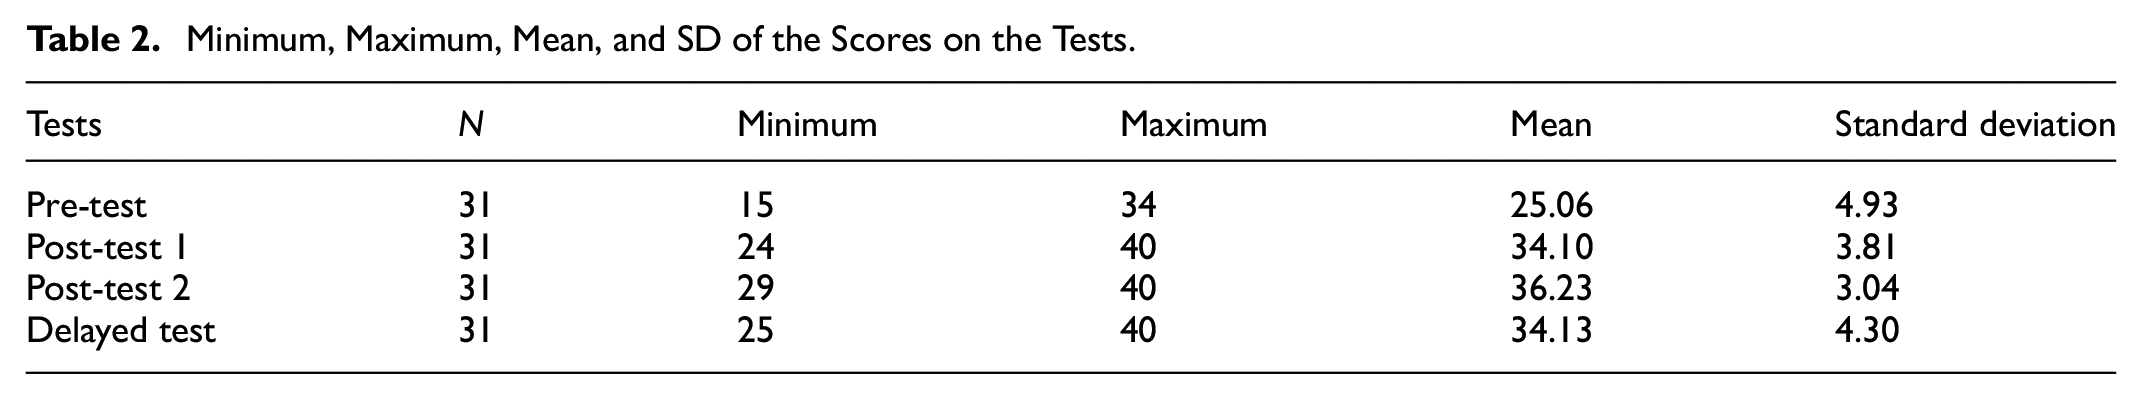
One-way repeated-measures ANOVA was performed to compare the differences in test scores for all participants on the four tests, using the pre-test, post-test 1, pre-test 2, and delayed test scores. Descriptive statistics of the scores on the four tests are presented in Table 2. Table 2 indicated that Post-test 2 had an average score of 36.23 (about 88% of the full score of 41), which was higher than the average value of the other three tests, and the standard deviation was also the smallest among the four tests. The one-way repeated-measures ANOVA found that the mean scores differed significantly across the four tests (F[3, 90] = 115.37, p < .01). Moreover, the results of post hoc pairwise comparisons using the Bonferroni correction indicated that the post-test 1 scores were higher than the pre-test scores, the post-test 2 scores were higher than the pre-test scores, and the delayed test scores were higher than the pre-test scores, all with statistical significance (p < .01). This demonstrates that the use of the AR learning system and LAD facilitated the participants’ understanding and knowledge retention of compound verbs. As shown in Table 3, the scores on post-test 2 were significantly higher than those on post-test 1 and the delayed test. This result indicates that the LAD further enhanced the learning outcomes obtained after using the AR learning system.
Minimum, Maximum, Mean, and SD of the Scores on the Tests.
Results of Post Hoc Pairwise Comparisons Using the Bonferroni Correction.

p < .01.
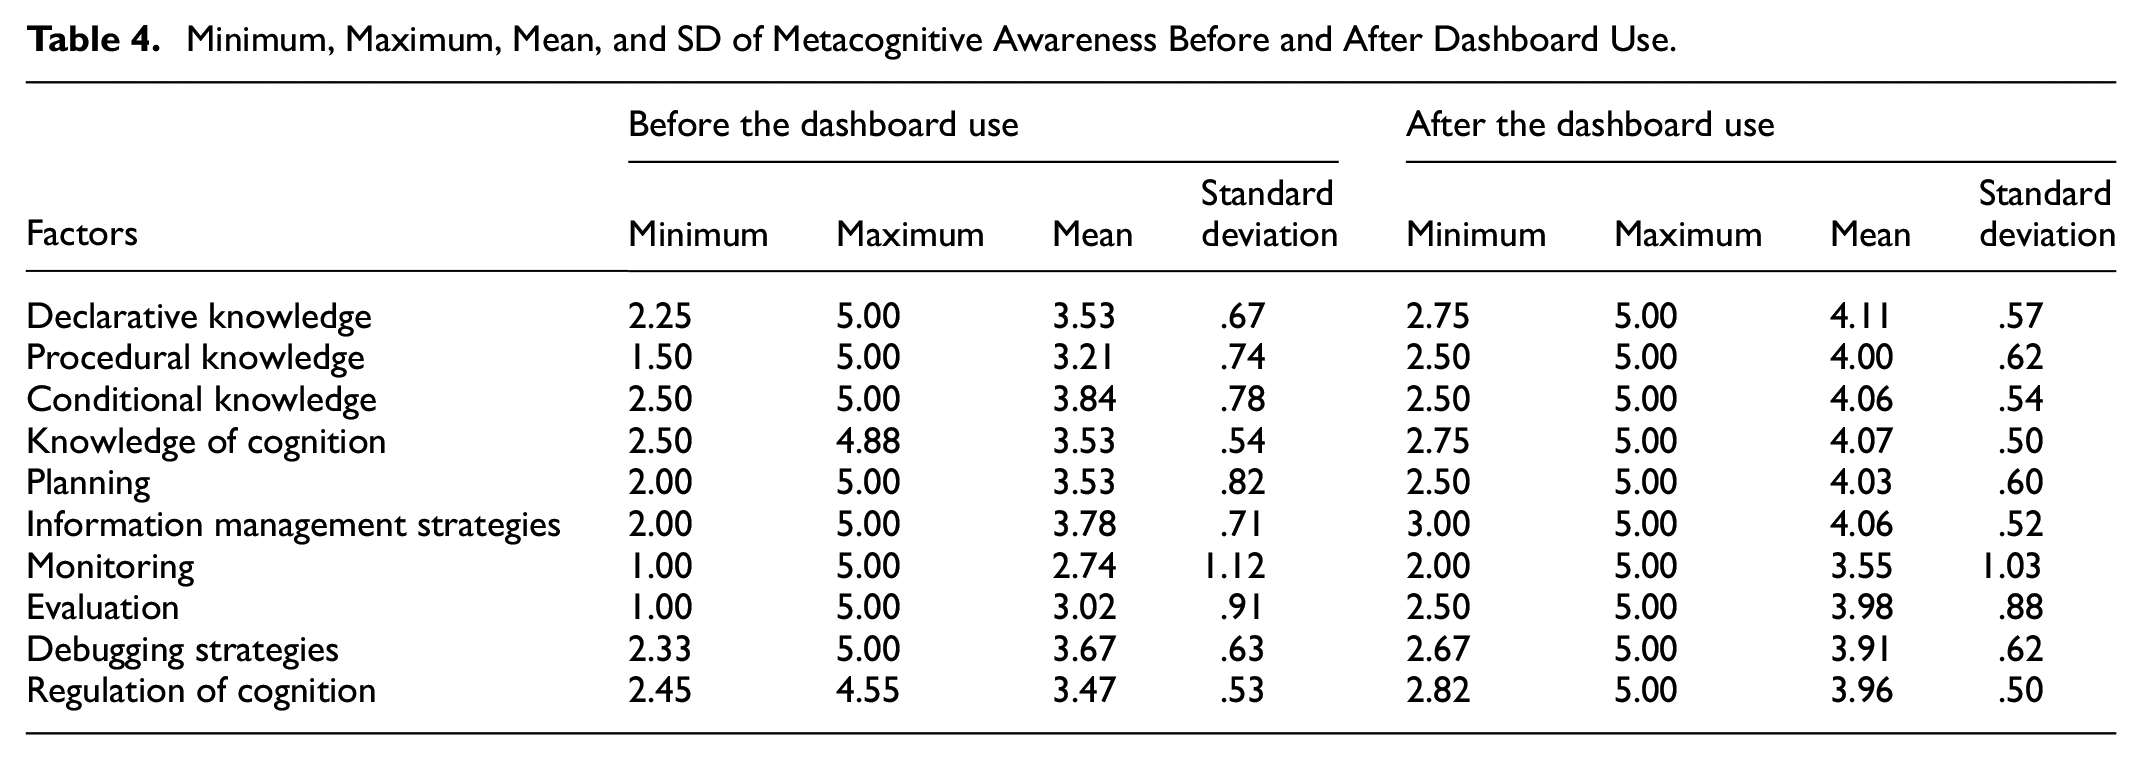
To compare the differences in metacognitive awareness before and after LAD use, the minimum, maximum, mean, and SDs were calculated based on answers from the pre- and post-MAI questionnaires. From Table 4, it can be seen that the mean values of each MAI factor after using the LAD were higher than those before using it. For example, the mean, minimum, and maximum values of knowledge of cognition after using the dashboard are 4.07, 2.75, and 5.00, respectively, which are higher than the mean (3.53), minimum (2.50), and maximum (4.88) values before using the dashboard. Paired-samples t-tests were used to further confirm the differences, showing that all learners’ knowledge of cognition and regulation of cognition were significantly higher after using the LAD than before using it (knowledge of cognition: t[30] = 6.913, p < .01; regulation of cognition: t[30] = 4.979, p < .01). Furthermore, declarative knowledge (t[30] = 4.999, p < .01), procedural knowledge (t[30] = 6.354, p < .01), planning (t[30] = 3.251, p < .00), information management strategies (t[30] = 2.192, p < .05), monitoring (t[30] = 4.167, p < .01), evaluation (t[30] = 5.848, p < .01), and debugging strategies (t[30] = 2.386, p < .05) increased statistically significantly with the use of LAD.
Minimum, Maximum, Mean, and SD of Metacognitive Awareness Before and After Dashboard Use.
Usage Patterns of the Dashboard in the AR Language Learning Environment
Using the reading time of each view on the dashboards of 31 learners, a k-means cluster analysis determined three clusters with different reading durations on each view (see Table 5). Analysis of variance (ANOVA) and post hoc tests were conducted to validate the differences in reading duration among these three clusters. ANOVA results showed that there were significant differences in the reading durations of these three clusters on views 2–8 (view 2: F[2, 28] = 9.914, p < .01; view 3: F[2, 28] = 13.298, p < .01; view 4: F[2, 28] = 4.378, p < .05; view 5: F[2, 28] = 19.348, p < .01; view 7: F[2, 28] = 29.901, p < .05; view 8: F[2, 28] = 4.072, p < .05). Tukey’s post hoc test results demonstrated that Cluster 1 (C1) was significantly higher than Clusters 2 (C2), and 3 (C3) in reading duration in views 2, 3, and 5 of personal learning data; compared to personal and all learners data in view 7; C3 was significantly higher than C1 and C2. In the visualization of the learning process in view 8, C2 was significantly higher than C1 at the p = .05 level. Therefore, the results of the reading duration of different views can be summarized by the different usage patterns of learners on the dashboard: C1 concentrated on personal learning data, C2 focused on the learning process, and C3 focused on comparison with all learners. Thus, these results suggest that learners concentrated on particular parts of the dashboard based on the duration of time spent.
The Reading Duration for the Three Clusters on Each View of the Dashboard.

Changes in AR Learning Behaviors and Learning Outcomes of Different Dashboard Usage Patterns
Table 6 illustrates the descriptive statistics of the changes in test scores for the three dashboard usage pattern clusters. The mean, standard deviation, minimum, and maximum values show that each cluster’s score difference varies from one score to the next. For example, the score difference between Post-Test 2 and Post-Test 1, the mean value (3.33) of Cluster 1, was greater than that of Cluster 2 (1.82) and Cluster 3 (1.88). However, the mean value of Cluster 3 (10.75) in the score difference between the delay test and the Pre-test was greater than that of Clusters 1 (6.50) and 2 (9.18). To further compare the differences in scores, ANOVA and post hoc tests were conducted on the test scores of the three clusters. Surprisingly, there were no significant differences among the three clusters of changes between post-test 1 and the pre-test (F[2, 28] = 0.238, p = .79), post-test 2 and the pre-test (F[2, 28] = 0.169, p = .85), the delayed test and the pre-test (F[2, 28] = 1.830, p = .18), or post-test 2 and post-test 1(F[2, 28] = 0.802, p = .46). However, there was a statistically significant difference among the three clusters in the changes between the post-test 2 and delayed test scores (F[2, 28] = 7.317, p < .01). Further post hoc pairwise comparisons revealed that C1 had significantly higher score changes on post-test 2 and the delayed test than C2 and C3 (p < .01). Thus, the retention of knowledge of compound verbs was not as firm in C1 as it was in C2 and C3.
Minimum, Maximum, Mean and SD of the Changes in Total Scores on the Tests.

To determine the changes in AR learning activities that occurred before and after the use of the LAD, the frequency of learning behaviors before and after using the dashboard was calculated (see Table 7). The change in the learning behaviors of C2 showed that the proportion of core verbs learned increased from 14.1% to 18.2% after utilizing the dashboard, whereas the percentage of incorrectly combined cards decreased from 17.3% to 12.8%. After using the dashboard in C3, the proportion of incorrectly combined cards decreased significantly from 20% to 10.9%. However, in C1, there was no change in the ranking of behavior proportion after using the dashboard.
The Percentage of Each AR Learning Behavior Frequency Before and After Dashboard Use.

LSAs were conducted of the AR learning behaviors before and after LAD use to determine the adjusted residuals for behavioral transitions. The adjusted residuals for learning behavior before and after using the dashboard of C1, C2, and C3 are presented in Tables A1 to A6 of Appendix A. Sequences of AR learning behaviors that reached the p = .05 level of significance (i.e., an adjusted residual > 1.96; Bakeman & Gottman, 1997), were plotted for behavioral transitions before and after the use of the dashboards for C1, C2, and C3 (Figure 5). As shown in Figure 5, the learning behavior pattern before LAD use was essentially the same for C1, C2, and C3, except that S→C (restarting learning from the core verb after stopping learning) was not a significant learning sequence for C3.

AR learning behavioral transitions for before and after dashboard usage for C1, C2, and C3.
Regarding changes in learning behavioral patterns, after using the LAD, C1 learners no longer observed the two-way transition between learning the core verb and incorrect combination (I←C), which is contradictory to the proportion of behaviors. This result suggests that after viewing the LAD, which relies mainly on personal learning data, learners no longer make repeated attempts to validate the various possible combinations of core verbs. Notably, there were no statistically significant differences in the changes in AR behavioral transitions before and after dashboard use in C2. The learners who concentrated on the learning process did not change their behavior patterns during the AR learning activities. However, the increase in the proportion of learned core verbs and the decrease in incorrect combinations indicate that learners mastered the rules for combining core verbs through visualization of the learning process and performed combinatorial behaviors around the core verb combinations. In C3, incorrect combination after learning the core verb (C→I) was not observed after LAD use. Also, the behavioral pattern of restarting learning from basic verbs (S→B) before using LAD shifted to restarting learning from core verbs (S→C) after using LAD. These results demonstrate that learners reduced the behavior of incorrectly combining verbs with core verbs and focused on the adjusted learning activities on the core verbs, mainly after comparing their learning data with those of other learners.
Changes in Metacognition Awareness of Different Dashboard Usage Patterns in the AR Language Learning Environment
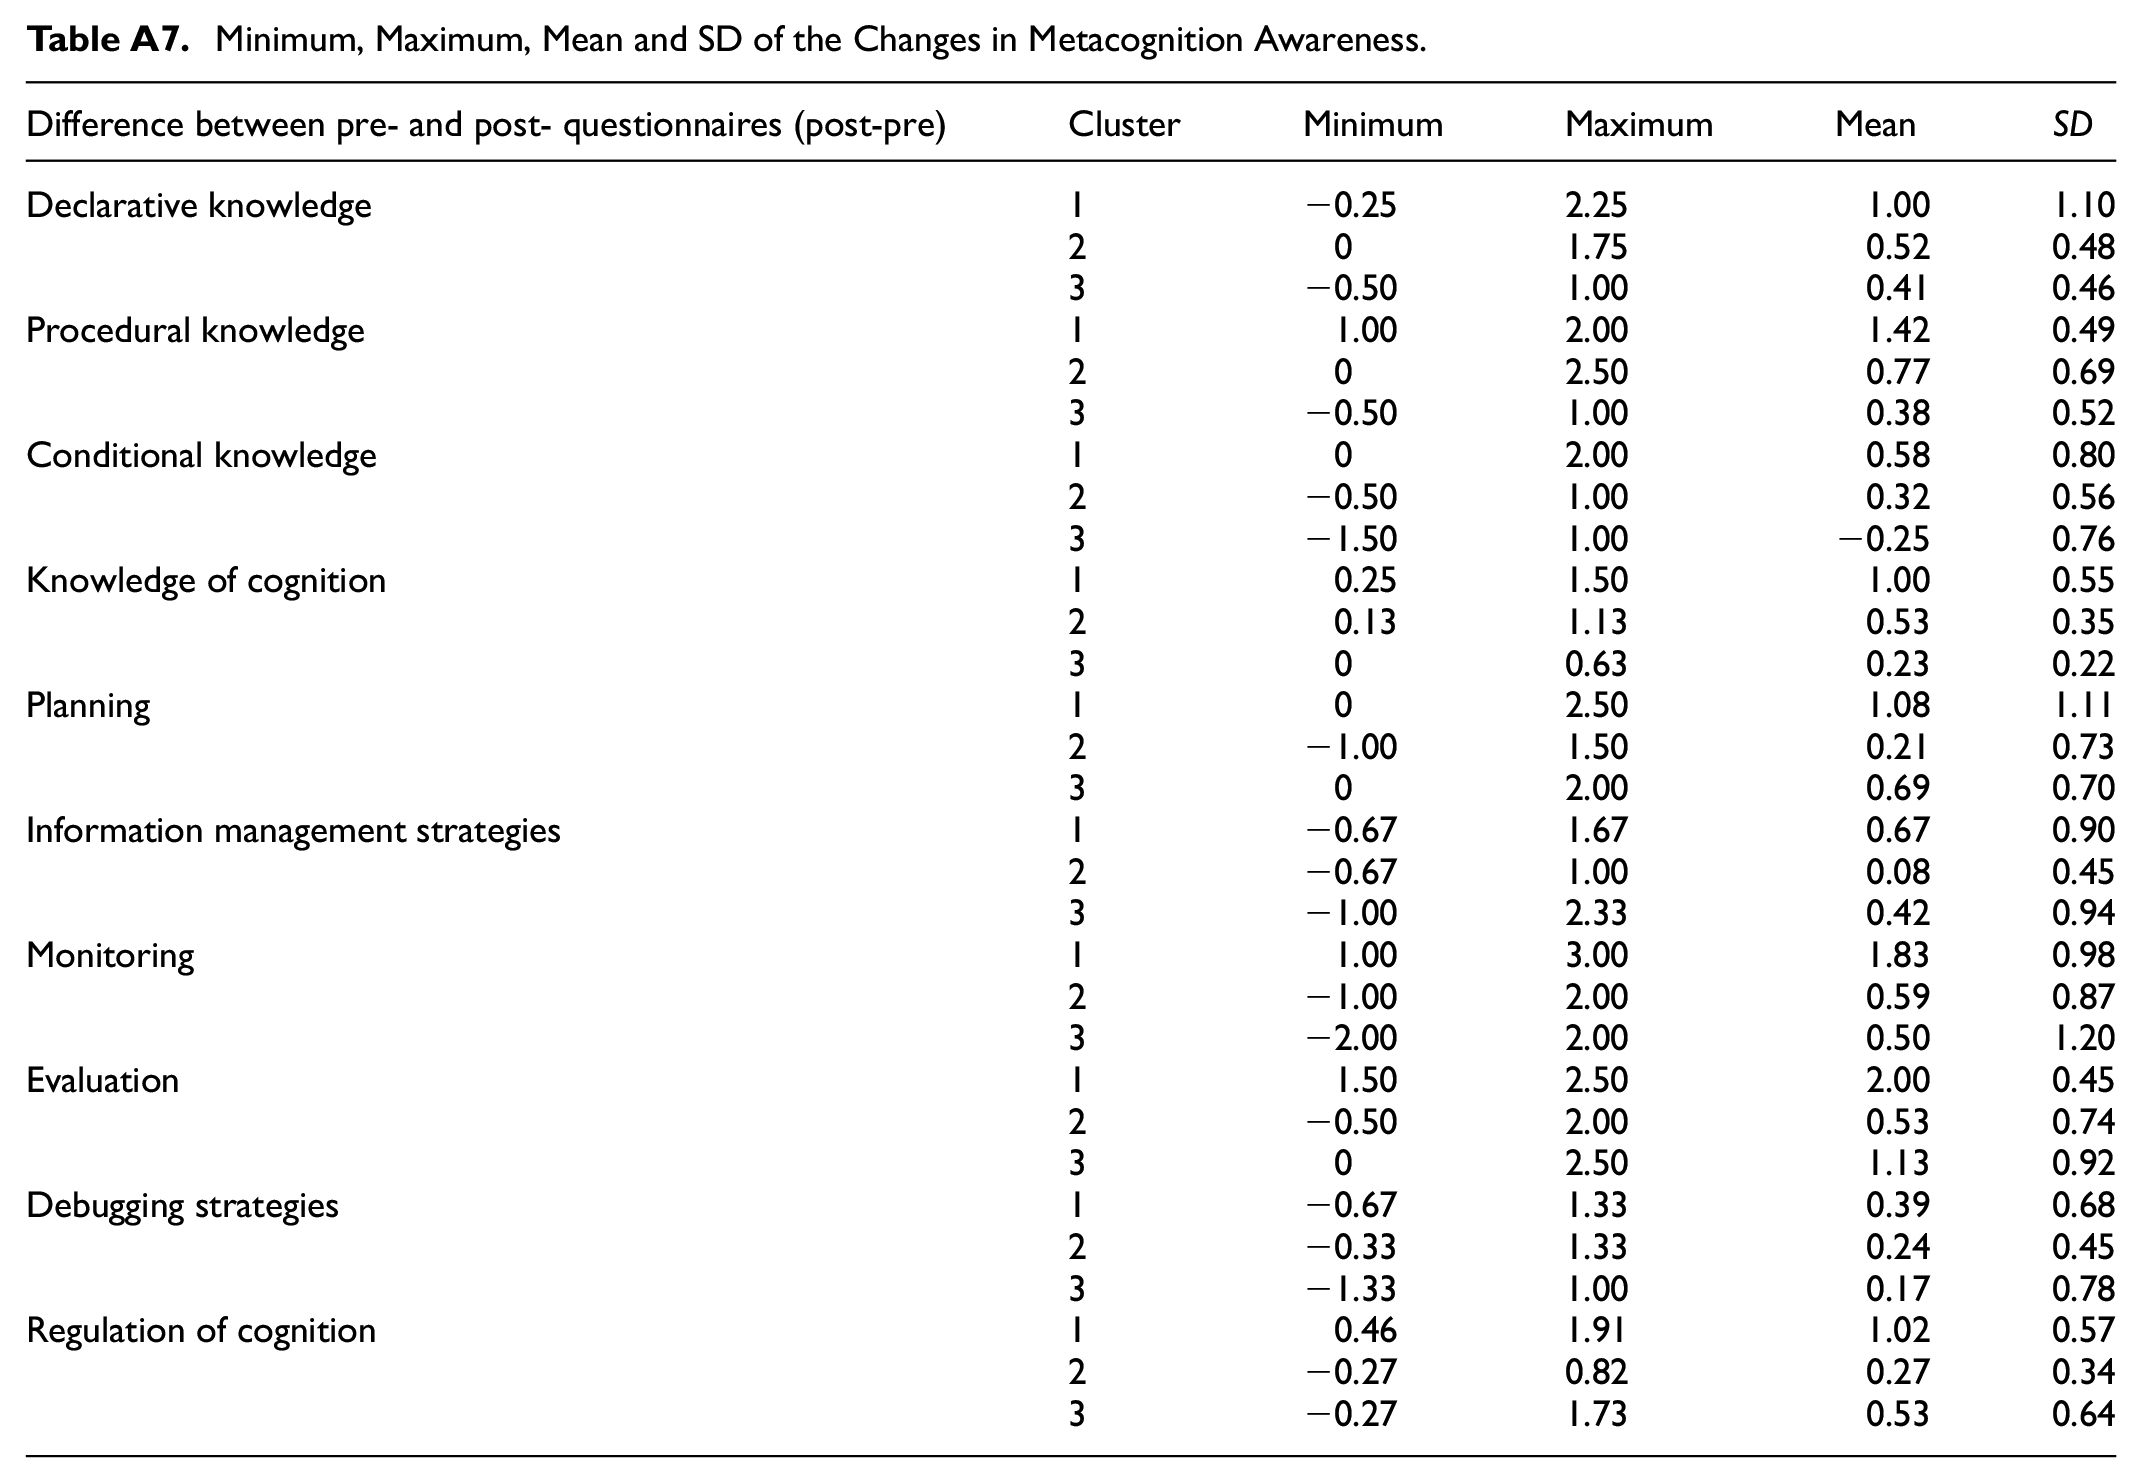
To determine the change in metacognitive awareness of learners with different LAD usage patterns, the change in metacognitive awareness was first calculated by subtracting the responses of the pre-questionnaire from the post-questionnaire. The Table A7 of Appendix A presents the descriptive statistics of changes in metacognitive awareness for the three clusters of dashboard usage patterns. The results of the ANOVA indicated significant differences between the three clusters in knowledge of cognition (F[2, 28] = 7.537, p < .01) and regulation of cognition (F[2, 28] = 5.482, p < .01), as well as statistically significant differences in procedural knowledge (F[2, 28] = 4.927, p < .05), monitoring (F[2, 28] = 4.097, p < .05), and evaluation (F[2, 28] = 8.841, p < .01). Post hoc tests were performed to further confirm the differences between the three clusters, showing that C1 was higher than C2 and C3 in knowledge of cognition (C1 > C2: p < .05; C1 > C3: p < .01) and C1 was higher than C2 in regulation of cognition (p < .01). The results also demonstrated that C1 was higher than C3 in procedural knowledge (p < .05), and higher than C2 in monitoring and evaluation (monitoring: p < .05; evaluation: p < .01). Surprisingly, compared with other usage patterns, learners who concentrated on personal learning data on the LAD increased their metacognitive awareness the most.
Discussion
Regarding RQ1, the results of this study illustrate that using the LAD in an AR language learning environment improved learning outcomes, as evidenced by comparing performance before and after the implementation of the LAD. Before using the LAD, learners had already improved their understanding of Japanese compound verbs with the AR system, aligning with previous research (Parmaxi & Demetriou, 2020; Weerasinghe et al., 2022). Notably, this understanding of compound verbs was further deepened by the integration of the LAD into their learning processes. Furthermore, the implementation of LAD enhances learners’ metacognitive awareness. This finding indicates that the LAD effectively facilitated learners in tracking their learning process and fostering reflection, and that by offering visualization of their own learning data and comparisons with other learners, it might lead learners to adopt enhanced metacognitive language learning strategies, contributing to their more effective learning of compound verbs. This suggests that the overall design of the LAD, which includes personal learning data, social comparison, and learning process visualization, was effective. Kim et al. (2016). noted that visualization using only personal learning data primarily helped learners understand their current state of learning but was not very effective in guiding future learning improvements, additional scaffolding is required. In this study, the combination of personal learning data with social comparison and learning process visualization provided learners with directions and detailed insights for improvement and reflection. The interview of Learner S regarding the LAD was: “Personal learning data can help in understanding the current learning progress to inform the next learning plan; comparison with other learners can help identify one’s own deficiencies to target learning effectively; and the final visualization of the learning process provides more details for reflection, such as which verbs need to be reviewed.” This aligns with Karaoglan Yilmaz (2022), who showed that LAD enhances metacognitive awareness and academic performance by supporting learners in monitoring their learning activities, pinpointing difficulties, and implementing corrective measures. This indicates that the LAD effectively addresses the challenge of concurrent multitasking in AR learning environments, thereby facilitating opportunities for monitoring and reflecting upon the learning process. This finding was also corroborated by the results of interviews with multiple learners. One of the learners D stated, “Using the tool (LAD), I was able to see which verbs I have learned and which words I have not yet learned. Instead of memorizing the number of words I am currently learning, I have more time to focus on the AR content itself.” This result aligns with the findings of Xing et al. (2023), who reported that visualizing learning data through dashboards can increase the time learners engage with AR learning content, thereby improving learning outcomes. In terms of the subdimensions of metacognitive awareness, LAD usage notably enhanced not only declarative and procedural knowledge but also planning, information management strategies, monitoring, evaluation, and debugging strategies. These enhancements indicate the potential of LAD as a tool in aiding learners to understand what knowledge they need and how to learn it, how to process and organize information effectively, and how to achieve and optimize self-learning through planning, monitoring, and evaluation (Jivet et al., 2017). Contrary to expectations, no significant enhancement in conditional knowledge was observed after LAD use. This indicates the need for LAD to incorporate more scaffolding to boost students’ understanding of the appropriate contexts (when and why) for applying specific knowledge or strategies. For instance, more targeted learning strategies are provided to learners through LAD based on prior knowledge of the learning content and conditional judgments (Wiedbusch et al., 2021).
In response to RQ2, our study found that learners in the AR language-learning environment exhibit varied usage patterns of the LAD dashboard, indicating preferences for different dashboard components. This variation highlights the importance of examining which LAD components are most attended to by learners, as effective learners tend to focus on the information they need in the LAD (Kokoç & Kara, 2021). The results of the learning outcomes indicate that learners who concentrate on their personal learning data may find that their acquired knowledge is more susceptible to being forgotten and is not as robustly retained as that of learners who emphasize social comparison and the learning process. This could be due to learners who concentrate on personal learning data on the dashboard did not make much effort to monitor and reflect on the visualization of their personal learning data, resulting in knowledge being insufficiently acquired and subsequently forgotten. The visualization of personal learning data has the abstract presenting the essentials that reduce the process of reasoning about learners’ cognitive effort, thus making knowledge retention less firm (Charleer et al. 2016). In contrast, the social comparison of learning data and visualization of the learning process require learners’ cognitive efforts to thoroughly comprehend their own understanding and how it differs from that of their peers (Venant et al., 2016). The social comparison component allows for an assessment of one’s learning against others, offering a chance to pinpoint shortcomings, thus encouraging deeper reasoning and reflection about one’s learning (Kokoç & Kara, 2021). Additionally, the visualization of the learning process allows aspects related to sequencing learning behavior to be observed and also indirectly reveals the learner’s difficulties (Sedrakyan et al., 2020).
The analyses of AR learning behaviors before and after LAD use further elucidate how learners with varying LAD usage patterns refine their learning following the adoption of LAD (RQ3). Regarding the learners who concentrate on personal learning data, after using the dashboard, learners no longer observed the two-way transition between learning the core verb and incorrect combination (I←C), which is contradictory to the proportion of behaviors. This may be due to learners who mainly used personal learning data not reasoning and reflecting sufficiently while using the dashboard, leading to repeating incorrect combinations displayed in Views 3 and 4 in short-term memory during the AR activity. No further attempts were made at incorrect combinations of the core verbs. This inference was supported by the interview with learner F of C1, “Since it had already been confirmed in the parts (personal learning data) which were the words that I often combined incorrectly, I wanted to validate and strengthen my memory again.” Although learners who focused on the learning process did not change their behavioral patterns during the AR learning activity, the increased proportion of correctly learned core verbs and the reduction in incorrect combinations suggest that they had internalized the rules for combining core verbs. This mastery is likely due to the visualization of the learning process, which facilitates combinatorial behaviors around core verb combinations. Furthermore, learners who concentrated on comparison with all learners changed their learning behavior by comparing personal learning data to the average learning data of all learners after utilizing LAD, thereby reducing the incorrect combinations started by core verb learning (see Table 6). The behavioral changes of resuming after a basic verb (S→B) becomes restarting after a core verb (S→C) also provides important evidence for learners who concentrated on social comparison and understood the concept of core verbs. Learners facilitated their reflection as they engaged in the social comparison process (Venant et al., 2016). Behavior and knowledge retention following LAD usage is frequently the result of reflections (Jivet et al., 2017).
In addressing RQ4, our findings revealed that although there was a significant improvement in learners’ metacognitive awareness after employing the LAD, it was unexpected that learners focusing on personal learning data showed greater knowledge of cognition than those who primarily engaged in social comparison and learning process visualization. Specifically, personal learning data utilization may be more conducive to enhancing procedural knowledge, especially when compared to social comparisons. This indicates that summarized personal learning data can more effectively aid learners in refining their understanding and awareness of their cognitive processes through a relatively intuitive dashboard design. For instance, by using Views 2, 3, and 4, learners determine the need to increase the duration and frequency of certain learning activities. Conversely, the social comparison component of the dashboard requires learners to independently ascertain the areas that require optimization. Learners’ feedback revealed confusion about whether a higher-than-average or lower-than-average time dedicated to learning compared to all learners indicated a need for adjustment. Moreover, those who focused on personal learning data demonstrated greater improvements in the monitoring and evaluation aspects of cognitive regulation than those who relied on learning process visualization. This finding unexpectedly contradicts the expectations of the experiment. It appears that visualizing the learning process by graphically representing learning behaviors in sequence, frequency, and timing might not be as impactful in fostering awareness for monitoring and evaluating learning as personal learning data visualization because of the absence of additional helpful scaffolding that assists in making judgments about monitoring and evaluation.
However, learners who focused on their personal learning data exhibited the greatest increase in metacognitive awareness; however, there was no corresponding shift in their behavioral percentage rankings or more robust retention of language knowledge. This finding suggests that some learners, despite improved metacognitive awareness from using LAD, might not effectively engage in deep metacognitive reflection on their learning, and might only optimize learning activities based on LAD recommendations without adequate cognitive effort, resulting in weak knowledge retention. Wiono et al. (2021) analyzed the impact of metacognitive awareness on college students’ learning outcomes and found that metacognitive awareness did not significantly influence learning achievement. This could stem from the fact that an increase in metacognitive awareness merely indicates that learners are more cognizant of their metacognitive processes. However, without the effective application of metacognition, this awareness does not necessarily lead to improved learning outcomes, potentially due to production deficiencies and other factors (Ozturk, 2018). Metacognitive activity includes more than just awareness; it also involves the cognitive effort exerted during the learning process. Schnaubert and Schneider (2022) pointed out a correlation between cognitive effort and metacognitive processes: The more cognitive effort learners invest, the more capable they become in enhancing their metacognitive judgments about their learning, which in turn allows for a more accurate self-assessment of learning needs and a comprehensive understanding of the learning process. This implies that if dashboards are designed solely to enhance metacognitive awareness, translation into significant learning outcomes may not be guaranteed.
Overall, the findings of this study substantiate the effectiveness of employing LAD in AR learning environments, particularly in terms of learning outcomes and metacognitive awareness. These results contribute significantly to the perspective that integrating LAD into AR learning environments meets the challenges of concurrent multitasking by providing a means of learner monitoring and reflection. Furthermore, by examining alterations in AR learning behaviors, variances in learning outcomes, and metacognitive awareness across different LAD usage patterns, pieces of evidence are provided to elucidate why LAD proves effective. This suggests that similar dashboard systems may be beneficial in other AR learning environments. For example, implementing a LAD during inquiry-based activities in science education using AR could help students better monitor their progress, reflect on their learning processes, and alleviate the multitasking challenges inherent in AR learning. Moreover, these findings provide valuable insights into the design of LADs in educational settings. Educators and instructional designers should consider incorporating these components into their LADs, as each component has unique utility in supporting learners. For instance, personal learning data visualizations may be more effective in enhancing procedural knowledge, while social comparison elements are critical for motivating learners and encouraging self-reflection. In particular, for the social comparison component, it is vital to equip learners with procedural knowledge that enables them to optimize learning using strategies after making comparisons, and not just to display comparative results. Also, learning process visualization components can be used to track complex, multi-step tasks (e.g., learning grammar rules or constructing complex sentences in a new language), and visualizing learners’ progress through a dashboard can help them reflect on their learning strategies. To visualize the learning process, it is essential not only to depict the process in a graphically straightforward and comprehensible manner, but also to offer scaffolding that facilitates the examination and reflection of their learning actions and strategy effectiveness, such as a learning prompt, which could encourage learners to plan and reflect, thereby enhancing their learning activities (English & Kitsantas, 2013). Finally, regarding the components that summarize personal learning data, it is advisable to prompt learners to use them in tandem with other LAD components, ensuring that they engage with the LAD with sufficient cognitive effort.
Conclusion and Future Research
In this study, an LAD was developed to facilitate language learning and metacognitive awareness using an AR language learning system. Based on the examined learning outcomes and metacognitive awareness of LAD, this study also examined the evolution of learning behaviors, outcomes, and metacognitive awareness before and after LAD by employing three LAD usage patterns. The findings reveal that learning outcomes, knowledge of cognition, and regulation of cognition in metacognitive awareness were all significantly enhanced after LAD use. The results of deeper analyses demonstrated that learners who focused on the learning process and social comparison of the dashboard had better knowledge retention than those who concentrated on personal learning data. However, learners who concentrated on personal learning data showed the most significant increase in metacognitive awareness following LAD engagement. Therefore, this study contributes significantly to the field of LA by providing evidence that the integration of LAD into AR learning environments can meet the multifaceted challenges posed by concurrent multitasking, thus facilitating a more monitored and reflective learning experience. It also offers critical insights into the design of LAD, stressing the importance of combining dashboard components with cognitive efforts to ensure that metacognitive awareness is effectively harnessed to improve learning outcomes. Our findings extend the application of SRL theory to AR language learning contexts, suggesting that LADs can serve as effective tools for promoting metacognitive awareness and self-regulation in these novel learning environments.
The findings of this study have several practical implications for educators and developers of educational technology. The effectiveness of LADs in AR language learning environments suggests that similar tools could be beneficial in other AR-based educational settings. The insights on different LAD usage patterns can guide the design of more effective dashboard systems, emphasizing the importance of learning process visualization and social comparison features. Additionally, the unexpected relationship between metacognitive awareness and learning outcomes highlights the need for external scaffolding to guide students in applying their metacognitive skills. This study proposes the following guidelines for designing effective LADs specifically for AR language learning contexts. First, integrating the different components of the LAD, rather than focusing on a single component, ensures that the use of the LAD requires sufficient cognitive effort. Second, designing visualizations that reflect the overall progress of language learning, such as vocabulary mastery rates within the AR environment, is crucial. Third, the learning data included in the LAD should encompass metrics that capture learner interactions with AR elements, such as the frequency of contact with physical objects. Fourth, when presenting comparative data, guidance on interpreting the information needs to be provided. Finally, the visualization of the learning process should include learning prompts that encourage learners to reflect on their language learning strategies.
However, there are several limitations that must be acknowledged. First, the participant sample, while diverse, primarily consisted of Chinese international students with intermediate Japanese proficiency, which may limit the generalizability of the findings. Further research should aim to include a larger and more varied participant pool, encompassing learners of different mother languages, to better understand the effects of AR language learning environments and LAD on a broader population. Another limitation lies in the experimental design. Although this study had a pre-post experimental setup, the absence of a comparative experimental or quasi-experimental design makes it difficult to establish causal relationships between LAD components, learning outcomes, and metacognitive awareness. Further studies employing these experimental designs could offer more robust evidence and validate the preliminary insights. Moreover, the novelty effect of using AR and LAD technology may have also temporarily enhanced learner engagement and performance, an effect that may not persist in longer-term learning environments. Therefore, extending the duration of the experiment and incorporating longitudinal studies would be crucial to observing the sustained impact of LAD on learning outcomes. Additionally, the present study relied on a self-report measure of metacognitive awareness using the MAI, which, while a validated instrument, may introduce bias as participants may overestimate or underestimate their regulation and knowledge of cognition. Lastly, this study provides initial direction for future LAD design, and further research should be conducted to validate the effectiveness of these insights. For instance, future research could explore whether incorporating learning prompts related to the learning process effectively aids learners in monitoring and reflecting on their own learning.
Footnotes
Appendix A
Minimum, Maximum, Mean and SD of the Changes in Metacognition Awareness.
| Difference between pre- and post- questionnaires (post-pre) | Cluster | Minimum | Maximum | Mean | SD |
|---|---|---|---|---|---|
| Declarative knowledge | 1 | −0.25 | 2.25 | 1.00 | 1.10 |
| 2 | 0 | 1.75 | 0.52 | 0.48 | |
| 3 | −0.50 | 1.00 | 0.41 | 0.46 | |
| Procedural knowledge | 1 | 1.00 | 2.00 | 1.42 | 0.49 |
| 2 | 0 | 2.50 | 0.77 | 0.69 | |
| 3 | −0.50 | 1.00 | 0.38 | 0.52 | |
| Conditional knowledge | 1 | 0 | 2.00 | 0.58 | 0.80 |
| 2 | −0.50 | 1.00 | 0.32 | 0.56 | |
| 3 | −1.50 | 1.00 | −0.25 | 0.76 | |
| Knowledge of cognition | 1 | 0.25 | 1.50 | 1.00 | 0.55 |
| 2 | 0.13 | 1.13 | 0.53 | 0.35 | |
| 3 | 0 | 0.63 | 0.23 | 0.22 | |
| Planning | 1 | 0 | 2.50 | 1.08 | 1.11 |
| 2 | −1.00 | 1.50 | 0.21 | 0.73 | |
| 3 | 0 | 2.00 | 0.69 | 0.70 | |
| Information management strategies | 1 | −0.67 | 1.67 | 0.67 | 0.90 |
| 2 | −0.67 | 1.00 | 0.08 | 0.45 | |
| 3 | −1.00 | 2.33 | 0.42 | 0.94 | |
| Monitoring | 1 | 1.00 | 3.00 | 1.83 | 0.98 |
| 2 | −1.00 | 2.00 | 0.59 | 0.87 | |
| 3 | −2.00 | 2.00 | 0.50 | 1.20 | |
| Evaluation | 1 | 1.50 | 2.50 | 2.00 | 0.45 |
| 2 | −0.50 | 2.00 | 0.53 | 0.74 | |
| 3 | 0 | 2.50 | 1.13 | 0.92 | |
| Debugging strategies | 1 | −0.67 | 1.33 | 0.39 | 0.68 |
| 2 | −0.33 | 1.33 | 0.24 | 0.45 | |
| 3 | −1.33 | 1.00 | 0.17 | 0.78 | |
| Regulation of cognition | 1 | 0.46 | 1.91 | 1.02 | 0.57 |
| 2 | −0.27 | 0.82 | 0.27 | 0.34 | |
| 3 | −0.27 | 1.73 | 0.53 | 0.64 |
Acknowledgements
Not applicable.
Ethical Considerations
The research was carried out following the ethical guidelines of the Japan Science and Technology Agency. Informed consent was obtained from all individual participants included in the study. All procedures used in this research were approved by Kyushu University.
Authors’ Contributions
Xuewang Geng designed and developed the augmented reality system and the dashboard, conducted the experimental design and implementation, data analysis, and wrote the final manuscript. Masanori Yamada conducted the experimental design and supervised this research overall. All authors read and approved the final manuscript.
Funding
The author(s) disclosed receipt of the following financial support for the research, authorship, and/or publication of this article: This study is funded by Japan Society for the Promotion of Science (JSPS) (Grant Numbers: 25K17079, 22H00552, 21KK0184, and 21K18134) and the Telecommunications Advancement Foundation. Masanori Yamada received research grants from JSPS and JST for other research projects.
Declaration of Conflicting Interests
The author declared no potential conflicts of interest with respect to the research, authorship, and/or publication of this article.
Data Availability Statement
All data generated or analyzed during this study are included in this article.