
Abstract
Digital development enhances the mobility of capital factors in urban networks. The mismatch between the supply of capital factors and the demand for urban development limits the improvement of investment efficiency, while the interaction between digital policies and network externalities will have an important impact on the efficiency of urban capital allocation. Based on the data of Chinese prefecture-level cities from 2005 to 2022 and the synthetic difference-in-difference model, this paper explored the capital lock-in mechanism of the National Big Data Comprehensive Pilot Zone (NBDCPZ) policy from three dimensions: consumer market, production division and business environment. The results indicated that: (1) the NBDCPZ generally improves the scale and speed of capital allocation in pilot cities, but the effect is different for different batches and cities in different regions; (2) the big data integrated pilot area mainly affected the allocation of local capital factors through momentum conversion, peer competition, and risk mitigation effects; (3) the phenomenon of over-investment caused by “borrowing scale” caused by urban network externalities is relatively common, and the role of NBDCPZ in resolving over-investment in cities with different population sizes and different distances from the central provincial capitals is heterogeneous.
Keywords
Introduction
The alignment between capital factors and regional economic development is evident in the scale of capital supply and the efficiency of its allocation. While China’s investment capacity has grown steadily, making capital the most abundant factor (Zymek, 2015), significant issues remain in its spatial distribution (C. Li, 2010). Due to disparities in financial development across regions and policy-driven credit allocation influenced by information asymmetry, there is a negative correlation between inter-regional capital flows and capital returns (Bleck & Liu, 2018; G. L. Wu, 2018; Zhou & Shao, 2024). The capital misallocation driven by an investment-oriented economic growth model is currently hindering the development of a unified capital market (Ma et al., 2021). Moreover, information asymmetry and administrative intervention in market operations further undermine capital allocation efficiency (Adamopoulos et al., 2022; Restuccia & Rogerson, 2017).
Effectively utilizing digital technology is crucial for transitioning the economic growth model from investment-oriented to efficiency-oriented (Hao et al., 2023; Jing & Fan, 2024). Digital technology eliminates information barriers between regions, but also integrates network collaboration into the capital allocation process (Zhan et al., 2023). By precisely matching capital supply with demand, digital technology reduces information asymmetry and creates economies of scale and scope through digital networks, thereby improving the spatial adaptability of capital. Consequently, conducting in-depth research on the impact of digital technology on the traditional allocation of production factors has become increasingly important (Choi et al., 2014; J. F. Li, 2024). As a “multiplier” of economic growth, the time-space compression effect of digital technology not only enhances the free flow of capital across regions but also facilitates the sharing of market scale and industrial functions among cities through digital collaborative networks (Lu & Hu, 2024). This approach mitigates over-investment within the network and improves capital allocation efficiency, offering significant guidance for enhancing capital market functions and advancing the reform of factor marketization.
Disruptive technological changes are driving the emergence of new industries, business models, and ways of allocating resources (Wang et al., 2023). For the developmental dividends brought by this disruptive technological transformation, it is essential to strengthen innovation and application of digital technologies, thereby enabling effective management and utilization of data resources as a key factor of production (Jones & Tonetti, 2020; Kshetri, 2014). As a kind of progressive reform policy focusing on data system innovation, data element circulation and data industry agglomeration, the NBDCPZ policy will have a positive impact on regional information transparency and digital industry development, thus attracting capital inflow. To advance regional big data infrastructure construction and leverage digital technologies for data resource integration, Guizhou Province initiated the construction of the first NBDCPZ in September 2015. In 2016, the second batch of NBDCPZ was approved, encompassing eight provinces—Beijing, Tianjin, Hebei, Inner Mongolia, Henan, Shanghai, Chongqing, and Guangdong—as well as Shenyang City. During the implementation of these policies, digital technologies have been applied across critical sectors such as finance, education, healthcare, transportation, environmental protection, and public safety. Technologies like cloud computing, blockchain, and 5G have enhanced the capabilities of the pilot zones in data collection, storage, processing, and analysis. By breaking down data silos, these technologies enable cross-departmental, cross-industry, and cross-regional data interoperability, thereby improving the efficiency of data resource utilization (Rengarajan et al., 2022). The application of digital technologies driven by the NBDCPZ will significantly affect people’s production and daily lives, injecting momentum into socio-economic development. As a crucial platform for digital finance applications, the NBDCPZ can enhance dynamic collaboration among entities within the capital chain, generating economic ripple effects in other regions (Huang et al., 2023). Evaluating the spatial capital allocation effects of these policies is vitally important. Such evaluations not only influence current policy promotion strategies but also future policies implementation to support the rapid development of the digital economy.
This paper utilized panel data from Chinese prefecture-level cities spanning 2005 to 2022 to explore the spatial capital allocation effects of NBDCPZ and the role of “borrowing scale” behavior within urban networks. This study has two specific contributions. First, it analyzes the mechanisms of how NBDCPZs influence spatial capital allocation. Digital technology facilitates easier access to policy support and public services for investors. However, it may weaken the attraction of investment from market expansion and inducing unhealthy competition within specialized clusters, thereby diminishing the appeal of investment in these areas. Additionally, the widespread adoption of digital technology has enabled financial institutions to manage credit more precisely for individuals and private enterprises, reducing the investment repulsion effect caused by risks associated with small and microcredit. Second, to address the potential for over-investment stemming from market expansion and specialized division of labor, this paper investigated the heterogeneous effects of urban network connectivity on capital allocation from “performance borrowing” and “functionality borrowing” perspective, as well as the mechanisms of how NBDCPZs influence this process.
The rest of this paper is organized as follows. Section 2 presents the theory and research hypotheses. Section 3 introduces the variables and method. Section 4 is empirical analyses. Section 5 discusses how to resolve overinvestment in NBDCPZ from the dimension of network externality. Section 6 is conclusion and implications.
Literature Review and Research Hypotheses
The efficient allocation of scarce resources has long been a central focus of economic research. As digital technology advances rapidly, new industries and business models continuously emerge (Heo & Lee, 2019), significantly transforming traditional allocation methods. While some research has explored the impact of digitalization on labor, technological innovation and industrial structure (Acemoglu & Restrepo, 2020; H. Chen et al., 2024; Kafouros et al., 2015), the effect on capital allocation remains under-examined. Big data has become a key driver of economic and social transformation, making the development of NBDCPZ a crucial strategy for advancing the big data agenda and fostering the construction of a digital China. As a key platform for digital technology, NBDCPZ has the potential to transform how market participants access information, reshaping resource allocation mechanisms through “incremental supplementation,” and “stock optimization.”“Incremental supplementation” is primarily reflected in the policy’s ability to internally integrate external capital. The NBDCPZ policy promotes the clustering of digital industries, enabling enterprises to access and utilize external resources at lower costs (Wennberg & Lindqvist, 2010). Additionally, the application of digital technologies in the pilot cities enhances the transparency of information in China’s capital markets (Nagaraj, 2022), making it easier to obtain information on investment returns and risks. This, in turn, increases the attractiveness of the pilot cities to global capital. “Stock optimization” is primarily reflected in the policy’s ability to enhance and integrate capital within the domestic market. Financial exclusion barriers reduce the number of individuals and entities able to access financial services (Leyshon & Thrift, 1993). The NBDCPCZ policy promotes the application of digital technologies in the financial sector, expanding the customer base for commercial bank credit offerings and contributing to improved credit returns. Digital technologies enable financial institutions to more accurately identify and assess risk levels, allowing them to promptly detect potential risks and implement risk management measures (Norden et al., 2014).
The development of NBDCPZ has rapidly advanced the digital economy in these regions, fostering effective coordination between capital supply and demand. As the big data industry chain develops, it has attracted more and more investors, expanding external financing channels and increasing capital supply within the economic system (Feng et al., 2022). Digital technology has equipped online platforms with powerful information integration and analysis capabilities (Ferreira et al., 2019). By driving the development of the digital economy, NBDCPZ has facilitated the efficient matching of capital supply and demand, resulting in rapid capital growth within these pilot regions. Accordingly, this paper proposes the first hypothesis.
The mechanisms of spatial allocation have been examined in the existing literature from three key perspectives: overcoming geographical barriers, accelerating the flow of factors, and improving the business environment. First, Furman and Seamans (2019) found that the development of digital technology has, to some extent, broken down administrative regional divisions, enhancing the fluidity of production factors. Second, the application of digital technology facilitates the data, as a new production factor, to be integrated into production, distribution, and consumption processes, significantly expanding the coverage and accessibility of capital. This development alleviates corporate financing difficulties and improves the efficiency of capital markets (Lim et al., 2010; Mollick & Kuppuswamy, 2016). Additionally, improving the overall business environment reduces barriers for economic entities and stimulates regional entrepreneurial activities and small and medium-sized enterprises (Aldrich, 1999; W. H. Chen et al., 2023). As entrepreneurial activity increases, so does the demand for small and micro credit. However, given the high default risk associated with such credit, financial institutions tend to adopt a more prudent lending attitude. The establishment of an innovative big data venture financing system has successfully attracted investment, providing crucial financial support for regional entrepreneurial activities (Bowen & De Clercq, 2008; Otchere et al., 2016). According to existing research on the role of digital technology in capital allocation, we can further infer the mechanisms of how NBDCPZ influences spatial capital allocation.
The implementation of NBDCPZ underscores the significant penetration and strong synergy of the digital economy, particularly in expanding potential market size. Digital technology, with its strengths in efficient information transmission, data mining, and precise matching, has transformed product sales by creating direct connections between producers and consumers through online networks. This transformation allows supply to meet distant demands and enables personalized consumption to accurately guide production, providing more convenient transaction channels for both buyers and sellers (Kim et al., 2017). Enhanced information infrastructure not only shortens circulation time but also broadens the market reach of producers (Lendle et al., 2016; Valarezo et al., 2018). As market participants increasingly integrate into an open and collaborative digital ecosystem, economies of scale, scope, and network effects are more likely to develop within commercial systems (Davidovic, 2014). This fosters a quicker alignment between supply and demand and expands the potential market for products. Consequently, local companies can enhance their profitability, which, in turn, attracts more external investors to the region.
NBDCPZ has significantly altered the competitive environment for businesses due to virtual industrial clusters. This evolution has partially overcome the spatial limitations traditionally associated with resource allocation (P. Yang et al., 2022). The establishment of NBDCPZ has encouraged the local clustering of related industries, where knowledge and technological resources are frequently shared. However, while digital technology facilitates the flow of information, the current inadequacy in digital intellectual property protection allows companies to easily acquire competitors’ knowledge at a low cost (Goldfarb & Tucker, 2019). This could lead to unhealthy competition within the cluster, potentially weakening the investment attractiveness derived from local specialization.
When it comes to controlling credit default risk within NBDCPZ, the networked nature of the digital economy—with its high interconnectedness and positive externalities—facilitates the transfer and aggregation of various factors. The implementation of NBDCPZ accelerates the integration of regional market participants into the digital ecosystem, enabling financial institutions to leverage cloud computing, artificial intelligence, and other advanced information technologies to analyze vast amounts of data. This capability allows for precise customer identification and matching of capital supply with demand, thereby reducing information asymmetry between financial institutions and borrowers (K. Wu et al., 2022). As a result, it effectively mitigates issues of adverse selection and moral hazard that are prevalent in traditional financial markets. This approach addresses the challenge of insufficient credit supply caused by the opacity of information among individual and private market participants in the context of rising market activity. Based on these insights, the paper further proposes three hypotheses regarding the mechanisms of how NBDCPZ influences the spatial allocation of capital.
As digital technology advances, the characteristics of virtual network connections between regions have become increasingly prominent, enhancing economic interactions and evolving agglomeration externalities from regional to network externalities (Meijers et al., 2016). However, extant literature primarily focuses on digital technology from the perspectives of information transmission and technological upgrading, with limited exploration of its network externalities in the factor allocation process. The concept of urban network externalities was first defined by Capello (2000), who suggested that cities benefit from the synergies generated by urban functional networks. This synergy is rooted in the “borrowing scale” behavior occurring among cities (Alonso, 2013). Later studies refined this concept, expanding the definition of “scale” to include both performance and functionality (Meijers & Burger, 2017). “Performance borrowing” allows cities within the collaborative network to achieve levels of agglomeration economies beyond what their own economic density could support, while “functionality borrowing” enhances economic growth by helping cities within the network attain higher industrial functions. In a collaborative urban network, the market size and industrial functionality of neighboring cities become crucial sources of utility for individual cities. The discussion on “network externality” as a factor allocation model is ongoing, with further research needed to integrate “borrowing scale” analysis with regional policy practices and local development. The implementation of NBDCPZ has strengthened network external borrowing behaviors among cities, enabling them to share market scale and coordinate production functions. On this basis, the paper proposes a third hypothesis.
Methodology
Common methods for evaluating policy effects include the Difference-in-Differences (DID) approach and the Synthetic Control (SC) method. The DID is suitable when a large number of individuals are treated, and the parallel trends assumption is met. It controls for selection bias by introducing individual and time fixed effects. On the other hand, the SC method is appropriate when only a single or a small number of individuals are treated. It adjusts the weights of individuals to eliminate pre-treatment trends, thus reducing reliance on the parallel trends assumption. In addition, the Synthetic Difference-in-Differences (SDID) method combines the strengths of both DID and SC. It is particularly suitable for evaluating policy effects in cases where the treated group consists of multiple individuals and their pre-treatment trends are not consistent. This section first introduces the SDID method, followed by a discussion of the selected variables and data.
Synthetic Difference-in-Differences Method
The Synthetic Difference-in-Differences (SDID) method, first introduced by Arkhangelsky et al. (2021), was developed to study the impact of California’s Proposition 99 anti-smoking law on per capita cigarette consumption. The basic principle of the SDID method is to introduce individual and time weights to match the pre-treatment trends between the treated and control groups. This approach balances the pre-treatment and post-treatment periods, thereby reducing the method’s reliance on the parallel trends assumption in policy evaluation. Additionally, using only similar individuals and time periods means that the SDID estimates are robust and precise. The steps for implementing the SDID method are as follows: (1) define and minimize the problem of individual and time weighting; (2) determine the appropriate individual and time weights; (3) calculate the double difference between the treated units and the synthetic control units to evaluate the policy effect. Accordingly, this paper will apply the principles and procedures of the SDID method to assess the impact of national NBDCPZ on the allocation of capital factors.
Let

In Equation 1, Ki,t represents the capital allocation for city i at time t, with

To satisfy the parallel trends assumption, the weighted average outcome for the control group should closely approximate the arithmetic mean outcome for the treated group in each period around the time the NBDCPZ is implemented. Specifically, for cities in the treated group, which have established NBDCPZ, similar control group cities are selected through individual weighting, and greater weight is assigned to these similar controls. The optimal individual weights can thus be derived as shown in Equation 3:

In Equation 3,
Similar to the approach used for determining individual weights, the goal is to ensure that, prior to policy implementation,

In Equation 4,
After determining the individual and time weights, the treatment effect of establishing NBDCPZ on urban capital allocation under the SDID method can be calculated as follows:

In Equation 5,
Variables
This study selects data from 241 prefecture-level cities in China (excluding provincial capitals) from 2005 to 2022 as the sample. Among these, 69 cities where the second batch of NBDCPZ was established in 2016 (with Guizhou Province establishing its zone in 2015) are designated as the treatment group, while the remaining 172 cities are designated as the control group. The variables used in this study are primarily sourced from the annual “China City Statistical Yearbook” and “China Statistical Yearbook.” Missing data is supplemented from the corresponding cities’“Statistical Bulletin of National Economic and Social Development,” and any remaining missing data is imputed using interpolation.
This paper primarily examines the spatial allocation effects of capital in NBDCPZ. Following the approach of related studies, the dependent variables used to measure the quantity of capital allocation and the rate of capital expansion in a city are the year-end balance of loans from financial institutions (loan) and the growth rate of city loans (rate). The key explanatory variable in this study is the NBDCPZ (Policy), which is assigned a value of 1 for cities that implemented the policy in the corresponding year and subsequent years, and 0 otherwise. In the mechanism examination section, the variables representing the mechanisms include market size, specialization, and market dynamism. Market size (lnms) is measured by the total retail sales of consumer goods; specialization (div) is proxied by the level of urban specialization and agglomeration (Yu et al., 2022), where a higher level indicates a clearer division of functions within the city, facilitating a division of labor with other cities; market competition dynamism (mc) is represented by the ratio of individual and private sector employment to total employment (H. Li et al., 2012). These variables allow for an examination of the impact of NBDCPZ on the spatial allocation of capital from the perspectives of the consumer market, production specialization, and business environment. Additionally, other covariates include the level of economic development (lngdp) and population size (lnpop). The control variables, per capita road area and per capita green area, are log-transformed after adding 1, resulting in ln (road+1) and ln (gre +1) as proxy variables. The description of the variables is shown in the Appendix 1. Descriptive statistics for the relevant variables are presented in Table 1.
Descriptive Statistics.

Results
The empirical analysis of the spatial capital allocation effects of NBDCPZ in this paper is structured as follows: First, the SDID method was employed to examine the impact of establishing NBDCPZ on the spatial distribution of capital in the sample cities. Next, the robustness of the conclusions was tested by applying alternative empirical methods, conducting policy timing and city-specific placebo tests, and excluding the interference of other policy factors, thereby enhancing the persuasiveness of the findings. Finally, a moderation effect model was utilized to explore the mechanisms through which NBDCPZ influences urban capital allocation.
Capital Allocation Effects of NBDCPZ
In Figure 1, the solid line represents the capital allocation scale in provinces where the NBDCPZ was implemented, while the dashed line represents provinces where the policy was not implemented. The vertical line indicates the start year of the NBDCPZ (2015 or 2016). Prior to the policy implementation, the SDID method was used to align the capital allocation trends of the treated and control cities, thereby ensuring the “parallel trends” assumption necessary for applying the DID method. Specifically, after Guizhou Province established the first NBDCPZ in 2015, its capital allocation effect gradually became more pronounced compared to the control cities, indicating that the establishment of the NBDCPZ enhanced capital allocation in the region. The capital allocation effect of the NBDCPZ implemented in 2016 in provinces such as Hebei, Henan, and Inner Mongolia and other provinces is less visually apparent in Figure 1.
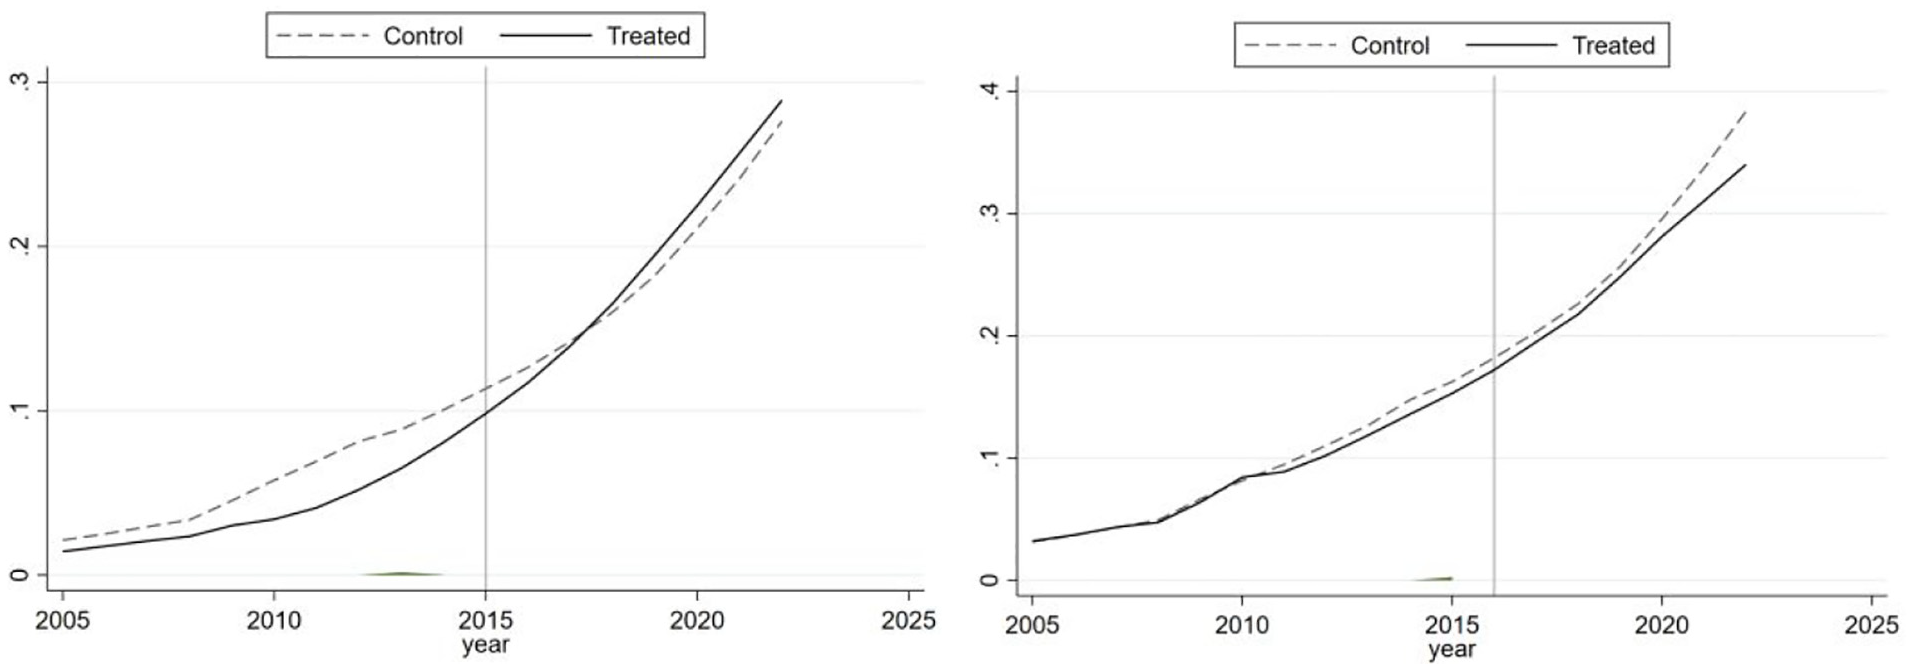
The capital allocation effect of different batch of NBDCPZ.
On the whole, the NBDCPZ policy has generally increased local capital allocation, though the magnitude of this increase varies. In the case of Guizhou, which was prioritized in establishing the first NBDCPZ, the concentrated support from various levels of government significantly attracted capital to the region. In contrast, the capital allocation effects of the second batch of provinces are less pronounced. This could be due to the inclusion of provinces with varying levels of economic development from the eastern, central, and western regions of China, leading to heterogeneous policy impacts across these areas. To disentangle the heterogeneity of the capital allocation effects from the overall impact, the following sections will further explore the heterogeneity of the policy effects.
Baseline Results
This paper employs the SDID method to analyze the capital allocation effects of NBDCPZ, with the baseline estimation results presented in Table 2. As shown in the table, the implementation of the NBDCPZ policy significantly increased the year-end balance of loans from financial institutions at the 5% significance level, indicating an expansion in the local capital allocation scale. Additionally, the policy significantly accelerated the capital aggregation speed at the 10% significance level, demonstrating a stimulus effect on the rapid concentration of capital in the region. The baseline estimation results for the sample cities confirm the effectiveness of the NBDCPZ in both expanding the scale and accelerating the speed of capital allocation. The second batch of cities selected for the NBDCPZ in 2016 encompassed regions in eastern, central, and western China. However, due to significant disparities in market size, industrial structure, and infrastructure development across these regions, the capital allocation effects of the second batch of policies were, on the whole, not significant.
Baseline Results of NBDCPZ Policy Affecting Capital Allocation.

Note. Standard errors in parentheses.
, **, and * Indicate statistical significance at the 1%, 5%, and 10% levels, respectively.
Robustness Test
PSM Test
Propensity Score Matching (PSM) is a method used to treat research data as if it were from a “randomized controlled experiment,” with the aim of reducing bias and confounding factors. Following Z. Yang et al. (2022), this study calculates propensity scores using the average values of variables such as economic development level, population size, per capita road area, and per capita green area for the 2005 to 2022 sample. The k-nearest neighbor matching method (k = 1) is then employed to match samples with similar propensity scores, resulting in a control group with characteristics similar to those of the treatment group. To verify the reliability of the propensity score matching results, a balance test was conducted in Table 3. The results indicate that the standardized biases of most covariates after matching are less than 10%, suggesting that the selected covariates and matching method are reliable. Additionally, the t-test results do not reject the null hypothesis, indicating no systematic differences between the treatment and control groups.
Balance Test for PSM Results.

Building on the PSM results, Model (1) was estimated, with the results presented in Table 4. When all control variables were included, the estimated coefficient for lnloan is approximately 0.022, and it is significant at the 5% level. This indicates that, compared to the control group cities, the treated cities under the NBDCPZ have a significantly larger scale of capital allocation. Similarly, the estimated coefficient for rate is 0.012, also significant at the 10% level, indicating that the capital aggregation speed in the NBDCPZ cities is faster than in non-policy trial cities. These findings further confirm the effectiveness of the NBDCPZ y in enhancing both capital allocation scale and capital aggregation speed.
PSM-DID Test.

Note. Standard errors in parentheses.
, **, and * indicate statistical significance at the 1%, 5%, and 10% levels, respectively.
Placebo Tests
City-Specific Placebo Test
Following Pan et al. (2022), a random sampling regression method was employed by randomly generating 700 treatment groups to test the non-randomness of the NBDCPZ effect and to identify the impact of other non-policy factors on the estimation results. Based on the actual annual implementation of the NBDCPZ, we randomly generated cities designated as pilot zones at the same proportion, thereby producing erroneous estimates for the core explanatory variable. The regression was then repeated 700 times, and a distribution of 700 erroneous core explanatory variable estimates was plotted to identify the policy effect. Figure 2 illustrates the related results.

City-specific placebo test.
Based on the results shown in Figure 2, it is evident that the 1,000 erroneous core explanatory variable estimates are concentrated around the value of 0, following a normal distribution. The true estimated coefficient, however, stands out as an outlier, which is consistent with the expectations of a placebo test. These results indicate that the previously identified effects of the NBDCPZ are not randomly occurring, confirming the robustness of the main conclusions.
Policy Timing Placebo Test
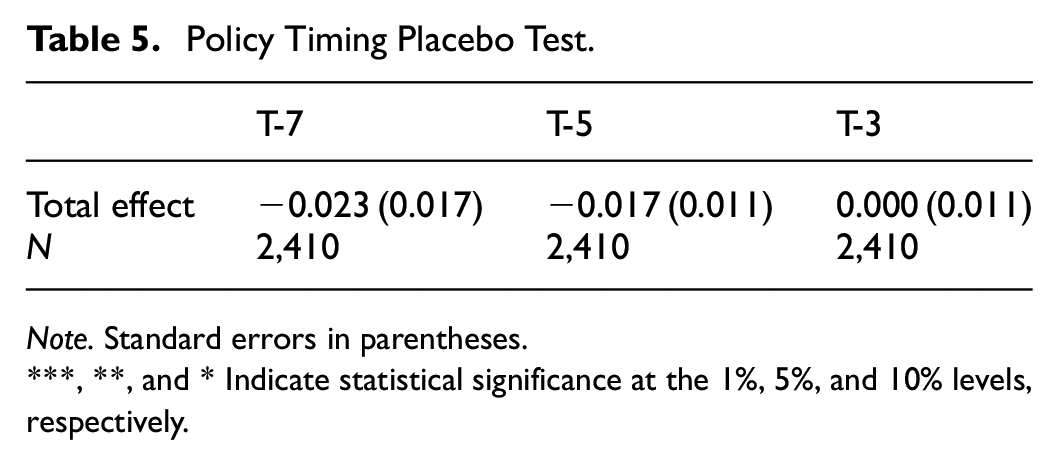
Following the approach of Topalova (2010) for conducting a policy timing placebo test, the event is hypothetically set in a period before 2015, with the policy implementation period altered and the sample period defined as 2005 to 2014. This approach examines whether there is still an effect of increasing local capital allocation. The premise for effectively evaluating the policy is that there should be no significant differences in capital allocation across different cities before the policy event occurs. Therefore, if the policy event is assumed to have occurred before 2015, the estimated coefficient of the policy effect should be insignificant. However, if the results remain significantly positive after changing the policy timing, it will imply that there are some other unobserved factors, apart from the NBDCPZ, that also contribute to the capital allocation effects in the sample cities.
To ensure the robustness of the empirical results, the policy implementation time was moved forward by 7 years (T-7), 5 years (T-5), and 3 years (T-3). Specifically, the policy implementation time for the first batch of NBDCPZ was set as 2008, 2010, and 2012, respectively, while the corresponding times for the second batch were set as 2009, 2011, and 2013. The estimated results for each adjustment are reported in Table 5. It can be found that the estimated coefficients for the policy effect are not significant, thereby preliminarily ruling out the influence of other potential unobserved factors on the capital allocation in the NBDCPZ sample cities.
Policy Timing Placebo Test.
Note. Standard errors in parentheses.
, **, and * Indicate statistical significance at the 1%, 5%, and 10% levels, respectively.
Excluding the Interference of Other Policies
The study period selected for this paper spans from 2005 to 2022, during which the implementation of other related policies may have introduced bias into the baseline regression results. In 2013, the State Council issued the “Broadband China” strategy implementation plan, which outlined the principles of combining network construction with application services and integrating network upgrades with industrial innovation. This strategy was implemented prior to the NBDCPZ and could also have affected capital allocation. If the long-term effects exist, they may interfere with the capital allocation effects of the NBDCPZ. Therefore, the estimated results in this study may reflect the combined influence of both the NBDCPZ and the “Broadband China” strategy on capital allocation.
Therefore, to eliminate the interference of the “Broadband China” strategy, this paper excludes the city samples covered by the “Broadband China” strategy from the current research sample and conducts a re-examination. The regression results, shown in Table 6, indicate that the overall policy effect of the NBDCPZ remains significantly positive. The capital allocation effects of the NBDCPZ in the remaining regions are consistent with the previous findings. Thus, by excluding the interference from the “Broadband China” strategy, this paper effectively verifies the capital allocation effects of the NBDCPZ and their heterogeneity.
Results of Excluding the Interference of Other Policies.

Note. Standard errors in parentheses.
, **, and * indicate statistical significance at the 1%, 5%, and 10% levels, respectively.
Mechanism Analysis
To further verify the mechanism of how this policy promotes the rapid aggregation of capital into the pilot zones, this paper constructs the following model:

In Equation 6, loani,t is the dependent variable, representing the scale of capital allocation in city i during year t, measured by the year-end balance of loans from financial institutions. Policyi,t is the core explanatory variable, a binary variable indicating whether city i implemented the NBDCPZ in year t. The variables lnmsi,t, divi,t, mci,t represent the three mechanism variables of how the NBDCPZ affects capital allocation: market size, degree of specialization, and market dynamism, respectively. Xi,t represents the covariates that appeared above. To verify the magnitude and underlying mechanisms of how the NBDCPZ promotes capital allocation in different cities, the empirical sample is divided into two groups: all cities and treatment group cities.
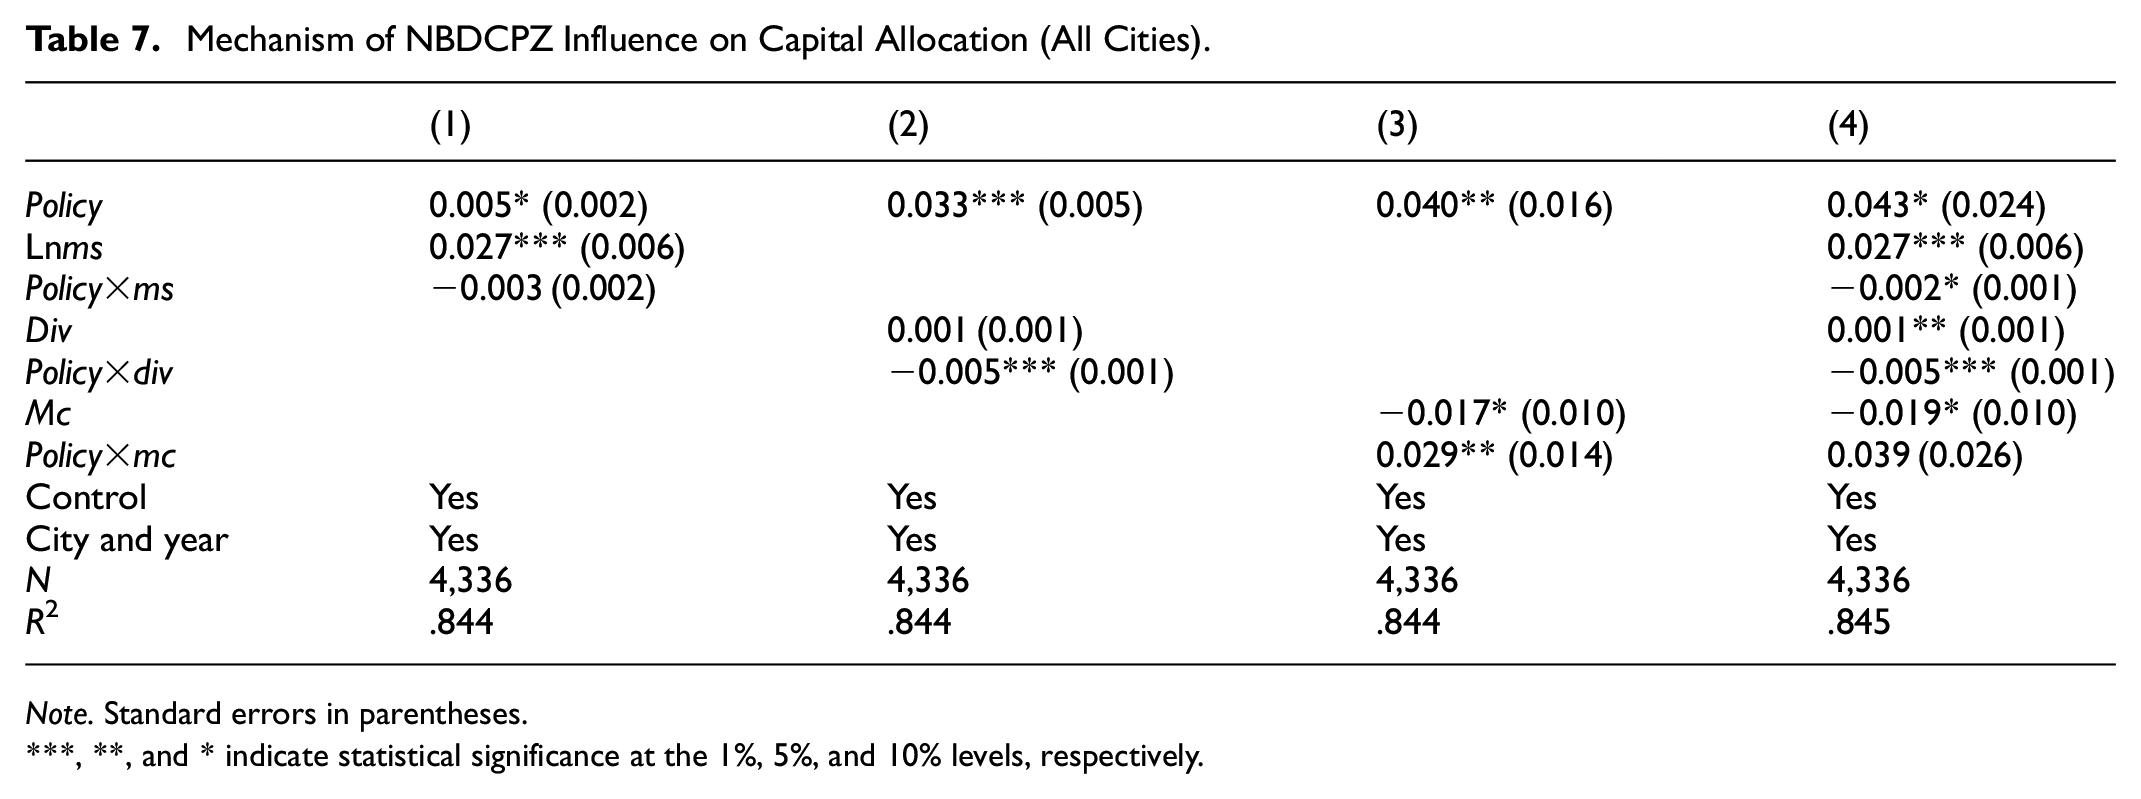
Table 7 shows the results of testing the effects and underlying mechanisms of the NBDCPZ on capital allocation across all 241 cities. The results indicate that the expansion of market size and the formation of specialization attract capital aggregation in the region, while an increase in market dynamism tends to repel capital. Additionally, from the regression results of the three mechanisms, the coefficients for the interaction terms between the NBDCPZ and both market size and specialization are negative, while the coefficient for the interaction term with market dynamism is positive. This suggests that the effectiveness of attracting capital through market size expansion is weakened with the implementation of the NBDCPZ. Similarly, the positive impact of specialization on capital allocation may also be diminished with the policy’s implementation. On the other hand, the NBDCPZ appears to mitigate the negative impact of market dynamism on capital allocation.
Mechanism of NBDCPZ Influence on Capital Allocation (All Cities).
Note. Standard errors in parentheses.
, **, and * indicate statistical significance at the 1%, 5%, and 10% levels, respectively.
Table 8 shows the results of testing the effects and underlying mechanisms of the NBDCPZ on capital allocation in the 69 cities where the policy was implemented. The findings further confirm the effectiveness of these mechanisms. Firstly, the NBDCPZ, by leveraging their technological advantages in data integration and circulation, have strengthened the connection between businesses and consumers, driving the rapid development of e-commerce. This has, to some extent, mitigated the constraints of geographical distance on local product sales, expanded the market reach, and attracted more investment to these areas. However, as digital technology advances rapidly under the influence of the NBDCPZ, the importance of relaxed institutional environments and effective service guarantees in investment location decisions becomes more prominent, while the simple expansion of market size plays a diminished role in attracting capital. Secondly, while industrial specialization clusters enhance the mobility of production factors among firms, intense competition within the same industry can lead to issues such as the loss of technical talent and the low-cost acquisition of innovation and R&D outcomes. The penetration of big data technology exacerbates these problems, weakening the investment appeal of industrial specialization clusters due to unreasonable inter-firm competition. Lastly, the improvement in the credit environment brought about by the NBDCPZ is also noteworthy. The application of digital technology has empowered financial institutions in credit risk management, helping to mitigate the credit risks associated with the increase in micro-loans as market dynamism rises. This optimization of the local commercial credit environment enhances investor confidence, thereby alleviating concerns about potential losses due to bad loan risks.
Mechanism of NBDCPZ Influence on Capital Allocation (Treated Cities).

Note. Standard errors in parentheses.
, **, and *indicate statistical significance at the 1%, 5%, and 10% levels, respectively.
Heterogeneity Analysis
The dominant industrial structure and clan culture of a city could influence its level of openness and demand for development funds, and further play a crucial role in shaping the capital allocation effects of NBDCPZ. Therefore, building on the analysis of the heterogeneous capital allocation effects of these pilot zones across different geographical regions, this study further explores the impact of NBDCPZ from the perspectives of industrial structure and clan culture. In terms of industrial structure, this study classifies cities based on the location quotient of agriculture, industry, and services. If only the industrial location quotient exceeds 1, the city is classified as an industrial city; if the location quotient of two or more industries exceeds 1, the city is classified as a multifunctional city. Regarding clan culture, in the context of contemporary commercial society, clan culture connects economic actors through informal contracts (Chan, 1997). By embedding these actors within clan networks, it significantly influences their resource acquisition activities. Cities are categorized based on their clan culture index. If a city’s clan culture index is above the average, it is defined as a city with strong clan culture, otherwise it is defined as a city with weak clan culture. The heterogeneity analysis results presented in Table 9.
Heterogeneity Analysis of NBDCPZ Policy Affecting Capital Allocation.

Note. Standard errors in parentheses.
, **, and * indicate statistical significance at the 1%, 5%, and 10% levels, respectively.
From the aspect of industrial structure, the results indicate that the capital allocation effect brought by industrial cities through the pilot big data comprehensive pilot zone policy is more significant. This effect occurs because the development of industry necessitates substantial capital investment. The NBDCPZ policy has significantly enhanced the level of informatization in the region. This advancement enables cities to not only communicate their industrial funding needs more effectively to the outside world but also to access a broader array of funding channels. As a result, the allocation of industrial development funds can be more efficiently matched to meet the actu44al demand, fostering a more balanced and effective capital flow. From the aspect of clan culture, the results indicated that in cities where clan culture is more pronounced, the capital allocation effects generated by the NBDCPZ policy are even more significant. This effect occurs because prior to the implementation of the NBDCPZ policy, cities with stronger clan cultures exhibited lower levels of openness to external influences, which hindered their ability to effectively access funding sources. However, following the introduction of the policy, there was a notable improvement in the availability of local funding. This enhancement in capital allocation was even more pronounced in these regions compared to areas with weaker clan cultures that had previously enjoyed higher levels of openness. The policy thus played a pivotal role in bridging the gap, enabling these traditionally insular communities to tap into financial resources more efficiently than before.
Overall, the establishment of NBDCPZ has invigorated local capital dynamics and effectively promoted capital aggregation. However, this impact may vary across regions. The implementation of NBDCPZ should be closely aligned with the overall industrial environment of the local area and its surroundings. Additionally, it is crucial to address the potential “digital divide” that may arise between regions and to actively prevent a “zero-sum game” in regional development driven by data factors. This helps to avoid the widening of development disparities between regions due to digital technology.
An Analysis of Over-Investment in NBDCPZ From the Perspective of Network Externalities
As the digital infrastructure within NBDCPZ improves, economic networks between cities begin to take shape. While network externalities can help cities to gain market scale and industrial support from external sources, they also increase the spatial flow of capital elements, which can potentially lead to overinvestment. This section aims to interpret capital allocation efficiency in the context of digitalization from the perspective of network externalities and explore the reasons behind the differentiated efficiency of capital allocation due to the interaction between digital policies and network externalities.
Method and Variables
This paper introduces the concepts of “performance borrowing” and “functionality borrowing,” which are related to network externalities, to facilitate the analysis of how enhanced urban network connectivity may lead to irrational investment behavior from the perspectives of market scale and industrial function. Additionally, the study explores the role of NBDCPZ in influencing capital allocation efficiency within this context. Following this research framework, the paper measures the level of overinvestment in the 69 cities within the treatment group. Drawing on the investment expectation model proposed by Richardson (2006), the paper divides urban investment into expected investment and unexpected investment. The formula for calculating expected investment is as follows:

In Equation 7, invi,t represents fixed asset investment levels; gdpi,t is the city’s gross domestic product; lnpopi,t is the logarithm of the year-end total population; lnroadi,t represents per capita road area; and lngrei,t represents per capita park green area. The coefficients β1, β2, β3, and β4 respectively reflect the expected investment driven by the city’s economic development level, population size, transportation convenience, and ecological environment. μi and λt denote city and time fixed effects, respectively. When the actual investment level is subtracted from the expected investment level, the positive residual term εi,t reflects the level of overinvestment, while a non-positive residual indicates no overinvestment in the city, and is assigned a value of 0.
After calculating the level of overinvestment in the sample cities, the residual term from the above equation is included as the dependent variable in the capital allocation efficiency regression model. To examine the impact of network externalities on urban capital allocation efficiency, as well as the role of the NBDCPZ in this process, the following regression equation is set up:

In Equation 8, Overinvesti,t represents the level of overinvestment; lnsizei,t is the logarithm of the city’s performance borrowing level; funci,t represents the city’s functionality borrowing level. Xi,t represents the control variables, which include the city’s gross domestic product (GDP), the ratio of fiscal expenditure to GDP, the number of students enrolled in regular higher education institutions, the number of internet users per 10,000 people, and the total retail sales of consumer goods. These variables reflect the impact of the city’s economic development level, government influence, education level, internet penetration rate, and commercial activity on its overinvestment. The specific calculation methods for performance borrowing level and functionality borrowing level are as follows:


In Equations 9 and 10, i and j represent two different cities; popj represents the population size of city j, and specialj denotes the level of functional specialization in city j, measured by the ratio of employees in the productive service industry to those in urban manufacturing. wij represents the spatial distance between city i and city j.
Building on the exploration of how network externalities influence urban capital allocation efficiency, further identifying the heterogeneity of this impact can inform tailored policies to enhance capital allocation efficiency based on the specific conditions of different cities. This study employs population size and geographical distance as grouping criteria to analyze such heterogeneity, driven by two key considerations. First, from the perspective of the study’ s thematic focus, in urban economics, population size and geographical distance are critical variables influencing economic development. They determine the volume of resource endowments a city possesses and the extent of economic spillover effects. Moreover, these variables are closely related to the impact of network externalities on the capital allocation effects of the NBDCPZ policy, which is central to this study. Second, from the perspective of measuring key indicators, intercity network externalities involve “performance borrowing” and “functional borrowing,” both of which are directly linked to population size and geographical distance. Variations in population size and geographical distance lead to differences in network externalities among cities, thereby resulting in disparities in the capital allocation effects of the NBDCPZ policy.
Differential Analysis of Policy Effects Influenced by Urban Scale Characteristics
The construction of NBDCPZ has strengthened the network characteristics of economic connections between cities. The magnitude of network effects depends on the scale of the entities active within the network. In the context of urban networks, the population size of a city plays a crucial role in determining both the direction and form of network externalities. Specifically, the flow direction and allocation efficiency of production factors will exhibit heterogeneity due to differences in population size between cities. Table 10 presents the specific impact of network external borrowing behavior on overinvestment across cities with different population sizes during the implementation of the NBDCPZ. From the dimension of urban population size, there are differences in the impact of performance borrowing and function borrowing on overinvestment in different types of cities.
Differential Analysis of External Borrowing of Urban Networks (Population Size).

Note. Standard errors in parentheses.
, **, and * indicate statistical significance at the 1%, 5%, and 10% levels, respectively.
The results indicate that the mitigating effect of performance borrowing in mega and super-large cities on over-investment strengthens as policies are enhanced, while the over-investment resulting from performance borrowing in large cities may diminish with the intensification of policies. This effect occurs because mega and super-large cities, with their broader economic spheres of influence, face larger production and consumer markets. Through performance borrowing, these cities achieve industrial complementarity with surrounding regions within their economic spheres of influence, while simultaneously developing diversified markets in these areas. The process of achieving industrial synergy and exploring multifaceted markets requires significant capital investment, which in turn helps mitigate the issue of over-investment.
For all cities, functional borrowing significantly contributes to over-investment, a phenomenon that is particularly pronounced in mega and super-large cities. The enhancement of the NBDCPZ policy serves to mitigate the over-investment induced by functional borrowing, with this mitigating effect being more pronounced in mega and super-large cities as well. To better leverage the spillover effects of public infrastructure in other cities within their economic spheres of influence, cities often invest in complementary facilities. However, due to the inability to accurately assess the required level of such facilities, over-investment frequently occurs. Cities with larger populations generally have more developed economies and, with more abundant fiscal resources, may exercise less caution in the use of funds, leading to more severe over-investment issues. The implementation of the NBDCPZ policy, aimed at enhancing informatization, increases transparency in the investment and construction process, allowing for accurate tracking of fund utilization and more efficient oversight. In cities with larger populations, the vast information transmission network further amplifies the policy’s effect on improving information transparency.
Heterogeneity Test of Policy Effects Influenced by Spatial Distance Characteristics
Network externalities have a significant impact on the locational choices of capital elements. In cities that are geographically closer, investment information tends to be more transparent, but investors also face more intense competition. Currently, there is ongoing debate about whether network externalities are influenced by geographic distance. In many studies on resource allocation, the impact of geographic distance is often treated as a “black box,” obscuring the spatial mechanisms that drive resource allocation between cities. Table 11 presents the specific impact of network external borrowing behavior on overinvestment in cities at different distances from the provincial capital during the implementation of the NBDCPZ.
Heterogeneity Test of External Borrowing of Urban Network (Spatial Distance).

Note. Standard errors in parentheses.
, **, and * indicate statistical significance at the 1%, 5%, and 10% levels, respectively.
The results indicate that among all pilot cities in the NBDCPZ, the impact of performance borrowing on over-investment is not significant. However, over-investment driven by functional borrowing is prevalent, and this phenomenon becomes more pronounced in cities farther from the provincial capitals. This effect occurs because cities located farther from provincial capitals are likely to invest more to overcome the diminishing spillover effects of public infrastructure due to geographical distance, increasing the risk of over-investment. Additionally, geographical distance inevitably leads to information distortion between cities, resulting in redundant construction and over-investment as cities undertake complementary investments to facilitate functional borrowing.
However, the NBDCPZ policy can effectively mitigate such over-investment. Moreover, this mitigating effect is more pronounced in cities farther from the provincial capitals, where over-investment tends to be more severe. The NBDCPZ policy enhances the level of informatization in cities, increases the transparency of investment market information, and reduces the likelihood of redundant construction. The farther a city is from the provincial capitals, the more severe the information distortion caused by geographical distance becomes. By improving the level of informatization, the NBDCPZ policy effectively mitigates the information distortion resulting from increased geographical distance, thereby alleviating the associated over-investment. This indicates that, in the pilot cities of NBDCPZ policy, over-investment due to information opacity caused by geographical distance is a significant issue.
Conclusion and Implication
Conclusion
Based on the identification of the capital location lock-in effect of the NBDCPZ using the SDID method, this paper further explores the impact of the interaction between NBDCPZ and urban networks on capital allocation efficiency. The research findings are as follows:
First, the NBDCPZ generally facilitates capital inflows into the pilot cities, but the effectiveness of this impact varies across different batches and regions. It confirms the suggestions made by Acemoglu and Restrepo (2018) that the impact of digital technology on resource allocation is uncertain. Current research on the impact of these pilot zones primarily explored their economic effects in total factor productivity, land use efficiency, and green development (Lyu et al., 2024; Y. Wu et al., 2024). Accordingly, this paper further explores the role of digital policies in the allocation of capital factors. In Guizhou Province, where the first batch of NBDCPZ was implemented, the ability to attract capital increased significantly. However, in provinces where the second batch of policies was rolled out, the overall impact of capital allocation within the NBDCPZ was less pronounced, largely due to varying levels of economic development. Regionally, the NBDCPZ in the eastern regions, characterized by a strong industrial base and higher investment returns, showed a substantial boost in local investments. While the policy positively influenced capital allocation in the western regions, the effect was muted due to a mismatch between digital infrastructure and local industries. In the central regions, low investment returns driven by the existing industrial structure, coupled with the increased transparency of investment information provided by the NBDCPZ, actually exacerbated the outflow of capital from these areas.
Second, the NBDCPZ influences local capital allocation through momentum conversion, peer competition, and risk mitigation effects. Current research primarily explores the role of digital development in capital allocation from the perspective of supply-demand matching. Jagtiani and Lemieux (2018) suggests that digital finance has revolutionized financing channels by mobilizing a significant amount of idle small-scale capital, thereby providing effective financial support to small and micro enterprises that traditionally struggle to secure loans. This, in turn, expands the scope of capital allocation (Lin & Ma, 2022). In addition to examining the impact of the NBDCPZ policy on market scale and production division, this paper further incorporates the role of the policy in improving the business environment within its mechanism analysis. The expansion of urban market size and the improvement of specialization in the division of labor contribute to local capital accumulation. However, the increase in microcredit risks associated with the rise of private sector employment in a more dynamic market can lead to capital outflows. As the NBDCPZ develops, the continuous improvement of digital infrastructure and increased information transparency within the pilot cities reduce the attractiveness of market size for investment. Simultaneously, these advancements facilitate a shift in the city’s investment momentum and intensify competition among local enterprises, creating a dual effect on capital formation in these cities.
Third, the effectiveness of NBDCPZ in mitigating this overinvestment varies based on population size and distance from the provincial capital. The borrowing of market size and urban functions can exacerbate the unregulated expansion of capital through “comparison effects” and “competition effects,” thereby reducing the efficiency of capital allocation. Over-investment driven by intercity “network borrowing” behavior is a widespread phenomenon. The connectivity of the network directly determines a city’s capacity for “borrowing scale,” and changes in this capacity are influenced by differences in city size and spatial distance (Van Meeteren et al., 2016). The differentiated development goals of cities of varying sizes result in different forms of overinvestment caused by “borrowing scale.” In large cities, performance borrowing, and in mega and super cities, functionality borrowing, often lead to significant overinvestment. The NBDCPZ effectively mitigates the overinvestment caused by functionality borrowing in mega and super cities. However, network externalities do not entirely negate the economic effects of spatial distance. For cities at varying distances from the provincial capital, overinvestment triggered by performance borrowing is more sensitive to changes in spatial distance than functionality borrowing. The NBDCPZ significantly mitigates overinvestment caused by performance borrowing in cities closer to the provincial capital.
Implications
For optimizing capital factor allocation under NBDCPZ policy, following managerial implications are suggested: First, enhance digital infrastructure development to facilitate the free flow of capital. Leveraging digital technologies can dismantle capital market fragmentation caused by information asymmetry across regions, thereby improving capital mobility. In areas with established industrial facilities, there should be a proactive push toward industrial digitalization to attract a greater concentration of capital resources. Building on this foundation, it is crucial to strengthen collaborative divisions of labor between digitally advanced regions and those facing capital shortages. This approach will facilitate the flow of capital into these areas, providing ample financial resources to support local development.
Secondly, it is crucial to closely monitor shifts in capital inflow motivations during digital transformation. Once a region’s capital attraction reaches saturation based solely on market size advantages, it should leverage technological superiority from specialization and maintain a favorable business environment to sustain foreign investment inflows. Throughout the process of regional specialization and industrial clustering, it is imperative to regulate market competition practices, enhance transparency in capital lending information, and mitigate financial risks associated with non-performing loans.
Thirdly, it is essential to leverage the network effects generated by digital policy implementation, enhancing the radiating and driving influence of highly digitized regions on less developed areas. Regions with advanced digital development typically concentrate substantial capital resources. Through interregional information sharing, these areas can achieve industrial function complementarity. Within this production division system, less developed regions should capitalize on their comparative advantages in urban environments, lower transformation costs, and market potential to attract capital inflows.
This paper presents some limitations which may suggest some new directions for future research. First, this study focuses on the capital allocation effects of China’s NBDCPZ policy. This digitalization policy involves large-scale information infrastructure construction, requiring substantial economic resources to implement. Consequently, the applicability of our findings to other countries, particularly developing nations with lower levels of economic development, warrants further investigation. Future scholars can explore the economic effects of digital policies with broader applicability in developing countries, thereby providing insights that could inform modernization in a wider range of developing countries. Secondly, the use of city-level panel data in this study limits the analysis of capital allocation effects to aggregate measures such as capital scale and growth rate. As a result, the findings may not offer actionable insights for individual firms seeking to leverage such policies for their development. Future scholars can investigate the effects of digital policies on capital allocation across different industries and firm sizes, as well as examine how various types of capital respond differently to such policies. By conducting firm-level analyses, researchers could derive more nuanced and practical conclusions.
Footnotes
Appendix
Description of Variables.

| Variable | Meaning | Calculation |
|---|---|---|
| loan | The amount of urban capital allocation | Logarithmic form of the balance of loans of financial institutions at the end of the year |
| rate | Urban capital growth rate | Growth rate of the balance of loans of financial institutions at the end of the year |
| policy | Whether to implement the policy | Whether it is a pilot city in the NBDCPZ |
| lnms | market size | Logarithmic form of total social retail sales |
| div | Urban specialization agglomeration | The ratio of the share of the number of employees in the industry with the largest number of employees in the city to the share of the national number of employees in the industry in the total number of employees in the country |
| mc | Degree of market competition | The proportion of self-employed and private employed population in the total employed population |
| gdp | Economic development level | Gross regional production |
| lnpop | Population size | Number of urban population |
| ln(road+1) | Traffic development status | Logarithmic form of road area per capita |
| ln(gre+1) | Environmental protection level | Logarithmic form of green space area per capita |
Author Contributions
W.Z.: conceptualization, methodology, formal analysis, data curation, validation, writing—original draft preparation. X.W.: writing—review and editing. K.Z.: visualization, supervision. L.Z.: data curation, validation, and funding. All authors have read and agreed to the published version of the manuscript.
Funding
The author(s) disclosed receipt of the following financial support for the research, authorship, and/or publication of this article: This research was funded by the National Natural Science Foundation of China “Research on the mechanism and influence effect of high-quality content generation of digital creative enterprises driven by knowledge innovation under AIGC participation” (72474170).
Declaration of Conflicting Interests
The author(s) declared no potential conflicts of interest with respect to the research, authorship, and/or publication of this article.
Data Availability Statement
The data presented in this study are available on request from the corresponding author.