
Abstract
Public libraries, as a source of public information, continue to provide services by developing innovative solutions, such as drive-through facilities for borrowing and returning printed books. This paper aims to measure the effect of drive-through service user loyalty in public libraries using the Net Promoter Score (NPS). Questionnaires were distributed to users who utilized the drive-through facilities at Public Libraries in Indonesia, and 100 users completed the questionnaires. This study employs Structural Equation Modeling (SEM) to analyze data on the relationship between service quality, user satisfaction, and Drive-Through User Loyalty. The results indicate that the NPS score is influenced solely by service quality and has no effect on drive-through user loyalty. The findings demonstrate that NPS service quality affects satisfaction, satisfaction affects loyalty, and service quality affects the Net Promoter Score. However, service quality does not affect loyalty, the Net Promoter Score does not affect satisfaction, and the Net Promoter Score does not affect loyalty. Libraries can utilize these results to develop drive-through services that cater to user needs by examining service quality factors to enhance user satisfaction and loyalty.
Introduction
Consumer loyalty refers to the loyalty of consumers to a company, brand, product, or service (Fatma et al., 2016). It is important to measure organizational loyalty, especially in non-profit organizations like libraries. The Net Promoter Score (NPS) is a simple method for measuring loyalty used by both for-profit and non-profit organizations to yield accurate results related to organizational growth. NPS was first introduced to gauge customers’ willingness to recommend a product, service, or company to their friends or colleagues. Thus, NPS can assist organizations in identifying loyal users (Rajasekaran, 2018).
While there is a body of literature on the NPS method used by for-profit organizations, research on NPS for non-profit organizations remains scarce. Several public administration organizations have employed the NPS method to measure user loyalty. Similarly, although the literature on NPS in libraries is limited, the method has been utilized to measure library user loyalty, particularly in Indonesia. The loyalty of library users is primarily assessed by examining the impact of service quality and satisfaction on user loyalty (Annamdevula & Bellamkonda, 2014; Bakti & Sumaedi, 2013; Helgesen & Nesset, 2011). For instance, the new NPS method was employed on a small scale by the Estonian National Library in 2015 (Valbe, 2015; Valbe, 2016), and on a larger scale by the Finnish National Library in 2016. It was also used by the National Library of Finland to measure library customer perception (Laitinen, 2018).
Some studies have found a relationship between service innovation and customer loyalty, as seen in various industries such as transportation (Woo et al., 2021), banking and financial services (Asnawi, 2021), patient loyalty in healthcare services (Fahmi et al., 2020), product innovation and customer loyalty (Irfan & Hariani, 2022), and even in the telecommunications industry (Awuku et al., 2023). In the library field, some researchers have also found that service quality influences customer loyalty (Kachwala et al., 2021; Twum, 2021). These previous studies have been conducted within the service industry, of which library services are a part. However, research specifically focused on service innovation and customer loyalty within the library field remains rare. Nevertheless, the evidence from these studies can be applied to enhance library services.
During the COVID-19 pandemic, almost all public libraries in Indonesia were closed to physical visits, although they remained open for staff. To adapt, public libraries innovated their services by introducing drive-through facilities. During this time, various services were launched, including drive-thru services (Lim, 2021), digital library services (Mehta & Wang, 2020), and live storytelling sessions on Instagram. These services were introduced in response to lockdowns and movement restrictions, preventing users from visiting the library. Through the drive-through service, library users could access library resources without leaving their vehicles, borrowing and returning books through a window. Drive-through facilities effectively addressed the challenge of providing library services during the pandemic by minimizing direct contact and reducing crowds. The implementation of drive-thru services in public libraries in Indonesia represents an innovation aimed at fostering customer loyalty.
Some studies have also indicated a strong relationship between service innovation and customer loyalty in the banking sector (Yusheng & Ibrahim, 2019), where digital service innovation has been shown to positively influence customer loyalty (Wu, 2014). Despite being unable to offer physical services during the COVID-19 pandemic, libraries aimed to enhance customer loyalty through innovation, such as opening drive-thru services, allowing users to stay connected with minimal risk. Users could also access digital library services to reserve and borrow books, picking them up via the drive-thru. By providing these services, users continue to benefit from the library and are more likely to utilize the services regularly, thus fostering loyalty.
Accordingly, this study examines the loyalty of public library users towards drive-through services using the Net Promoter Score (NPS) concept. The objectives of this study are: (a) to determine the NPS scores of users of public libraries in Indonesia, (b) to understand the relationship between service quality and NPS scores, and (c) to assess the relationship between user satisfaction and NPS scores.
Literature Review
Loyalty is crucial for attaining higher profits and gaining a competitive edge (Thaker et al. 2020). The Cambridge Dictionary defines loyalty as “the quality of always liking and supporting someone or something.” in a similar vein, loyalty is also defined as a customer’s commitment to repurchase a product or reuse the services provided by an organization or company (Engel et al., 2012). According to Tjiptono (2010), customer loyalty can be observed through repeated purchases, providing referrals to others, and remaining loyal to one product despite competitors’ presence. Research on the satisfaction and loyalty of library users has been ongoing for many years, evolving alongside developments in library technology.
Improving service quality, increasing user satisfaction, and cultivating a caring and responsive customer service environment are all ways libraries can create user loyalty. The study “Achieving University Libraries User Loyalty Through User Satisfaction” discovered that certain aspects of service quality—like service effect, information access, library as a place, and personal control—have a strong correlation with user satisfaction. Satisfaction, in turn, is positively correlated with user loyalty (Twum et al., 2022). Furthermore, the significance of providing excellent core services that fulfill customer expectations, providing compassionate customer care, and solving problems in fostering customer loyalty within a library setting. Finally, positive interactions between librarians and patrons as well as perceived quality might support patron loyalty (Tajedini et al., 2020).
There is a connection between loyalty and service quality in company marketing as well as library administration. Their relationship can be summed up as follows: different aspects of service quality have an impact on customer satisfaction, and customer satisfaction has an impact on customer loyalty (Kiran & Diljit, 2017; Oh, 2023). Customer satisfaction is crucial to the long-term viability of businesses, including the library as a service industry. Kotler and Armstrong (2010) argued that customer satisfaction is evident from customers’ reactions to the product or service received, comparing it against their expectations. This variation in user satisfaction is influenced by various factors.
Some studies conducted research on user loyalty at the library. It revealed a substantial positive correlation between library customer satisfaction and all the service quality measures. The study also found a strong positive correlation between user loyalty and satisfaction. The practical implication is that when library administration raises the degree of patron satisfaction with services, patron loyalty can be attained. There aren’t many studies that evaluate user loyalty, customer happiness, and library service quality (Twum et al., 2022). Customer satisfaction can help consumers form favorable opinions about the goods and services that a company provides. Moreover, having loyal customers is one of a company’s strengths. Many businesses are unaware that building customer loyalty begins at numerous points, from finding possible clients to developing a base of devoted clients who will benefit the business. Finally, a concerted attempt is also made to cultivate client loyalty by implementing a harmonious relationship with the customers (Khairawati, 2020).
There are several methods for measuring user loyalty. Currently, there is a diversification in satisfaction and quality measurement methods, including the adoption of the European Customer Satisfaction Index (Cen & Li, 2020), and assessments of Internet service quality (Cheung et al., 2009). In 2021, research into satisfaction using the Net Promoter Score (NPS) method and involving social media, Web 2.0, and Web 3.0, began to gain attention (Srirahayu et al., 2021; Stephen, 2021). Libraries, as institutions offering services, must enhance their quality, which is measured using three indicators of LibQual: service effectiveness, information control, and library as a place (Colleen et al., 2015; Kumar & Mahajan, 2019). Net Promoter Score (NPS) is an industry-standard metric used by corporations to measure customer loyalty. Another concept utilizes the NPS score to gauge the level of user satisfaction. The NPS Score aims to determine how likely customers are to recommend a business to friends or colleagues (Reichheld & Markey, 2011).
Research on the true desires of consumers has been conducted since 1973, and the findings have consistently been the same. Clients express four desires: (a) Consumers expect to be treated with civility and respect; they want prompt, attentive service. They desire a sense of significance; (b) Flexibility: Customers expect you to adjust the system to suit their specific requirements. They want you to use your creativity to find a way to get them what they need or desire, not to tell them no or recount all the good things you’ve done for them; (c) Problem-solving: Rather than the manager or supervisor, customers want the first person they speak to handle their issue. The issue could be one of business, like obtaining some essentials. One study was conducted to examine customer satisfaction with and loyalty toward, nonprofit organizations, such as public libraries (Tan et al., 2017).
Previous studies on NPS in public sector organizations is not extensive. In the library domain, the first reported use of NPS appears to be a trial conducted by the National Library of Estonia (Valbe, 2015, 2016). The use of NPS in libraries is like a study conducted by Juntumaa et al. (2020); Laitinen (2018); Srirahayu et al. (2021). The concept of NPS is likely to be incorporated into the new International Standard ISO 21248 (Information and documentation. Quality assessment for national libraries), currently under development by the International Organization for Standardization (ISO). According to Valbe (2015), NPS is also under consideration for inclusion in the International Standard ISO 11620 (Information and documentation. Library performance indicators). The existing International Standard ISO 11620 (2014) does not encompass indicators for assessing the impact of library services on individuals, the communities they serve, or society at large (Laitinen, 2018). Currently, there is a lack of simple indicators to assess the impact of library services. Nevertheless, there is a solid argument for experimenting with new types of indicators, like NPS, in the hopes of organizing qualitative data into categories that can be given numerical values (ISO 16439:2014). This approach would also allow for using user satisfaction data to pinpoint services that might have affected users’ skills, behaviors, competencies, or opinions (Laitinen, 2018).
Based on the aforementioned explanation, a research model about loyalty in public libraries in Indonesia was devised, as illustrated in Figure 1 below.

Loyalty NPS research model.
Based on the Figure 1 of this study, the following hypothesis were developed:
H1: How does drive-through service quality affect user satisfaction?
H2: How does drive-through service quality affect the loyalty of library users?
H3: How does drive-through service user satisfaction affect library user loyalty?
H4: How does the NPS value of drive-through service users affect library users’ satisfaction?
H5: How does the NPS value of drive-through service users affect library users’ loyalty?
H6: How does the quality of drive-through services affect the NPS values of library users?
Research Methods
Study Design
This type of research is mixed-method to explore the use of drive-thru services using both quantitative and qualitative methods. The sequential collection of data (Creswell & Plano Clark, 2011) through questionnaire completion, focus group participation, and information on the website. This methodology included data obtained from two perspectives (Creswell & Plano Clark, 2011) and aided in the substantiation of findings when merging data results. Questionnaire completion was used to explore the impact of service quality on user satisfaction and loyalty. Focus group participation was used to explore information on drive-thru services in public libraries during the pandemic. Information that appears on websites, news, or social media was used to know about drive-thru service.
In terms of research ethics, this research followed the rules and ethics of research conduct and writing coordinated by the Institute for Research and Community Service (LPPM), Universitas Airlangga, and those mandated by law. It is also explained in the Airlangga University Chancellor’s Regulation Number 34 of 2019 concerning the Rules of Conduct clause 16 (b) that researchers must be honest, objective, and adhere to all aspects of the research process and may not falsify or manipulate data or research results, as well as clause 16 (f) that researchers must respect and appreciate the object of research, whether in the form of humans or animals, both living and dead, or parts/fragments of the object of research. This research ethics and permit was given by the research committee with SK Rektor 929/UN3/2021 and a research permit from the faculty research committee permit number 4735/UN3.1.14/TU/2021. A consent letter form was given to participants before they filled out the questionnaire. Participants read the consent letter form and sign it when they agree to participate in this research by filling in the questionnaire.
Data Collection
The population in this study were users of public library drive-thru services. The study was conducted at a public library in Indonesia that provided drive-through services during the COVID-19 pandemic. Based on data from the National Library of the Republic of Indonesia (https://satudata.perpusnas.go.id) there are 548 public libraries. The criteria in this study are public libraries that provide drive-thru services during the COVID-19 pandemic. Information about these services was obtained by the research team from the public library’s website and social media. Based on their social media and websites, only 4 (four) public libraries provide drive-thru services. The public libraries are the East Java Provincial Public Library, Malang City Public Library, Madiun City Public Library, and Probolinggo City Public Library.
Quantitative Data Collection
The sampling method was carried out randomly, meaning that all drive-through users had the same opportunity to be selected as respondents. The number of research samples should be between 30 and 500, and an analysis using structural equation modeling (SEM) confirmed that the range of the number of samples was 30 to 460, depending on the number of indicators—the greater the number of indicators, the smaller the number of samples needed (Wolf et al., 2013). Subsequently, one hundred samples were used in this research that were distributed equally to four locations.
The data collection method involved using a questionnaire distributed through the social media of the public library, which was the location of the research, and by visiting the library. The questionnaire was adopted from studies that have been carried out by previous researchers. The existing questionnaires were then discussed with the research team and adapted to the context in Indonesia, including translating the questionnaire into Indonesian. The questionnaires were distributed directly to drive-through service users, who could either complete the questionnaire manually or use a Google form created by the researchers, as online data collection was more efficient (Ponchio et al., 2021).
Qualitative Data Collection
Other data collection included interviews with librarians to collect data about drive-thru services and the characteristics of the users of these services. Articles on the Internet related to drive-through services and comments on library social media related to such services were also considered data sources. The more data sources used, the higher the validity and reliability of the research (Creswell, 2014). Interviews with librarians were conducted with librarians who were at the drive-thru service so a total of four librarians were interviewed. Interview questions include:
Description of drive-thru services at public libraries.
background to the creation of the idea for drive-thru service innovation in public libraries.
Rules for drive-thru services at public libraries.
Facilities at drive-thru service.
Challenges and obstacles to drive thru services during the pandemic.
Evaluate drive-thru services at public libraries.
Data from the internet is used as secondary data in this research to support findings regarding user satisfaction and loyalty towards drive-thru services. To collect data from the internet, observations were made on online news article that discussed the development of library drivethru services. Selected online news article published from 2020 to 2024. Because library drive thru services in Indonesia first appeared in 2020 as an effort to survive the pandemic, up to 2024 discussion of library drive thru services is still often discussed in online news article, because it is considered a service innovation that can serve users quickly. After formulation of the review questions, a list of search terms was identified. Search terms were developed from review questions, previous research, and using related keywords and synonyms. Search terms and their combinations are as follows:
Search Terms
Libraries, drive-thru services, library driver thru services, pandemic, covid-19, circulation services, innovation
Search String
(“library”) AND (“drive thru service”) (“drive thru service”) AND (“pandemic” OR “covid-19”) (“library”) AND (“pandemic” OR “covid-19) AND (“innovation”) (“drive thru service”) AND (“circulation service”)
Data Analysis and Measurement
Quantitative Data Analysis
The data were then processed using the AMOS software. Other supporting data were used to strengthen the analysis of the questionnaire data. The primary data analysis, namely, the questionnaire results, was carried out using SEM to test the predetermined hypothesis. SEM is a multivariate statistical analysis method used when the proposed model is complex (Hair et al., 2014). Before analyzing the data, it was necessary to test its validity and reliability and discard any invalid data.
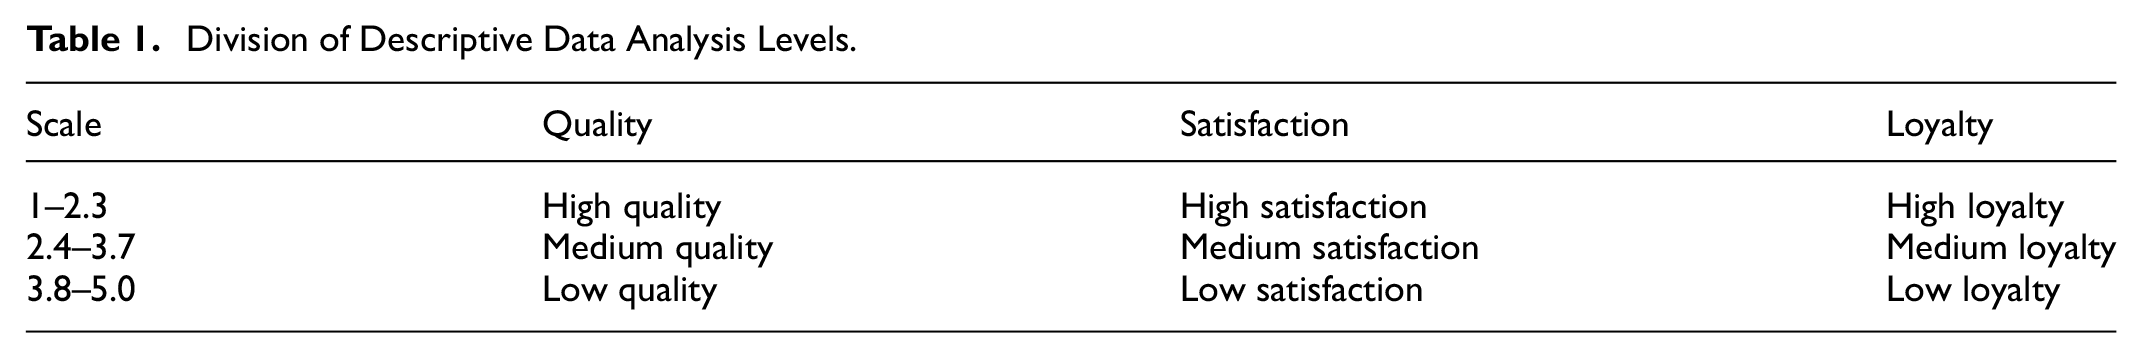
A descriptive data analysis was also carried out by dividing the processing results into three categories: high, medium, and low. It should be noted that to measure user satisfaction, instruments adopted from the Srirahayu et al. (2021) study were used. The division method is based on the formula I = R/C = (5-1)/3 = 1.33 (I: interval; R: Range; C: Class), and the level division was obtained as illustrated in Table 1.
Division of Descriptive Data Analysis Levels.
The NPS score uses the following formula (Table 2): the percent of promoters minus the percent of detractors (Reichheld & Markey, 2011). The descriptive data analysis for NPS followed Reichheld and Markey (2011), where the range of values less than 0 (negative) indicates unsatisfied or disloyal customers and values greater than 0 (positive) indicate satisfied customers.
NPS Measurement Scores.

Measurement
Loyalty, satisfaction, and quality were measured using a 5-point Likert scale, with values ranging from 1 (strongly disagree) to 5 (strongly agree). The 14 questions used to measure satisfaction were adopted from Srirahayu et al. (2021), and 20 questions for quality were adopted from Srirahayu (2020). Five questions for loyalty were adopted from Srirahayu et al. (2021), and one question for NPS measurement was adopted
Qualitative Data Analysis
The collected qualitative data was recorded and then transcribed word for word in Microsoft Excel to facilitate coding. Substantive coding was used to identify and analyze data. In the data analysis process, there are three stages, namely first order, second order, and aggregate. In this study, researchers use deductive data analysis, in which all data have been collected and then coded by using a guide that was already prepared on the interview question. Twelve topics will be asked of participants and that also become guidelines to build aggregate. Following that, all the codes are grouped based on similarity (that becomes second order), and finally, the groups will be categorized and become aggregate (theme). The number of participants is 12 consisting of program coordinators, drive-thru staff, and library management. In this mixed methods study, triangulation was achieved by elaborating on the findings of quantitative and qualitative data (Plano Clark & Creswell, 2008). The use of more than one method increases the validity and confidence of the results and can provide a better understanding of the phenomenon under study. After qualitative and quantitative data analysis was carried out separately, the data was combined in the discussion.
Analysis of secondary data in the form of online news article was carried out by identifying 57 selected articles. The identification process ensures that the title discusses the library’s drive thru service. From this identification process it was reduced to 33 online news article. These 33 online news article were then read to determine whether the content of the article matched the theme. From the results of the short reading, data was obtained that 15 online news article were not suitable, so the number of articles that would be included in the review was 17. The next stage, the analysis was carried out in accordance with the objectives set for the research. Before the analysis is carried out, the characteristics of the article are first mapped, such as the year of publication. The next step is to synthesize the contents of the selected articles by identifying the development of library drive thru services in Indonesia as an effort to survive the Covid-19 pandemic.
Result
Demographic Data
The number of respondents in this study was 50 respondents, regarding Table 3, 32% of the respondents were male, and 68% were female. Referring to the data from the National Center for Education Statistics (NCES), globally, the literacy rate of women is higher than that of men. This is evidenced by the greater number of women visiting the library and using the drive-thru service.
Gender of Respondents.

Table 3 shows that 72% of the respondents were students, followed by self-employed individuals (12%), and freelance workers (8%). The remaining respondents comprised entrepreneurs (4%) and teachers (2%). Students constituted the majority of library users as they required information resources to support their research, access to reading rooms equipped with Wi-Fi, and a quiet atmosphere. This aligns with the findings of research conducted by Fakhrunnisa et al. (2015), which revealed that library users are motivated to visit libraries for access to Wi-Fi and quiet spaces, as well as for the library’s collection and reading facilities.
Before the pandemic, as shown in Table 4, the majority of respondents visited the library once a week (30%), followed by those who visited once a month (26%) and those who visited once in total (22%). Based on this frequency, respondents were still actively visiting the library once a week, as the library’s activities and student respondents were functioning normally. Consequently, respondents visited the library once a week to access information or complete educational tasks.
Frequency of Library Visits Before the Pandemic.
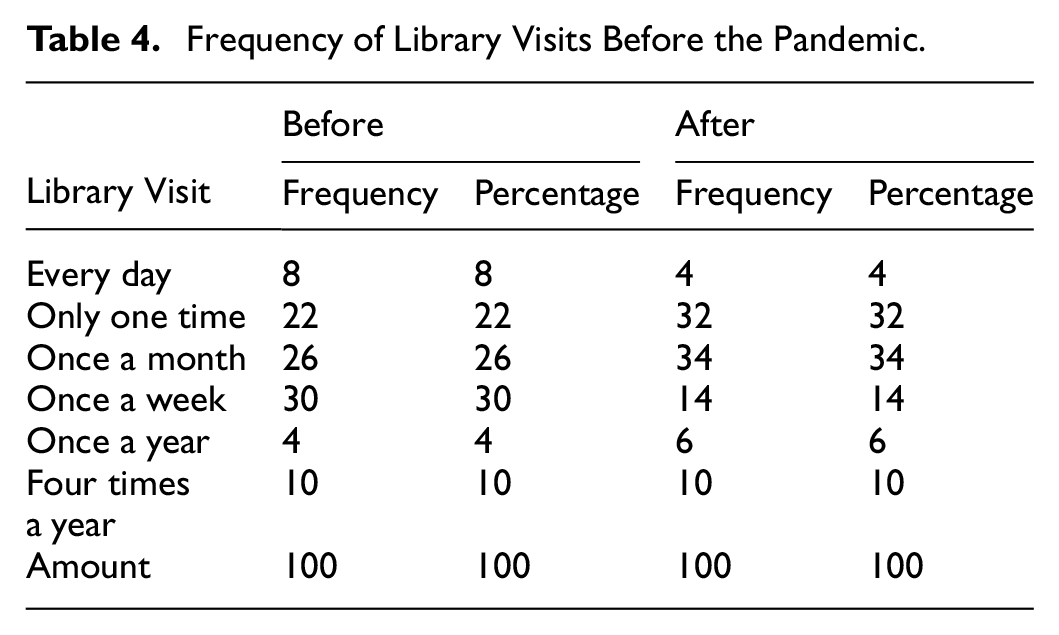
During the pandemic, as indicated in Table 4, the highest frequency of visits was once a month (34%), followed by visits made only once during the pandemic (32%) and visits once a week (14%). Based on the frequency data above, respondents’ visits were reduced to once a month or only once during the pandemic. This suggests that respondents limited their physical visits to the library to avoid direct contact with others and prevent virus transmission. Libraries experienced a decrease in visitor activity due to the pandemic. Additionally, since most respondents were students, their classes and assignments were conducted online. Nevertheless, libraries provide online and drive-through services for users.
Table 5 shows that during the pre-pandemic period, respondents frequently used on-site reading services (64%), reference services (18%), and circulation services (8%). On-site reading services were the most commonly used because library services before the pandemic were unrestricted. Reference services were also popular due to collections that could not be borrowed and offline lecture activities. Respondents, primarily students, still needed to read and obtain references directly from collections at reference services by visiting and reading on-site. Circulation services were also frequently used because borrowing and returning collections were not restricted.
Frequently Used Services Before the Pandemic.

The services used during the pandemic did not vary greatly from those used before the pandemic. What changed was how the services were accessed; they were shifted online. After the onset of the pandemic, as seen in Table 5, online reference services were the most utilized (28%), followed by online circulation services (26%). These services still dominate because they are the core facilities provided by the library. Moreover, both services are available online, through a website, and via a library circulation application designed specifically for online access, borrowing, and returning. However, some respondents still use physical reading services because users are allowed to visit the library, albeit with restrictions on the number of visitors and the implementation of health protocols.
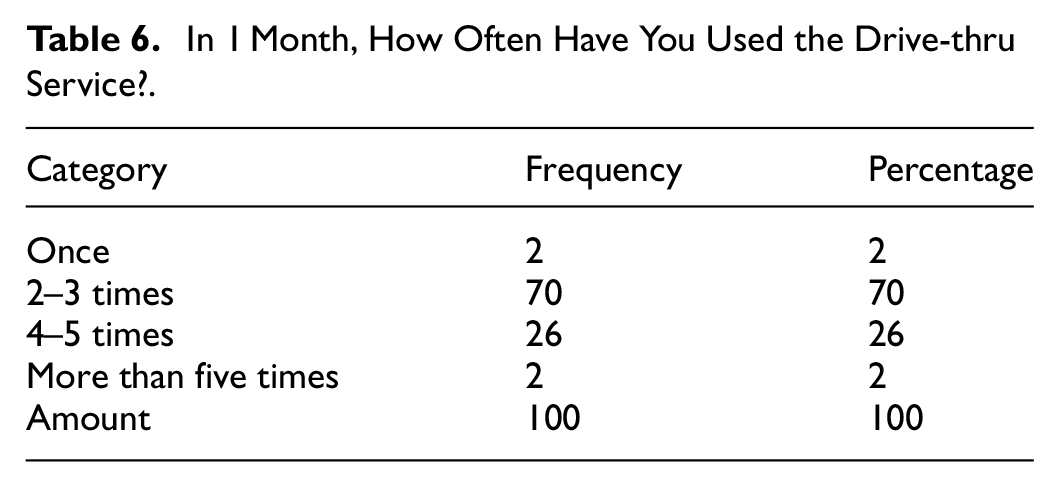
As seen in Table 6, respondents used the drive-through services 2 to 3 times a month are 70%, followed by 4 to 5 times a month (26%). This is likely because the library began to implement online reference and circulation services, thus making the drive-through services an alternative service. The respondents believed that the online services, both references, and circulation, were simpler and faster; they also stated that it was easier for them to access the library services without contacting the library and placing an order to return the physical books.
In 1 Month, How Often Have You Used the Drive-thru Service?.
Statistical Data
Table 7 indicates that the probability of respondents recommending the library to their friends or colleagues was high, with a percentage of 30%. This high likelihood stemmed from positive experiences of using library services. These positive experiences included the library being a comfortable place; friendly staff; a complete collection of books always available; up-to-date, easy-to-use, and comprehensive facilities; and the option of borrowing physical books, which can otherwise be expensive. Additionally, the library impacts district and village communities, serves as a learning resource, and assists students with research resources and assignments. By recommending the library, respondents also hope their friends and colleagues will have similarly positive experiences.
Satisfaction Level Of Drive-thru Service Users.

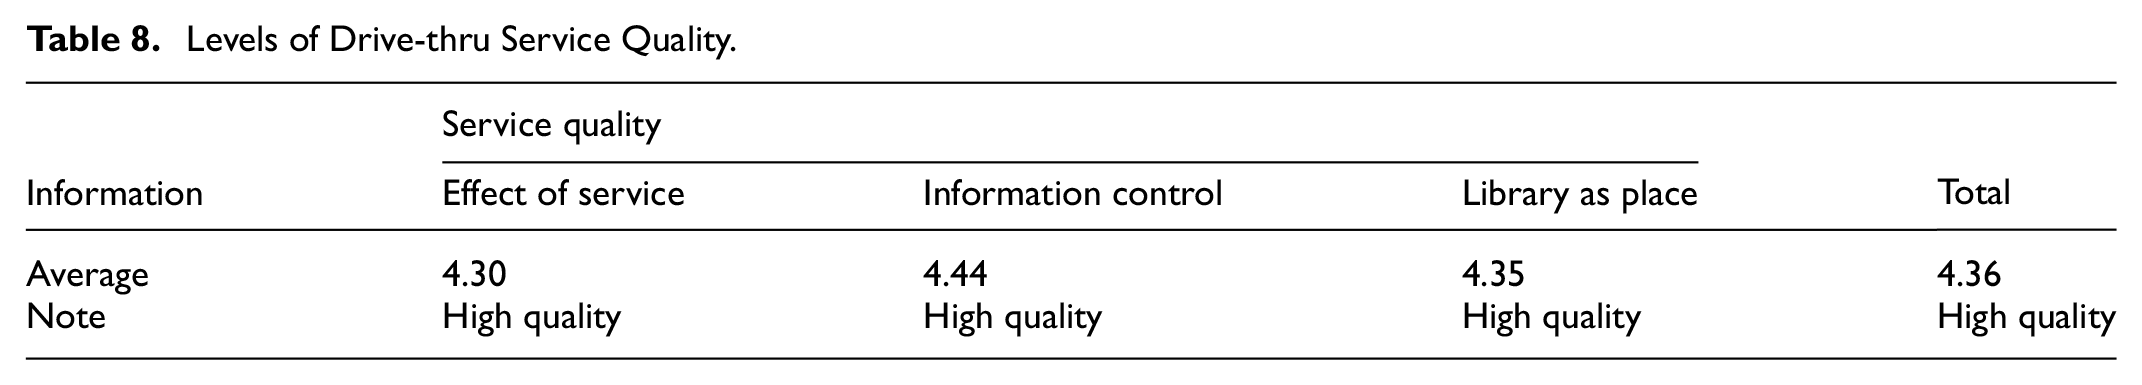
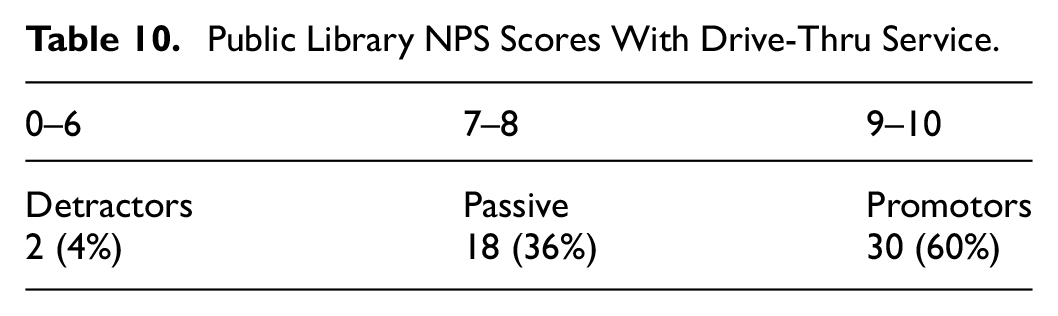
The results, as shown in Table 7, also demonstrate that user satisfaction with drive-through services is generally high, with an average value of 4.34 for the services provided, available collections, facilities, and librarian performance. Table 8 illustrates the quality level of the drive-through service and indicates that the service was rated highly, with an average value of 4.36 for the effect of service, information control, and library as a place. Table 9 further illustrates that drive-through service users intend to use the service again and recommend it to others, with an average loyalty value of 4.44, placing it in the “very loyal” category. Table 10 shows that the Net Promoter Score (NPS) of drive-through users was 54, indicating that most public library users would recommend the library, especially the drive-through services.
Levels of Drive-thru Service Quality.
Loyalty Levels of Drive-thru Service Users.

Public Library NPS Scores With Drive-Thru Service.
Hypothesis Testing
Before conducting the correlation test to determine the relationship between the variables, several basic requirements must be met: validity indicators, normally distributed data, absence of outliers, and fitting and reliable models. The test results revealed that all indicators were valid, as indicated by a probability value below 5%. The variables satisfaction, service quality, and loyalty were deemed reliable based on the test results, demonstrated by the construct reliability value close to 1. Additionally, the dimensions of satisfaction (service, collection, and facility) and service quality (effect of service, information control, and library as a place) were classified as reliable, with construct reliability values close to 1.
Upon analysis, the critical ratio and skewness values were found to be close to 2.58, suggesting that the data was normally distributed. The highest d-squared Mahalanobis value was 48, which remained below the calculated chi-square value of 2.42, indicating the absence of outliers or extreme data. Furthermore, the analysis revealed eight fit indices and nine unfit indices. Consequently, this model can be utilized for further research.
As illustrated in Table 11 on the hypothesis testing, several hypotheses were accepted with p-values less than .01, namely H1: Effect of service quality on satisfaction, namely H2: the effect of service quality on loyalty, H3: Effect of satisfaction on loyalty, H4: the effect of NPS on satisfaction; and H5: the effect of NPS on loyalty, and H6: Effect of service quality on NPS. Several hypotheses were rejected because the p-value was more than .01.
Hypothesis Testing Results.

Qualitative Data Findings
The qualitative data were gathered from interviews with the heads of the libraries and library staff. The result shows that Based on the interview with eight participants from four pubic libraries, 12 themes emerge regarding the drive-thru services in public libraries (Table 12). Participants describe the drive-thru services as lending or borrowing and returning library collections online, either through library systems such as Inlist-lite and SIPALAPA or through WhatAPPs (WA). Users can visit the library website to get access to the systems or instructions for drive-thru services. The initial idea of this service was triggered by the increasing numbers of COVID-19 transmissions in Jawa Timur, however, that is not solely the main reason, the other is the library innovation to increase the library service. That also becomes the main reason why the library has driven drive-thru services, which is due to COVID-19 and service optimizations.
Interview Data Analysis Result.

The library also set new rules for drive-thru services, including the loan systems which users can borrow up to three books within a certain period. However, libraries don’t give penalties or fines for late returns collection. The library only uses a sanction to reduce the number of books they can borrow. The library also has strict membership rules, and users who will borrow should have a library membership and as residents in that coverage area. The more rules about the loan instructions, users should download library loan systems such as SIPALAPA, there are also service operating hours, waiting for staff confirmation for further action, and treat all books that they borrow with COVID-19 procedures.
Many online news articles discuss the development of library driver thru services which are being used as an effort to survive the Covid-19 pandemic. At the start of the pandemic, libraries were one of the public institutions that had to close services to minimize the development of the Covid-19 virus. This means that users’ rights to access information are lost, and libraries are also worried that interest in reading will decrease due to limited access to information. The following is an example of an online news article that discusses the development of library drive thru services in Indonesia (Figures 2 and 3).

Example of an online news article for library drive thru services.

Example of an online news article for library drive thru services.
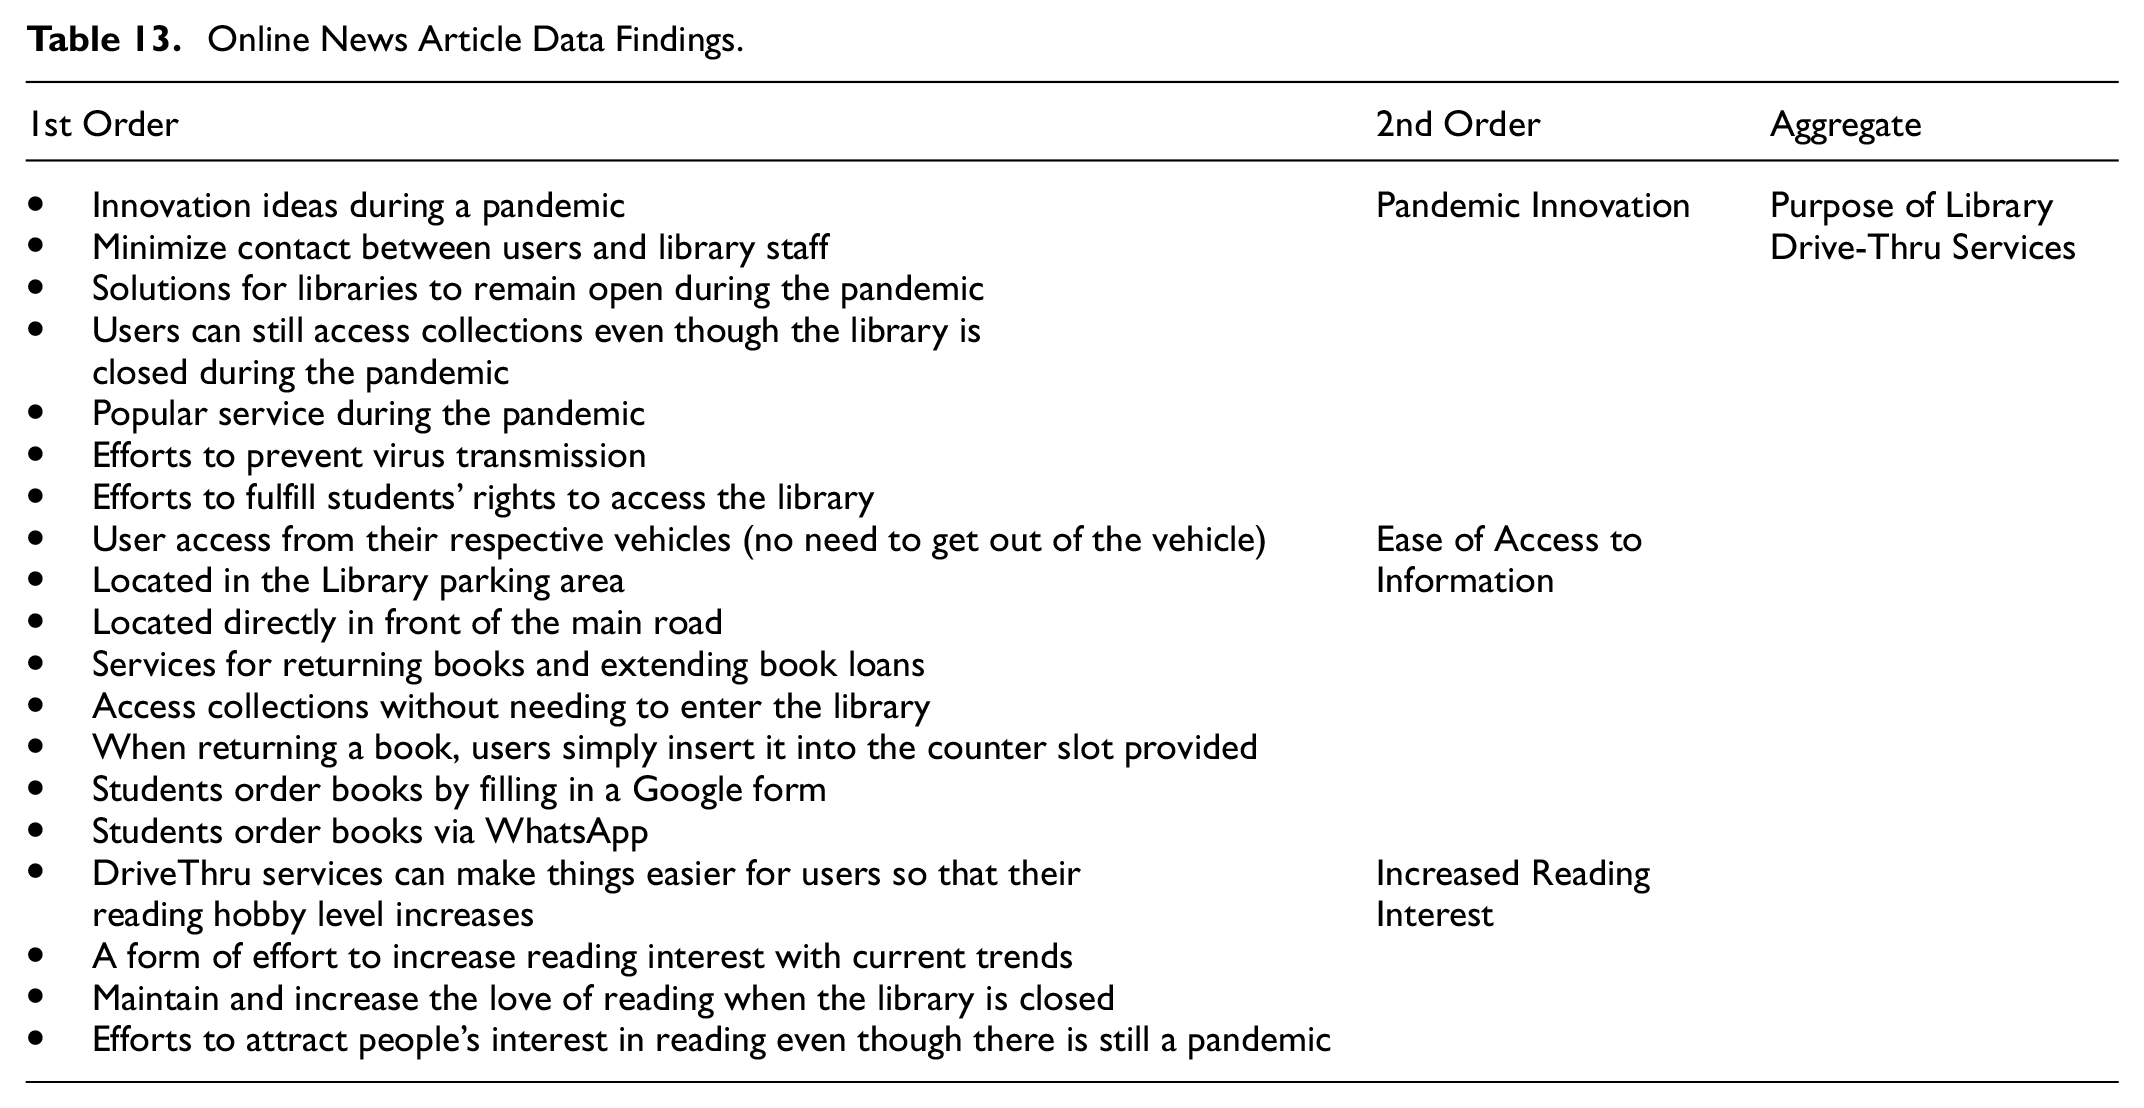
From the findings of the analysis results in online news article discussing library drive-thru services, there are three purposes of library drive-thru services (Table 13), namely as a form of innovation during the Covid-19 pandemic, to make it easier for users to access library collections, and as an effort to improve Public interest in reading. During the pandemic, libraries were forced to close all services to prevent the number of Covid-19 from increasing. However, this raises concerns among librarians when library services cannot be accessed. Starting from there, the creation of the DriveThru service. Libraries can still open services while maintaining health protocols. In this way, users’ rights to access library collections can continue to be fulfilled. The second goal of the drive-thru service is to make it easier to access library collections. Even though we have successfully passed the pandemic period, drive-thru services are still maintained by libraries, even now the number of libraries that have drive-thru services continues to increase. This is because this service can make it easier for users to access collections. Users do not need to get out of the vehicle to borrow, return, or extend the loan collection. Users can order books first via Google Forms and WhatsApp before they borrow books, so the process can be faster. The drive-thru service location is located at the front of the library so that users are not confused when looking for it. Furthermore, the Covid-19 pandemic has raised concerns about the decline in people’s interest in reading, because access to collections is limited. Therefore, the aim of the third drive-thru service is as an effort to maintain and increase people’s interest in reading.
Online News Article Data Findings.
Discussion
Service Quality as Predict Satisfy and Loyalty of Public Library Users
The results of the hypothesis test show that the quality of drive-thru service affects satisfaction, NPS scores, and also user loyalty. Table 11 shows that H1 and H2 are accepted, meaning that this research shows that the quality of the drive-thru service affects the satisfaction and loyalty of users of the service. The results of this study reinforce research that has been conducted by previous researchers regarding service quality which also influences library user satisfaction (Amanullah et al., 2021; Anusha et al., 2020; Mairaj & Naseer, 2013; Mohindra & Kumar, 2015; Olayemi, 2020). Service quality also influences the loyalty of public library users in Indonesia. Implementation of drive-through services can increase library visits and data utilization rates (Lim, 2021). Service quality is an important issue, and efforts to improve the service factors will help provide satisfaction and added value, giving the library a good image. In line with the results of Tamara (2014), service quality affects user value, satisfaction, and loyalty. Furthermore, Kachwala et al. (2021) found that the perception of overall service quality indirectly affects customer loyalty through customer satisfaction with library services.
From the results, the respondents were satisfied with the quality of the drive-through services, including satisfaction with the speed of borrowing and returning collections, service hours, services of the librarian at the drive-through facility, and the number of collections that can be borrowed at the drive-through. They were also satisfied with the health protocols. The findings are similar to those of previous studies which demonstrated that the quality of library services and the environment increases user satisfaction (Mohindra & Kumar, 2015; Mairaj & Naseer, 2013), as well as service quality and user satisfaction in academic libraries (Sriram & Rajev, 2014). Staff reliability, responsiveness, empathy, and assurance significantly influence user satisfaction (Amanullah et al., 2021). This result is in line with previous research that library users are satisfied with the resources and services in the public library (Olayemi, 2020; Anusha et al., 2020)
This research also produces different findings from previous research, namely that drive-thru user satisfaction does not affect user loyalty. The results of this study indicate that user satisfaction does not affect on drive-through user loyalty. This is different from the results of research conducted by (Choshaly & Mirabolghasemi, 2018; Kiran & Diljit, 2017; Xu & Du, 2018). According to Amarsa (2019), consumer loyalty is a positive attitude toward a brand, and commitment to a brand indicates the intention to continue purchasing. Consumer loyalty is caused by the influence of satisfaction and dissatisfaction with the brand, which accumulates continuously and the perception of product quality. Several things need to be done to retain customers, including increasing customer relationships, creating mutually beneficial relationships, offering attractive programs to maintain customer loyalty, and providing benefits to loyal customers.
The Net Promoter Score (NPS) Metrics on Public Library Users
This research also shows that the results of H6 are accepted, meaning that the quality of drive-thru service also influences the NPS score. The quality of library services, which includes the effect of services, information control, and the library as a place, is high and affects the NPS score. Service quality is defined as the delivery output of service and is interpreted as an assessment of service delivery, user expectations, and the value and benefits felt by users (Chan et al., 2022). If the service quality is following what the user expects, it can increase satisfaction and influence the NPS score. Libraries with good service quality do not hesitate to reuse these services, which leads to user loyalty. This will affect the NPS score because NPS is based on user responses to whether they would recommend the service to their friends. NPS is a reputation that institutions maintain when users make recommendations to their friends (Baehre et al., 2022).
This research also proves that the NPS score does not affect the satisfaction and loyalty of drive-thru users at public libraries. Based on Table 10, the NPS score is 54% but did not affect user satisfaction using drive-through services. Satisfaction is the result of the user’s perception after using the product or service expectations (Baquero, 2022). Users who have a good experience with the library can be said to be satisfied with the library services, and that the interaction between the librarian and user was following the user’s expectations. However, a good rating that is recommended by many people does not affect the service in the library. An example is a drive-through facility.
A high NPS score from a library that deserves a recommendation does not affect the satisfaction of drive-through service users. This is because when users are satisfied with the drive-through service, a relatively new facility in the era of the COVID-19 pandemic, the user will remain satisfied and even return to the drive-through service, even if the library does not have a high rating and recommendation. According to Markoulidakis et al. (2020), user experience affects user satisfaction, and this satisfaction has the effect of increasing the NPS value. Therefore, the user experience while using the drive-through service is important, and the NPS score cannot affect it; however, the results of this satisfaction can increase the NPS value. In addition, the need for information from printed sources is an impetus or motivation to use drive-through services during this pandemic, and it does not matter if the library has a high recommendation value.
Challenges for Drive-Thru Service
Based on the interview results (Table 12) there are some challenges faced by the library when delivering drive-thru services, which is majority dealing with the staff availability. This is because the online service means users cannot go to the library, so all circulation processes are done by the librarians. That situation pushed library staff to work extra, by searching themselves, receiving orders through the systems, replying to WA, and picking up and receiving the collections. This finding inline with previous study that states the challenges on running virtual library services during COVID19 pandemics are the instability of internet networks, book delivery service, and service limitation (Winata et al, 2021), another study in Australia also concern the COVID19 transmission during drive thru service and standard internet connection (Mamatha, 2022). The drive-thru service depends on the IT infrastructure, so libraries provide the services with hardware and software to run the good service. However, there are also libraries that their OPAC is not ready for; this also becomes an obstacle. Those services are run by public libraries under the district government, so the services are free, however, for users who like to deliver the books, must pay the delivery service.
The public library also evaluates this program, the evaluation is important to determine whether the service is about to continue or not. The reason this service is continuous is there is a lot of positive feedback from users, the increasing number of users who borrow through this service, and there are no major obstacles that need to worry about. Study in South Korea found that drive thru in libraries is very implemented and can increase reading and utilization rate (Lim, 2021). However, the returned books are decreasing, this is one reason for the program to be considered. In doing so, the head of libraries also gives positive appreciation to the programs, so this is a good sign for continues even COVID-19 to continue. To spread the services, the library conducts intensive promotion through social media, brochures, meetings, and short message broadcasts.
Conclusion
The results of this research show that loyalty is influenced by service quality and user satisfaction with the services provided. Different results were also obtained from this study which showed that service quality affected the NPS score, while service satisfaction did not affect the NPS score. The same thing also found that the NPS score did not affect user loyalty. So, the NPS score does not necessarily reflect the loyalty of drive-thru service users in public libraries.
Library drive-thru service arrives to face challenges during the COVID-19 pandemic, provide ease of access to information resources, and service optimization. The library will use this service alongside with the regular service after the pandemic ends. So, library drive-thru service is an innovation that arrived during the COVID-19 pandemic, but now it has become an alternative service for the library that will continue to fulfill users’ information needs.
Limitation
The limitation of this study is that the data collected only used four public libraries, because during the Covid-19 pandemic, not many public libraries provided drive-thru services. There were only 50 respondents in this study. Obstacles in getting respondent responses due to the pandemic. The Covid-19 pandemic is something that is beyond prediction, a similar incident has never happened before so it is difficult to find comparisons of events in the past.
Future Research
This research was only conducted in public libraries in Indonesia, the same model could be tested in other types of libraries such as college libraries or school libraries. Future research should investigate user opinions related to drive-through services, what features they desire, and whether this service is still suitable for implementation in libraries in the new normal era.
Managerial Implications
The results of the study indicate that service quality will affect satisfaction, loyalty, and NPS scores, So public libraries must improve the quality of drive-thru services in particular and the quality of other services as well. Public libraries can use the NPS score to get quick results regarding the services provided, this is because knowing the NPS score can also see the quality of services provided in the library. Apart from paying attention to the score, it is also necessary to see the answer to why the user gave that score to the library. These results need to be processed and analyzed to improve library services to the maximum.
Practical Implication
This result can be used by other libraries that will implement drive thru services. Libraries can use this as consideration when they decide to adopt drive thru, study the best practice especially the innovation and drivers, and as a lesson learned dealing with challenges especially dealing with IT infrastructure and the staff readiness.
Theoretical Contribution
This study will contribute to the advancement of library service theory especially the drive thru services, library innovation, and customer loyalty.
Footnotes
Acknowledgements
We also thank to Universiti Malaya as university collaborator in this research.
Author Contributions
All authors designed the study. Dyah Pusputasari Srirahayu, Dessy Harisanty, Endang Fitriyah Mannan, Nove Eka Variant Anna collected the data, conducted statistical analyses, and wrote the manuscript. M. K. Yanti Idaya Aspura proofreaded the manuscript.
Funding
The author(s) disclosed receipt of the following financial support for the research, authorship, and/or publication of this article: This research is funded by Universitas Airlangga under International Research Collaboration program, project no SK Rektor Universitas Airlangga Nomor 929/UN3/2021.
Declaration of Conflicting Interests
The author(s) declared no potential conflicts of interest with respect to the research, authorship, and/or publication of this article.
Data Availability Statement
The data supporting the results of the study can be obtained by contacting the corresponding author.