
Abstract
Agricultural product prices have risen due to climate change in recent years. Therefore, more agriculture policies must be adopted to stabilize prices. A suitable agricultural policy development requires past experience and appropriate agricultural prediction models. However, an excellent agricultural prediction model is not easy to develop because it is affected by many climate factors. In addition, climate change varies from region to region, making it challenging to develop accurate prediction models. Thus, this study proposes an agricultural prediction model by selecting climate change variables. The experiment results show that the proposed model brings higher prediction accuracy (measured by the mean absolute percentage error (MAPE), coefficient of variation (CV), and directional symmetry (DS)), especially in prediction direction trends. Accordingly, the proposed model could be used to assist in agricultural policymaking and stabilize the agricultural economy. For example, the results can be used to predict yields early on to improve risk management and crop insurance programs. Furthermore, it offers advantages in assessing the effect of climate change on the prediction model, exploring the different effects of climate change in various regions, and providing a cross-regional agricultural economic prediction model.
Introduction
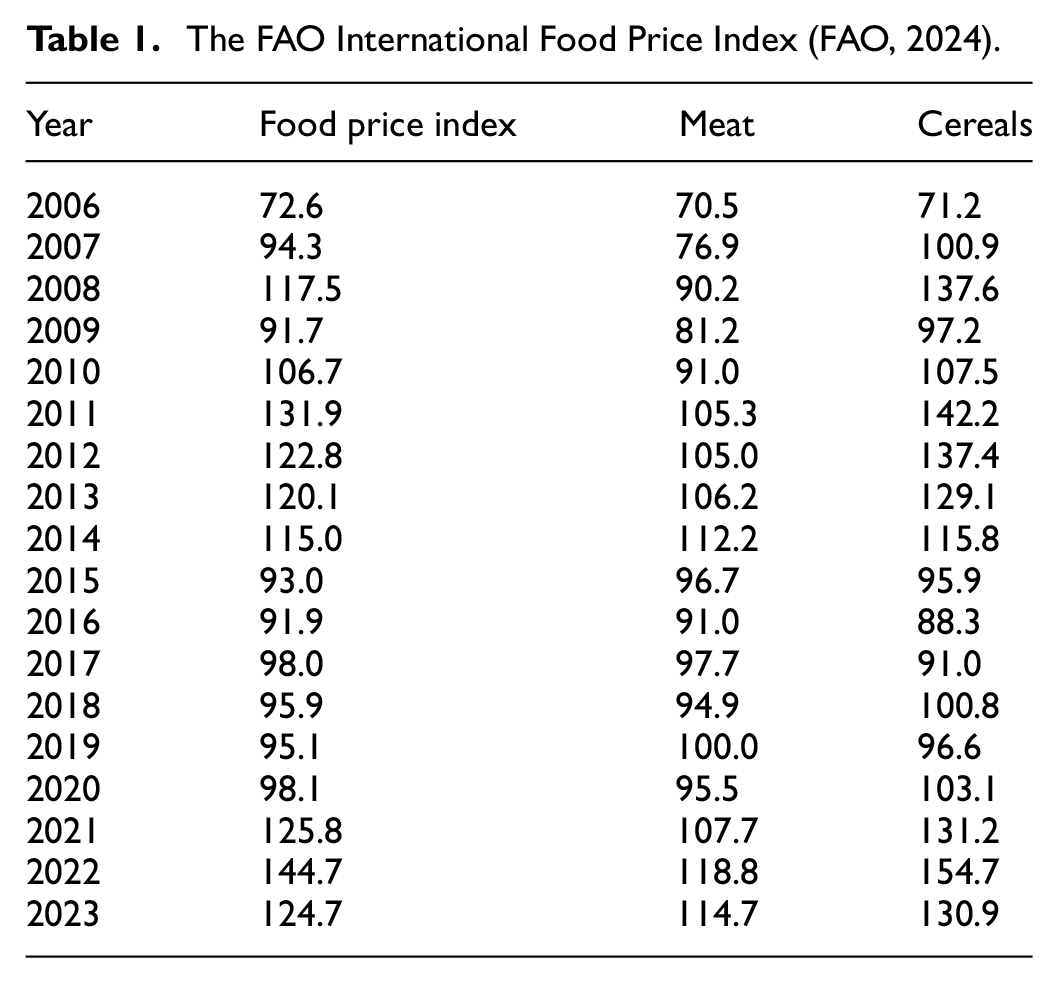
Although agriculture is a traditional and basic industry for most countries, the stability of agricultural output remains an extremely important issue. Food security is critical since staple foods such as rice, corn, and wheat play a vital role in people’s livelihoods. Although the food shortage crisis has become less frequent in recent years, severe climate change or epidemics can still lead to food inequality or rising prices. According to the Food and Agriculture Organization of the United Nations (FAO, 2024), as shown in Table 1, the global food price index reached its first peak between 2011 and 2014, then declined sharply—possibly due to epidemics—and rose again from 2021 to a current high of 144.7 in 2022. Notably, when the Food Price Index increases significantly, the Cereals Price Index rises even more dramatically than the Meat Price Index, which may trigger public discontent.
The FAO International Food Price Index (FAO, 2024).
Recently, high cereal prices have also become apparent in Taiwan. For example, Taiwan’s Consumer Price Index (CPI) for Cereals & Cereal Products has been significantly higher than the General Index since about 2019 (Directorate General of Budget, Accounting and Statistics, Taiwan, 2024), as shown in Figure 1. Although Taiwan is renowned for its advanced high-tech industries, its agriculture industry is also well-developed. Beyond technological advancements, Taiwan’s favorable geographical location contributes significantly to its agricultural potential because Taiwan is located on the tropical/subtropical boundary and is surrounded by the sea. However, the output of agricultural products in Taiwan has been unstable in recent years; therefore, the government must alter its policies to stabilize prices.

CPI for general index and cereals & cereal products in Taiwan (Directorate General of Budget, Accounting and Statistics, Taiwan, 2024).
Generally, the government must modify policies to alter public grievances caused by soaring prices (Slabe-Erker et al., 2016; Xiong et al., 2015). For example, when Taiwan joined the WTO, it emphasized in promotional materials that agricultural yields would be predicted and that domestic and foreign price data would be integrated to help farmers plan and adjust planting (Ministry of Agriculture Taiwan, 2002). However, much literature suggests that new policies should be developed through data analyses and prediction models rather than solely on past empirical rules (Kuan, Leu, & Lee, 2022; Priyadarshini & Abhilash, 2021; Sun et al., 2022). Furthermore, a suitable agricultural prediction model is necessary and valuable for farmers, governments, and agribusiness industries to enhance the management and development of the agricultural economy (Allen, 1994). For example, the crop yield prediction model could help agriculture managers decide on appropriate marketing and storage measures (Rai et al., 2022). An accurate prediction model would impact management decisions in long-term land use planning to achieve sustainability of the agricultural economy (Al-Adhaileh & Aldhyani, 2022). A prediction model would bring more critical information for the agricultural economy, including market supply, demand, and price information (L. Wang & Tan, 2022). Therefore, the study of agricultural prediction models has become increasingly popular.
Traditionally, many researchers have used statistical methods in agriculture to enhance agricultural production quality (Chang, 2011; Ranka & Sharma, 2012; Street, 1990). Recently, more and more researchers have applied data mining, machine learning, or artificial intelligence (AI) in agriculture data analysis (Aworka et al., 2022; Hong et al., 2023; Kuan, Leu, Lin, & Lee, 2022; Ou, 2012), especially in agricultural prediction issues. For example, Ou improved the gray forecasting model based on the genetic algorithm for agricultural output prediction (Ou, 2012). Kuan et al. assessed the performance of several different prediction models for long-term agricultural output prediction (Kuan, Leu, Lin, & Lee, 2022). Recently, the drastic changes in agricultural output in many countries have made it challenging to predict agricultural production and may also jeopardize the development of the domestic economy. Some literature considered that it may be related to climate change because agricultural outputs are susceptible to significant variations in the impacts of climate change (Kuan, Leu, & Lee, 2022; Mano & Nhemachena, 2007). Therefore, more and more studies consider climate data when analyzing agricultural data (Parviz, 2019). To predict Maryland corn and soybean yields, Kaul et al. used an artificial neural network (ANN) based on the average monthly and weekly rainfall (Kaul et al., 2005). Liu et al. integrated artificial neural networks (ANN) and gene-expression programing on the prediction of rice (Oryza sativa L.) growth according to accumulated air temperatures based on growth degree days for precise rice production (Liu et al., 2022). However, climate data are numerous and span many months, thus significantly increasing the difficulty of their analysis. Accordingly, Kuan et al. suggest that climate variables should be selected before analysis when constructing an agricultural prediction model based on climate data (Kuan, Leu, & Lee, 2022). However, because of the uncertainty of climate factors, it not only causes much disturbance to farmers but also increases the difficulty of analyses (Kuan, Leu, & Lee, 2022; Meza et al., 2008).
In summary, prior studies emphasize the need for predictive models to drive policy decisions. However, the effects of climate change factors on the prediction model have not yet been investigated. Based on the literature, this study develops a hybrid agricultural prediction model that integrates climate change variables to enhance prediction accuracy and inform policy decisions. Developing a model for predicting rice yield in Taiwan may encounter the problem of having a large amount of climatic data and the problem that rice crops cross regional boundaries, leading to increased difficulty in analyses. Despite the uncertainty of climate factors, they are still one of the main factors affecting agricultural output. Therefore, for these reasons, this study proposes a climate factor-based agricultural prediction model that can be applied across various regions without the necessity of developing different prediction models for each region.
When data is spread across regions, spatial data analysis models could analyze it. Therefore, the main idea of this study is to propose a hybrid prediction model strategy that includes spatial analysis models (e.g., Moran’s I) to analyze the effect of climate factors in different regions for predicting rice yield. In the future, the government or relevant institutions can use this model to make applicable policies to stabilize the economy and prices. This study has three main objectives: (a) to explore the differences in climate change across various regions, (b) to assess the impact of climate change on predictive models, and (c) to develop a cross-regional agricultural economic prediction model.
The remaining sections of this study are organized as follows. Section 2 thoroughly introduces the dataset and the analysis process of the proposed model. Sections 3 and 4 report the results and discussion. Finally, we conclude in Section 5.
Materials and Methods
Datasets
The dataset used in this study was collected from two databases: the rice yield database, managed by the Taiwan Agricultural Data Open Platform (Ministry of Agriculture Taiwan, 2024), and the climate database, collected by the Central Weather Administration in Taiwan (Central Weather Administration Taiwan, 2024). The following subsections will introduce these databases.
The Rice Yield Database
Taiwan is located on either side of the Tropic of Cancer (Figure 2), and rice can be grown in almost all counties and cities. With central and southern Taiwan being the main rice-producing regions and the first crop season being the primary crop season, this study collected rice yield data for the first crop season from 2003 to 2019 in regions including Taichung, Changhua, Yunlin, and Chiayi. These regions are the primary farmland areas, making them ideal for evaluating the effects of climate change on agricultural economic prediction models across various climatic zones.
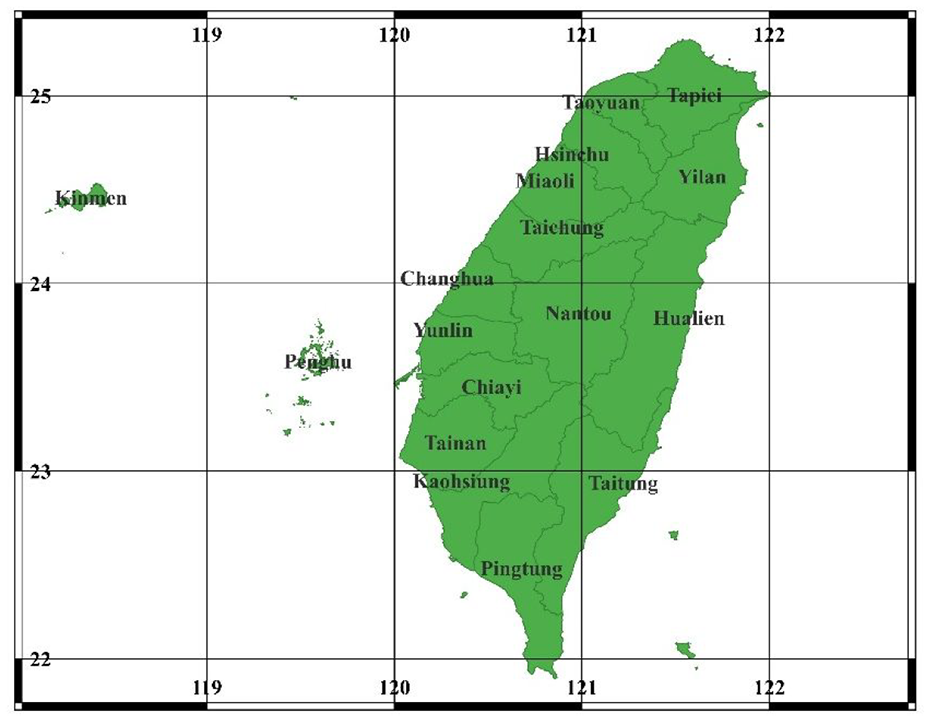
The location of Taiwan.
The Climate Database
In this study, climatic factors from February to June for the first crop season were selected, including 11 variables: average temperature (avgtemp), maximum temperature (maxtemp), minimum average temperature (mintemp), rainfall (rainmm), rainfall days (rainday), cumulative solar radiation (radiation), ground temperatures at various depths (gtemp5, gtemp10, gtemp20, gtemp50, gtemp100). Since each climate variable spans 5 months, the dataset comprises 55 climate variables (11 climate variables * 5 months).
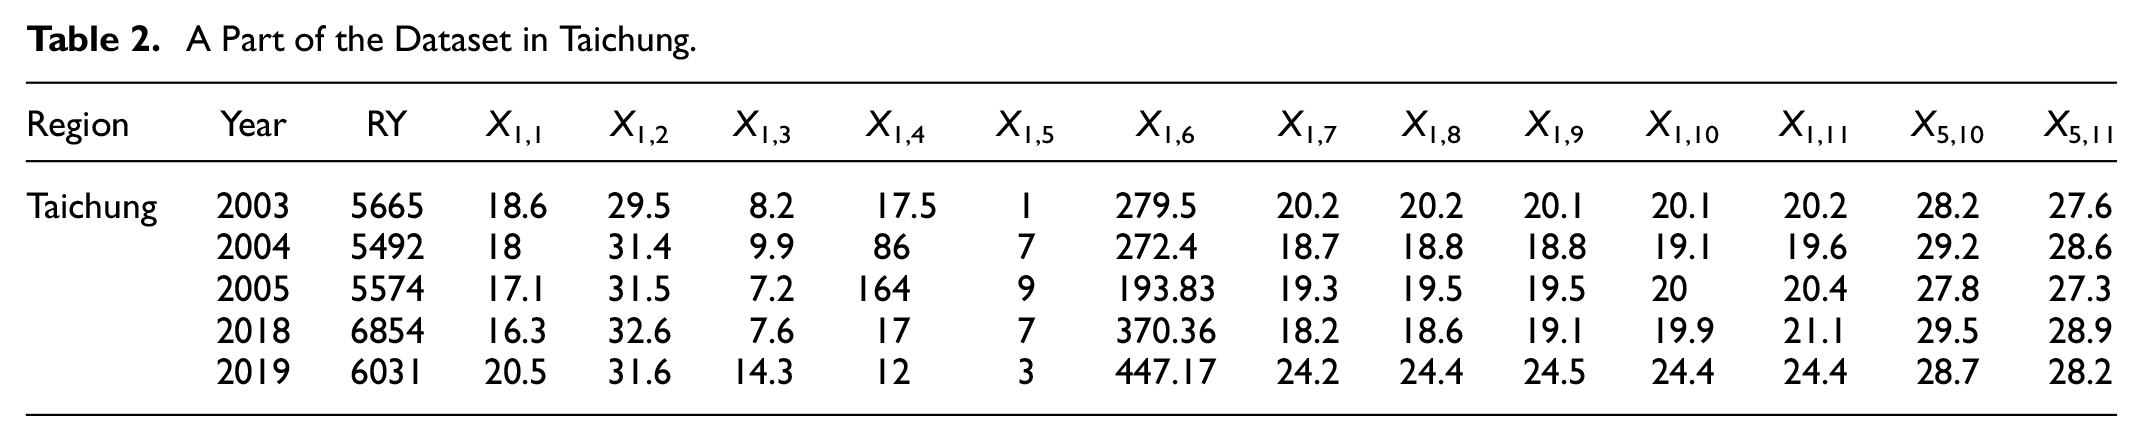
In the analysis process, these two datasets were combined. Table 1 presents an example subset of the dataset, while Table 2 outlines the variables, where RY denotes the rice yield for the first crop season, and X i,j denotes the ith month and the jth climate variable (i = 1 for Feb., i = 2 for Mar., i = 3 for Apr., i = 4 for May, i = 5 for Jun.; j = 1 for avgtemp, j = 2 for maxtemp, j = 3 for mintemp, j = 4 for rainmm, j = 5 for rainday, j = 6 for radiation, j = 7 for gtemp5, j = 8 for gtemp10, j = 9 for gtemp20, j = 10 for gtemp50, j = 11 for gtemp100). The units of the dataset are described as follows: (a) the unit of the rice yield is kg/hectare; (b) the unit of average temperature is °C ; (c) the unit of rainfall is cumulative mm; (d) the unit of rainfall days is day; (e) the unit of cumulative solar radiation is MJ/m2.
A Part of the Dataset in Taichung.
The Proposed Model
As outlined in the Introduction, the main objective of this study is to propose a hybrid prediction model that integrates spatial analysis to assess the effect of climate change on rice yield. The proposed model consists of two major stages to achieve the objectives: (a) assessing climate change across regions using spatial analysis and (b) predicting rice yield by using climate change variables. Figure 3 and the following sub-sections show the proposed model’s analysis procedure.
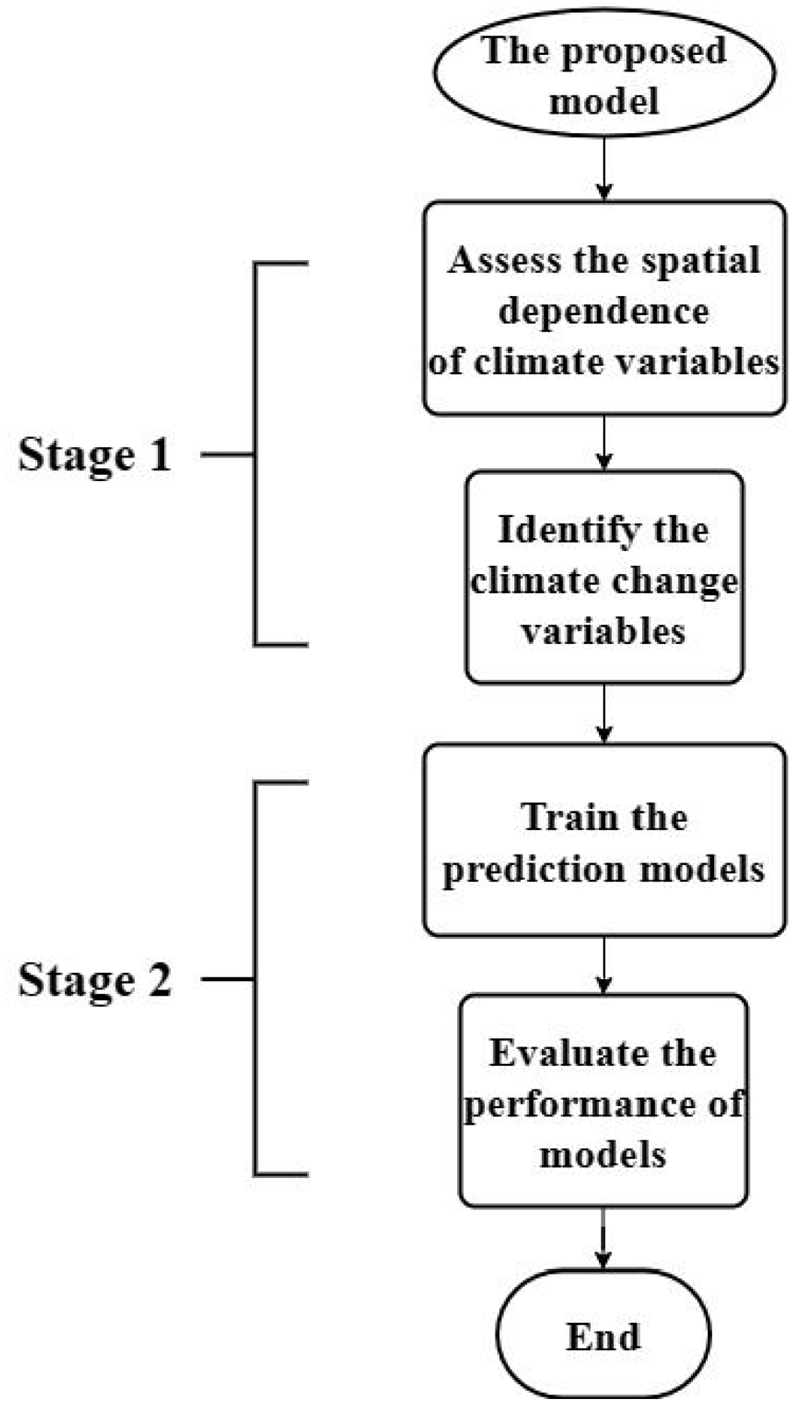
The flowchart of the proposed model.
Assess the Differences in Climate Change Across Regions
This study wants to propose a prediction model based on climate change that can be applied to different regions. Therefore, the first stage uses spatial data analysis to evaluate regional differences in climate change. The first stage includes two steps, which are described in the following.
If neighboring regions interact, then it could be considered existential spatial autocorrelation (Getis, 1995; Tobler, 1970). Moran’s I is a well-known spatial model to test spatial autocorrelation. Moran’s I was first proposed by Moran (Moran, 1950), and it is now applied in many fields (Isazade et al., 2023; Y. Wang et al., 2023). In 1995, Anselin proposed a modified Moran’s I for regional spatial autocorrelation called local Moran’s I (Anselin, 1995). The definitions of the Moran’s I and the local Moran’s I are shown in Equations (1) and (2), respectively:
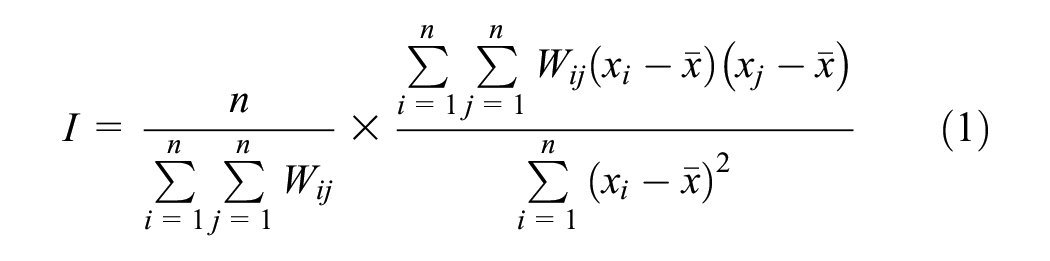

In Equations (1) and (2), Wij denotes the spatial weight matrix used to describe the proximity of regions to regions; xi and xj denote the observations in i and j regions, respectively;
Because local Moran’s I is easy to use statistical methods to test spatial dependence, if a variable is significant, it behaves differently in different regions and is affected by its neighbors. Therefore, this study first uses the local Moran’s I to test the spatial dependence of climate variables and then selects the significant climate variables for Step 2 of Stage 1.
Since the local Moran’s I can be applied only to a single year, the data from 2003 to 2019 were analyzed individually. Therefore, in this study, the local Moran’s I test was performed for the climate variables of each year’s data. Subsequently, we store all test results to select important climate variables identified as climate change. Table 3 is an example of the p-value of the local Moran’s I test for average temperature in February (avgtempFeb). Finally, we rely on agricultural experts to assess which climate variables are the most important. The main criterion for the assessment is that the average of recent years is different from that of the past. For example, if a variable is almost significant in recent years but primarily insignificant in the past, then the variable is identified as the climate change variable. These selected variables are then used in Stage 2.
The p-Value of the Local Moran’s I Test for avgtempFeb.

Build the Prediction Model
There are also two steps in Stage 2, which include the training and evaluation models. The descriptions of Stage 2 are shown in the following.
Because the main objective of this study is to assess the impact of climate change on agricultural economic prediction models, this study is based on the work of Kuan et al. (Kuan, Leu, & Lee, 2022) to select three popular prediction models, including support vector regression (SVR), random forest regression (RF), and multivariate adaptive regression splines (MARS) models, to compare the influence of climate change variables. Details of these models are available in the referenced literature (Kuan, Leu, & Lee, 2022).
Before training the prediction models, the analyzed dataset must perform data normalization. This study uses the Min-Max normalization to rescale climatic variables between 0 and 1. After data normalization, the dataset has to split into training and test datasets. The training data set is used to prepare the prediction models, and the test datasets evaluate their performance. The training data from 2003 to 2013 and the test data from 2014 to 2019 are used in this study. Consequently, climatic variables are considered independent variables (input variables X), and rice yield is considered dependent variables (output variables Y) to train prediction models.
After training prediction models, the mean absolute percentage error (MAPE) is used as a performance measure to evaluate the performance of prediction models. The MAPE, used in comparing prediction models (Ahlburg, 1982), has also been widely used to measure prediction models’ accuracy (Kuan, Leu, Lin, & Lee, 2022; Ou, 2012). When the value of the MAPE is lower, the prediction ability is better. The definition of the MAPE is in Equations (3), where At and

In addition to using the MAPE to verify the prediction accuracy of the models, this study also measures the coincidence in the prediction direction trends between the predicted and the actual values by using directional symmetry (DS; Kuan, Leu, Lin, & Lee, 2022). The definition of DS is defined as in Equation (4):
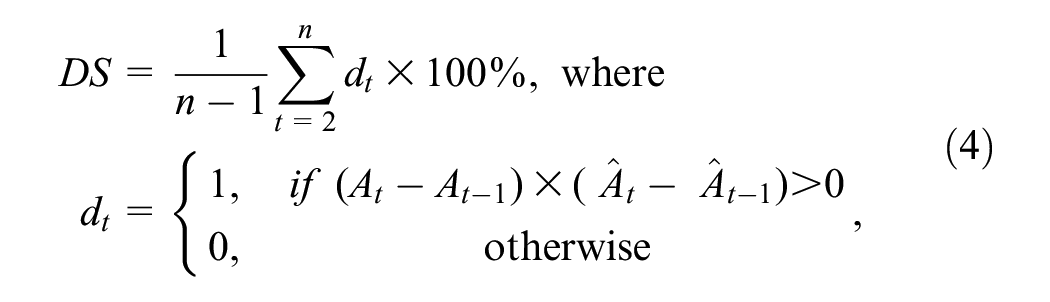
where At−1 and
This study finally uses the coefficient of variation (CV) to assess the prediction stability of models. The definition of CV is defined as in Equation (5):

In Equation 5, s and
Results
Descriptive Statistics
Table 4 summarizes the average yield for the first crop season and the average of climate variables in February (2003–2019) for different regions in Taiwan. According to Table 4, Yunlin is the region with the highest average rice yield per hectare among the selected five regions. In fact, Yunlin also has the highest average rice yield per hectare, which is consistent with official data (Ministry of Agriculture Taiwan, 2024). In addition, almost all climate variables are related to spatial geography. For example, locations in southern Taiwan generally have higher average temperatures and less rainfall (Table 4). The complete statistics of each variable in different months are shown in Supplemental materials (Supplemental Table S1).
The Average Yield for the First Crop Season and the Average of Climate Variables in February.

Select Climate Change Variables
Table 5 presents an example of climate change variables selection. Agricultural experts noted that the average temperature in February was significant for nearly all years before 2012 but only about half of the years thereafter, indicating a shift in its spatial relationship. This indicates that the spatial relationship of average February temperatures has changed; therefore, it should be considered a variable of climate change. Based on the selection strategy, there are 19 climate variables selected, such as “avgtempFeb,”“maxtempFeb,”“mintempFe,”“rainmmFeb,”“raindayFeb,”“radiationFeb,”“mintempMar,”“radiationMar,”“maxtempApr,”“mintempApr,”“rainmmApr,”“radiationApr,”“maxtempMay,”“rainmmMay,”“radiationMay,”“gtemp5May,”“avgtempJun,”“radiationJun,”“gtemp50Jun.” The complete local Moran’s I testing results of each variable in different months are shown in Supplemental materials (Supplemental Table S2).
The Local Moran’s I Testing Results for Average Temperature in February.
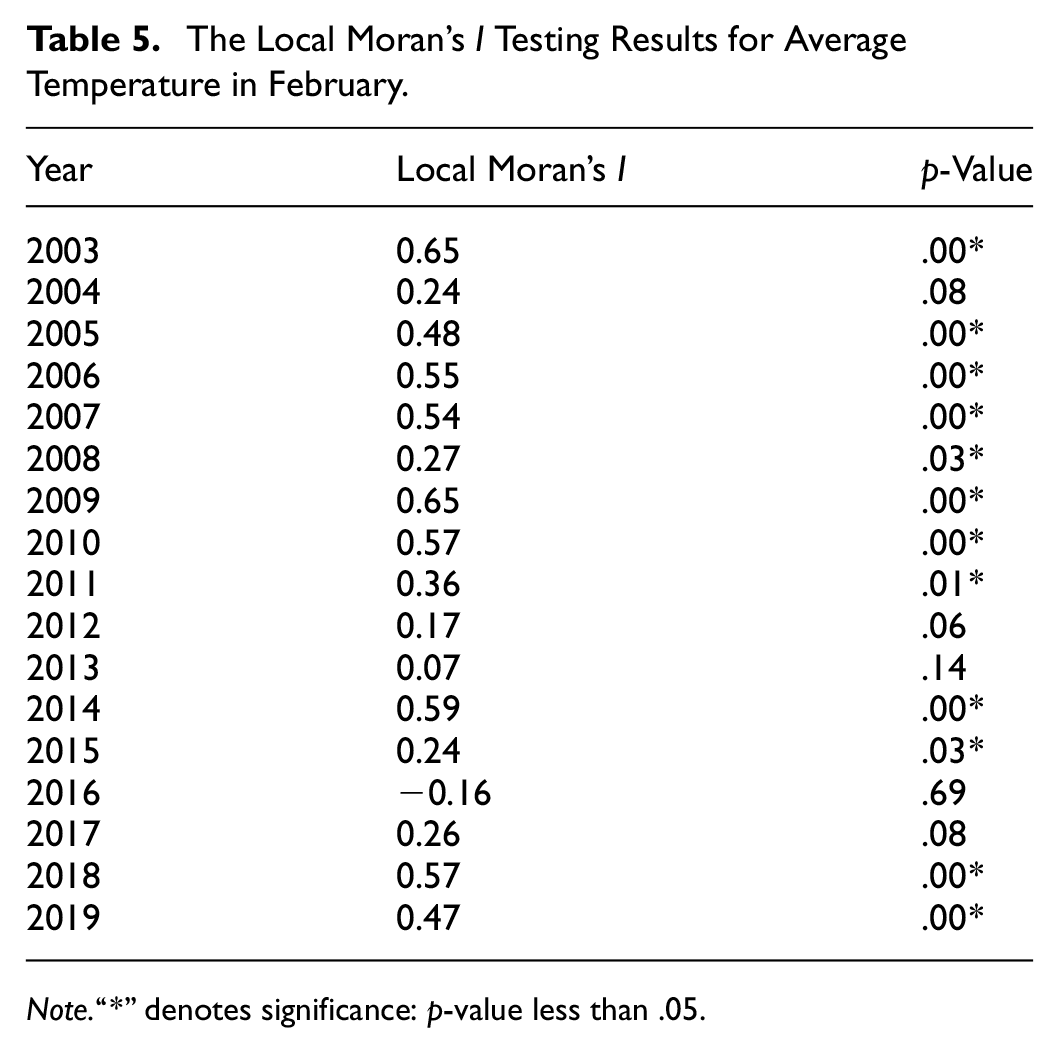
Note.“*” denotes significance: p-value less than .05.
Compare the Performance of Models
Tables 6 and 7 compare the performance of models. In Tables 6 and 7, the prediction model with the symbol “1” indicates the model used all climate variables, and the model with the symbol “2” indicates the model used only the selected climate change variable.
The Mean Absolute Percentage Error (MAPE) Results of the Test Dataset.
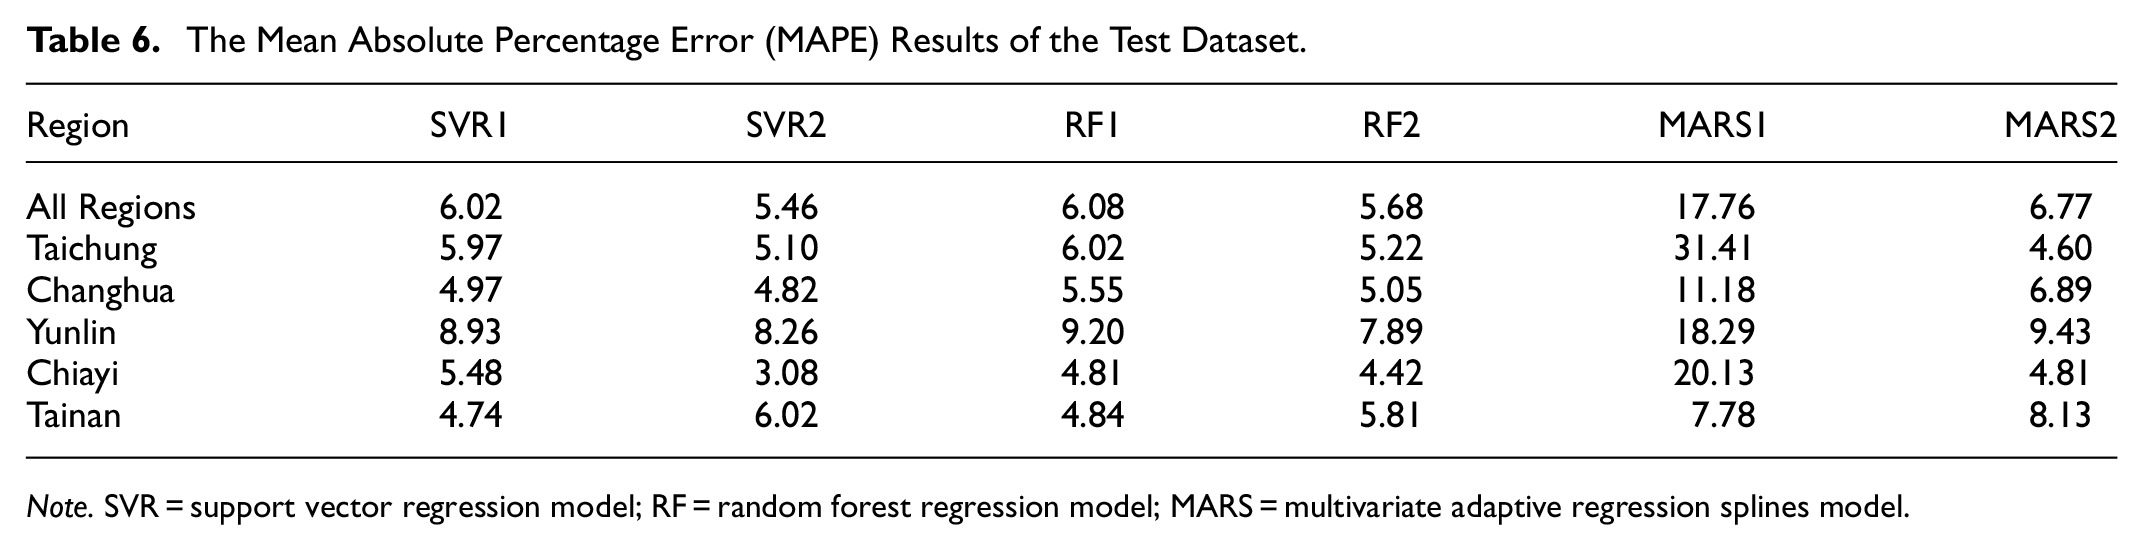
Note. SVR = support vector regression model; RF = random forest regression model; MARS = multivariate adaptive regression splines model.
The Directional Symmetry (DS) Results of the Test Dataset.

Note. SVR = support vector regression model; RF = random forest regression model; MARS = multivariate adaptive regression splines model.
Table 6 shows the results of MAPE, and we use the results of Table 6 to compare the prediction performance with the test dataset. According to Table 6, the MAPE ranges from 4.74 to 31.41 for models with all climate variables; the MAPE ranges from 3.08 to 9.43 for models with the selected climate change variables. The prediction performance of models with the selected climate change variables is better than that of models with all climate variables, especially for the MARS model. According to the results, Yunlin needs to pay attention because the MAPE of any model is almost the highest in other regions.
Table 7 shows the results of DS, which measures the performance of the prediction direction trends between the predicted and the actual values. According to Table 7, the DS values range from 20 to 60 for models with all climate variables; the DS values range from 20 to 100 for models with the selected climate change variables. The results of Table 7 are similar to those of Table 6; the performance of the prediction direction trends of models with the selected climate change variables is much better than that of models with all climate variables. Among them, the SVR with the selected climate change variables model performs the best because its average DS value is more than 70. With all of the models, the direction symmetry is lowest for Changhua.
Table 8 shows the CV results, which measure the prediction stability of models. According to Table 8, the CV values range from 50.26 to 112.52 for models with all climate variables; the CV values range from 26.11 to 84.74 for models with the selected climate change variables. The performance of the SVR with the selected climate change variables model is almost the best because its average CV is almost the lowest or close to the lowest. Therefore, the SVR with the selected climate change variables model brings the most stable prediction performance.
The Coefficient of Variation (CV) Results of the Test Dataset.
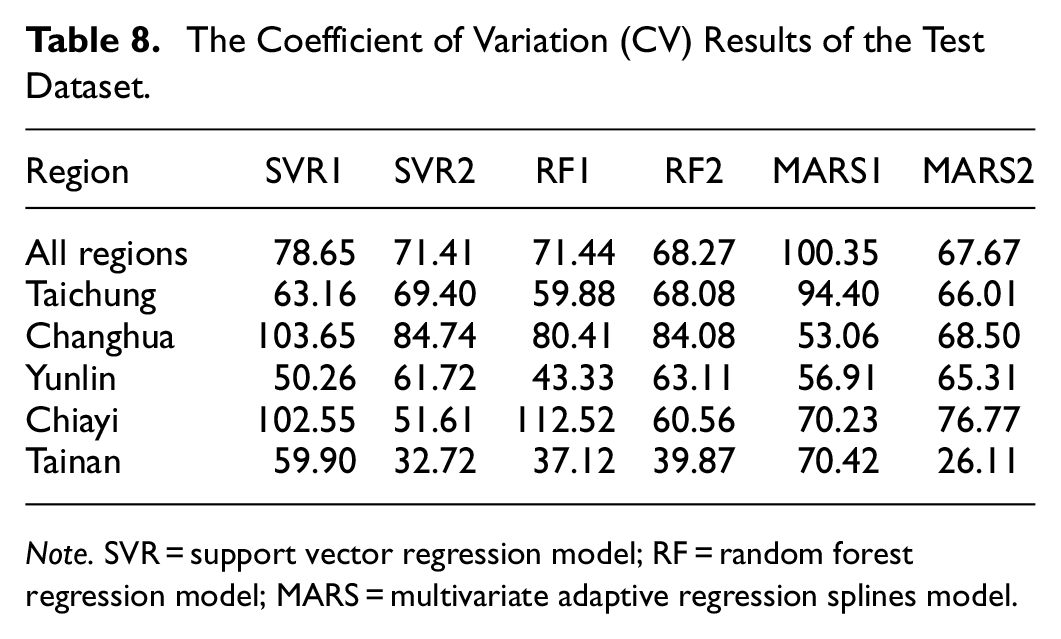
Note. SVR = support vector regression model; RF = random forest regression model; MARS = multivariate adaptive regression splines model.
Discussion
According to the results of Section 3.3, we find that incorporating selected climate change variables consistently improves prediction performance across different models. The performance differences in MARS are the most significant, as the models using selected climate change variables outperform those using all climate variables. In most cases, the RF with the selected climate change variables model is better than the RF with all climate variables model, but the difference is insignificant. The prediction stability of SVR, RF, and MARS with selected climate change variables models is similar. Whether they are in MAPE or CV, the performances are very close. However, the performance of SVR with the selected climate change variables model in DS is the best.
Compared with MAPE and CV, DS is particularly important as it directly informs precise agricultural policies. According to the results of Table 7, the DS values of models with climate change variables selection are significantly better than those without climate change variables selection. Based on the experiment results of this study, the climate change variables could affect the prediction performance of models. Moreover, experimental results confirm that climate change variables substantially influence model performance, and our findings are consistent with previous studies (Aworka et al., 2022; Kuan, Leu, & Lee, 2022; Kuan, Leu, Lin, & Lee, 2022; Sun et al., 2022). These findings support the integration of SVR into the proposed model for enhanced prediction reliability. Therefore, the SVR model is more suitable to integrate into the proposed model to build an agricultural economic prediction model.
Furthermore, reducing the number of variables from 55 to 19 improves the model’s explanatory power. In Taiwan, rice is a crucial staple crop. However, due to Taiwan’s unique topography and susceptibility to high temperatures and humidity, rice diseases and pests are pretty frequent, significantly impacting yield. Among these, rice blast disease is the most severe. Apart from the months corresponding to Taiwan’s primary rice-growing season, the environmental factors selected in our model align closely with those critical for rice blast disease (Liu et al., 2021). Additionally, Liu et al. utilized the Growing Degree Day (GDD) model based on maximum and minimum temperatures to predict growth stages (Liu et al., 2022). In summary, the climate variables identified in our study significantly predict rice growth and disease outcomes in Taiwan.
Integrating climate change variables with spatial analysis significantly enhances the accuracy and stability of rice yield predictions. These findings have several important implications for agricultural policy:
(a) Improved risk management and crop insurance programs: With more accurate yield predictions, policymakers can design crop insurance schemes that better reflect the actual risks faced by farmers. By incorporating prediction models, insurance premiums and coverage can be adjusted to account for regional variability and extreme weather events, thus reducing financial risks for farmers.
(b) Development of early warning systems: The model’s ability to capture trends and variability in yield predictions lays the groundwork for creating early warning systems. By forecasting potential yield reductions, authorities can implement timely interventions, such as emergency relief measures and contingency planning, to protect both farmers and consumers from sudden supply shortages.
Conclusions
Research Contributions
Implementing an effective agricultural economic prediction model is essential for stabilizing food prices. However, agricultural economic prediction models are not easy to implement because many factors, such as climate, always affect agricultural outputs, growth stage, and occurrence of pests and diseases, especially in rice. However, climate factors are also affected by the regional environment. Thus, different prediction models must be constructed for various regions, as climate impacts may not be the same in different regions. Our study presents a hybrid model that integrates spatial analysis and machine learning to predict rice yield, demonstrating that selected climate change variables can significantly enhance prediction performance.
According to the results, the proposed model has two contributions: (a) the proposed model effectively examines spatial analysis to understand climate change across various regions and incorporates recommendations from agricultural experts to pinpoint the factors of climate change specific to these regions; (b) the experimental results assess how climate change variables impact the prediction model’s performance. Furthermore, the selected climate variables in this study have also been recognized for their impact on agricultural output by many literatures and play a very important role in predicting rice growth and disease in Taiwan.
In addition to the above two contributions, this study also highlights that the SVR-based model brings better performance, consistent with the literature. Thus, this study recommends integrating the SVR model into the proposed model to build an agricultural economic prediction model. In the future, the government or relevant institutions can use the proposed model to make agricultural policies to stabilize the agricultural economy and food prices.
Research Limitations and Future Research
This study collects Taiwan’s rice yield and climate dataset from 2003 to 2019. The relatively short period (17 years) may limit the ability to capture long-term climate trends and extreme events. Furthermore, the initial selection of climate variables might also affect the performance of the models. Therefore, four recommendations can be made for future research based on the findings of this study: (a) data collection should continue to increase because the size of the dataset might affect the performance of models; (b) the collection of climate variables, such as atmospheric pressure and wind patterns, should be more comprehensive to improve model performance; (c) if climate data is collected through technologies such as IoT, it will be closer to the climate change in the actual farmland, and (d) although this study integrates spatial analysis to explore climate change in different regions, the spatial analysis could not use for multiple years. We would develop a spatial analysis model for spatio-temporal data.
Supplemental Material
sj-docx-1-sgo-10.1177_21582440251336535 – Supplemental material for Assessing the Impact of Climate Change on Agricultural Economic Prediction Models: An Example of the Rice Yield Prediction Model
Supplemental material, sj-docx-1-sgo-10.1177_21582440251336535 for Assessing the Impact of Climate Change on Agricultural Economic Prediction Models: An Example of the Rice Yield Prediction Model by Wen-Shin Lin and Chien-Pang Lee in SAGE Open
Supplemental Material
sj-docx-2-sgo-10.1177_21582440251336535 – Supplemental material for Assessing the Impact of Climate Change on Agricultural Economic Prediction Models: An Example of the Rice Yield Prediction Model
Supplemental material, sj-docx-2-sgo-10.1177_21582440251336535 for Assessing the Impact of Climate Change on Agricultural Economic Prediction Models: An Example of the Rice Yield Prediction Model by Wen-Shin Lin and Chien-Pang Lee in SAGE Open
Footnotes
Acknowledgements
This study was supported by National Science and Technology Council (NSTC), Taiwan (grant number NSTC 112-2313-B-020-016; NSTC 113-2410-H-141-030-MY2).
Ethical Considerations and Informed Consent Statements
The data used in this research is all publicly available and does not require IRB.
Funding
The author(s) disclosed receipt of the following financial support for the research, authorship, and/or publication of this article: National Science and Technology Council (NSTC), Taiwan (grant number NSTC 112-2313-B-020-016; NSTC 113-2410-H-141-030-MY2)
Declaration of Conflicting Interests
The author(s) declared no potential conflicts of interest with respect to the research, authorship, and/or publication of this article.
Data Availability Statement
Data are available from two databases: the rice yield database, managed by the Taiwan Agricultural Data Open Platform, and the climate database, collected by the Central Weather Administration in Taiwan.
Supplemental Material
Supplemental material for this article is available online.
References
Supplementary Material
Please find the following supplemental material available below.
For Open Access articles published under a Creative Commons License, all supplemental material carries the same license as the article it is associated with.
For non-Open Access articles published, all supplemental material carries a non-exclusive license, and permission requests for re-use of supplemental material or any part of supplemental material shall be sent directly to the copyright owner as specified in the copyright notice associated with the article.