
Abstract
This study examines the impact of the US-China trade war on Chinese exports. Using the monthly export data from January 2017 to October 2022 with a Difference-in-Differences (DID) model, our findings show: First, before the trade war, export trends in China and the control group (the EU, South Korea, Japan, ASEAN, and India) were similar. Second, the trade war dramatically reduced China’s exports to the US, with tariff rises cited as the principal cause. Third, the robustness of our finding was established using a placebo test with 500 random samples. Our policy recommendations include leveraging multilateral negotiation mechanisms, accelerating industrial upgrading, and optimizing trade strategies to address the root causes of trade frictions effectively.
Plain language summary
This study systematically evaluates the impact of the US-China trade war on China’s exports to the US using a difference-in-difference (DID) model. Using China’s export to the US as the experimental group and China’s export to the EU, South Korea, Japan, ASEAN, and India as the control group with monthly data from January 2017 to October 2022, our results show that: First, there is a parallel effect where the export volumes of each country move in the same direction before February 2020. Second, the US-China trade war had a negative impact on the volume of China’s exports to the US. The increased tariffs led China’s exports to fall to the lowest point. The results were robust through parallel effect and placebo tests. This investigation highlights the causal relationship between trade dynamics and the observed contraction in exports, attributing a substantial portion of this decline to the trade disputes between these prominent global economies. For policymakers, in the face of trade friction, blind retaliation will further deteriorate the trade, and a multilateral consultative mechanism should be used to solve problems. Adjusting industrial structure and foreign trade strategy are important ways to resolve trade friction at the source.
Introduction
Since the establishment of diplomatic relations between China and the US in 1979, both countries have taken advantage of the opportunity of trade (Ross, 1986). Their trade exchanges slowly transform into a global supply chain, encouraging comparative advantages, vigorously promoting bilateral economic and trade cooperation, and progressively establishing a multi-level and diverse trading relationship. According to statistics released by China’s Ministry of Commerce, at the end of 2015, China became the largest trading partner of the US, and the US is now China’s second-largest trading partner (Morrison, 2019).
In 2018, two-way direct investment between China and the US accumulated nearly $160 billion, and trade in goods grew from $2.5 billion in 1979 to $633.52 billion, an increase of 25.2 times, with total exports of Total exports were $478.42 billion, up 11.3% year-on-year, while total imports were $155.1 billion, up 0.7% year-on-year. In the process of deepening and broadening bilateral trade relations, the US-China relationship has not only brought tangible benefits to the people of both countries. It has also contributed greatly to the prosperity and stability of the world economy (T. Liu & Woo, 2018).
The trade balance between China and the US has increasingly skewed to one side annually as the two nations’ commercial ties deepen. For the second consecutive year since data became available in 2006, China’s trade surplus with the US reached a new high of $323.32 billion in 2018, up 17.2% year-on-year. However, with the imposition of trade restrictions on Chinese investment and M&A by US President Trump on March 23, 2018, the situation took a turn as the imposed tariffs on $60 billion worth of Chinese imports were a blow to the free trade between the two countries (Kwan, 2020).
In response to the US government’s unilateral sanctions, China took drastic measures to safeguard the interests of the nation and its citizens. To help stabilize bilateral economic and trade relations, China has held several rounds of economic and trade consultations with the US. China has also consistently insisted on settling disputes through dialog and consultation (Hongzhou, 2020).
Figure 1 shows the rapid decline in China’s trade surplus since Trump escalated his tariffs and rhetoric and reached the lowest point in February 2020. During the Trump administration, US-China trade relations have entered a tense phase, with the two sides imposing tariffs on each other, triggering a series of trade wars. These measures have had a considerable impact on China’s exports to the US, leading to a gradual narrowing of China’s trade surplus (Bown, 2021).
China’s trade balance with the US.
For 6 months in a row, China’s exports to the US decreased 2.6% annually between January and June 2019. China also reacted to the US tax increase sanctions, which caused US exports to China to decline steadily between January and June 2019, dropping 25.7% annually (Bown, 2022). The expansion of two-way investment between the US and China has also significantly slowed down due to uncertainties brought on by trade and economic tensions between the two nations.
According to the Chinese Ministry of Commerce, China’s direct investment in the US in 2018 was $5.79 billion, down 10% year-on-year; actual US investment in China was $3.45 billion. From January to April 2019, actual US investment in China amounted to $1.23 billion, up 24.3% year-on-year, and total Chinese direct investment in the US was $1.96 billion, down 20% year-on-year (M. Li et al., 2020).
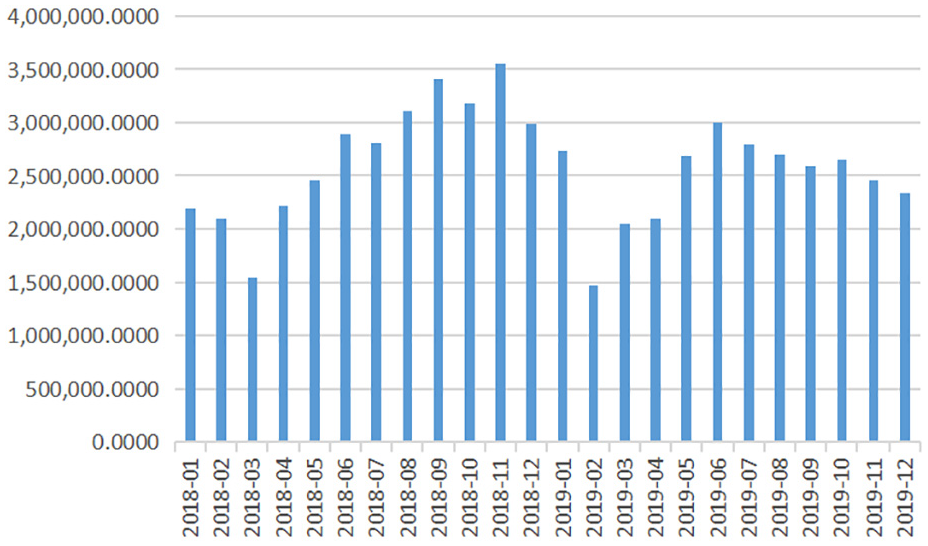
Figure 2 shows that in February 2020, China’s exports to the US reached their lowest point after declining rapidly for several months, excluding seasonal factors in exports.

China’s export trade volume to the US.
This study adds to previous research on the US-China trade conflict by examining this topic using a novel Difference-in-Differences (DID) method. This study highlights the significance of trade disputes, demonstrates the causal link between trade dynamics and the observed decline in exports, and attributes a sizable portion of this decline to trade disputes between the US and China.
Our results of the parallel trend test, which used China’s exports to the US as the experimental group and China’s exports to the EU, South Korea, Japan, ASEAN, and India as the control group, demonstrate that the experimental and control groups maintained the same trend before the policy’s implementation and that the experimental group experienced a significant negative impact from trade frictions following the policy’s implementation.
The remainder of the paper is structured as follows: Section 2 discusses relevant studies, while Section 3 explains the empirical method used. Section 4 discusses the result based on methodology. Conclusion and recommendations are presented in the last section.
Literature Review
International Trade and Economic Growth
Krugman (1979) proposed that international trade can enhance productivity through economies of scale and competitive pressure. Grossman and Helpman (1991) further argued that trade can promote technological diffusion and innovation, thereby improving productivity. Coe and Helpman (1995) found that trade can facilitate technology transfer and increase total factor productivity (TFP) through the importation of advanced technologies and capital equipment.
In East Asia, empirical studies by J. I. Kim and Lau (1994) found that economic growth in East Asian countries mainly relied on factor accumulation, with technological progress contributing less to productivity. Young (1995) supported this view, asserting that the East Asian economic miracle depended more on the accumulation of capital and labor rather than technological advancements.
Musa Ahmed (2012) examined the impact of trade spillovers on productivity growth in five ASEAN countries (Indonesia, Malaysia, the Philippines, Singapore, and Thailand) as well as China, Japan, and South Korea. The study found that during the study period, exports and imports contributed minimally to TFP growth in these countries. High investments in physical capital led to significant GDP contributions, whereas TFP contributions were low, with technological progress being notable only in Japan and South Korea.
With an emphasis on labor, physical capital, human capital, absorptive capacity, telecommunications investment, and exports, Kia Lashaki and Ahmed (2017) examined the effects of FDI inflows on sustainable productivity growth in the Asia-Pacific region between 1970 and 2012. The study discovered that factor inputs, not TFP growth, were the main driver of growth. FDI inflows supported telecommunications investment, export growth, and human capital development, all of which contributed to the study period’s notable GDP growth. Nonetheless, export channels had a negligible overall effect on TFP growth.
The US-China trade war has grown in importance as the global economic landscape has changed. In addition to the two countries’ respective trade volumes, the trade war has significantly impacted global supply chains, market expectations, and international trade patterns. Research indicates that the trade war has led to increased tariffs, raising trade costs and thereby suppressing trade flows between the two countries. The increase in tariff barriers has resulted in higher production costs and uncertainty for businesses, leading to a decline in trade volumes.
Bagwell and Staiger (2011) pointed out that a trade war could lead to welfare losses for both parties. Although it may protect certain industries’ employment in the short term, it will suppress economic efficiency and productivity in the long term. P. D. Fajgelbaum et al. (2020) showed that the tariff policies during the US-China trade war not only reduced bilateral trade volumes but also weakened global economic growth by affecting global supply chains and market confidence.
Overall, although the growth of East Asian economies in the past relied more on factor inputs in the current global economic environment, particularly in the context of the US-China trade war, changes in trade policies have become increasingly significant in affecting trade volumes and economic growth. Future research should focus more on the long-term impacts of trade wars on productivity and economic structures.
Trade Friction Between China and the US
Since the onset of the global financial crisis in 2008, numerous countries, including the US, have encountered significant economic challenges (Acharya & Schnabl, 2010). In response to these challenges, the US, the European Union, and several other economies have implemented internal trade protectionist measures to mitigate the crisis’s impacts. This shift toward protectionism has increased trade frictions and disputes on the global stage (Hsieh, 2009). China and the US, both major trading partners with substantial economic influence, have found themselves entangled in this evolving landscape of trade protectionism, with China emerging as one of the primary nations affected by the US’ adoption of protectionist trade policies.
Due to its complexity and diversity, the US-China trade relationship is especially vulnerable to changes in the dynamics of global trade (Tam, 2020). The trade tensions and protectionist measures undertaken by both countries have had far-reaching implications not only for their bilateral economic ties but also for the global trade environment. These developments underscore the importance of diplomacy, negotiations, and international cooperation in addressing trade-related challenges and promoting a more stable and predictable global trade landscape. The following are several main reasons for trade friction between the US and China:
The Substantial Trade Surplus Between China and the US
The significant trade surplus between China and the US is a prominent feature of their bilateral trade relationship. This trade imbalance has not only been persistent but has also been deepening over time. As trade between the two nations has progressed, the trade gap has continued to widen, and the disparities in trade have become increasingly conspicuous. China consistently maintains a substantial and enduring trade surplus with the US (M. H. Kim, 2014). This imbalance has become a persistent characteristic of their trade dynamics. During the tenure of the Trump administration, a primary policy objective was to narrow this trade deficit, with China being the principal target.
Given China’s status as a major contributor to the US trade deficit, it has been particularly susceptible to trade disputes initiated by the Trump administration. Consequently, China has been compelled to proactively implement measures to address and manage these trade challenges (Sharma et al., 2020).
Macroeconomic Imbalances Within China and the US
The economic systems of China and the US are distinct, leading to different paths of economic growth. The US primarily propels its economic growth through domestic consumption, prompting the US government to employ various strategies to foster continuous growth in domestic consumption. These strategies have led to the perception of over-consumption in the US. Due to high levels of consumption and inadequate domestic savings, the US frequently experiences trade deficits, necessitating imports to alleviate this imbalance. Domestic savings in the US primarily originate from two sectors: the private and public sectors (Kojima, 2000; Morrison, 2013). However, the private sector typically maintains a relatively low savings rate over the long term.
In 2017, the private sector savings rate in the US reached another historic low at three percentage points. Paradoxically, this period coincided with a surplus in domestic consumption, resulting in a significant deficit in the private sector balance. A similar situation existed in the public sector. The prolonged imbalance between investment and consumption has contributed to a substantial trade deficit in the US (Holinski et al., 2012). In response to this issue, President Trump implemented a series of measures to mitigate the deficit. However, these actions also exacerbated the fiscal situation, making it evident that the emergence of the US trade deficit is an inevitable consequence of the imbalance between domestic investment and savings.
In contrast to the US, Chinese consumers tend to exhibit more conservative spending habits. Additionally, China has long pursued policies that prioritize suppressing consumption while promoting increased investment, which has restrained domestic consumption to some extent (Gilboy, 2004). Consequently, China faces a situation of under-consumption and excessive savings. Furthermore, China’s economic development heavily relies on investment and external demand, driving an increase in Chinese product exports and limited demand for imported products. These policies, in turn, exacerbate the issue of trade surplus (Cai et al., 2010).
The US Direct Investment in China and the Imposition of Export Control
As the US service industry is developing better and better at home, its manufacturing industry has gradually begun to decline, and many US companies have begun to transfer their production abroad to gain more profits. China’s labor force has always had a very obvious advantage, so China has always been the main transfer of these companies. In the bilateral trade between China and the US, many of the exports to the US are realized in Chinese multinational corporations, which makes the value of China’s imports and the value of the US exports move in opposite directions.
Moreover, due to the export controls imposed by the US, there is a clear trade Imbalance. As China and the US are at different stages of development, there is a gap between the two countries’ current economic development, which makes the trade products of the two countries complementary. In addition to the differences in the domestic situation, the two countries have differences in resources (Wong & Zhou, 2011). China is one of the most populous countries in the world and, therefore, has an abundant labor force, unlike the US, which is a developed country with a highly developed technological dimension that has reached a mature stage.
According to the principle of comparative advantage, in the process of conducting bilateral trade, China and the US should each take what it needs. China exports labor-intensive products to the US, while the US exports technology-intensive products (Mayer et al., 2003). Only by complementing each other’s strengths can the economies of the two countries develop smoothly. On the contrary, due to the imbalance in demand for products between the US and China and the restriction on the export of US high-tech products, the trade gap between the two countries has grown bigger over time.
The Impact of the US-China Trade War on Trade
The US-China trade war, initiated by the US in 2018, marked a significant shift from its historic role in promoting global market integration. By the end of 2019, the US had imposed tariffs on approximately $350 billion of Chinese imports, with China retaliating with tariffs on $100 billion of US exports. This trade conflict led to higher prices for US consumers of imported goods and a decrease in overall real incomes in both the US and China, though the impact on real incomes was relatively minor (P. D. Fajgelbaum et al., 2020; P. D. Fajgelbaum & Khandelwal, 2022).
Several studies have examined the effects of these tariffs, showing that the tariffs imposed by the US were almost entirely passed on to domestic prices, causing domestic consumers and importers to bear the majority of the costs. The cumulative deadweight welfare cost due to US tariffs in 2018 was estimated at approximately $8.2 billion, with additional tariff revenue paid to the government by domestic consumers and importers amounting to about $14 billion. Potential conservative cost estimates were noted due to factors such as a reduction in consumer variety and the fixed costs for firms reorganizing their global supply chains (Amiti et al., 2019, 2020).
In addition, P. D. Fajgelbaum et al. (2020) further analyzed the trade war’s impact on the US economy, finding significant effects on imports and exports, including increased import prices. Through general equilibrium modeling, they concluded that the overall US real income loss was relatively small and indicated a redistribution from foreign buyers to US producers and the government. Interestingly, the trade war created net export opportunities for “bystander” countries, prompting an increase in their exports (P. Fajgelbaum et al., 2021).
Over the past two decades, China’s rapid economic growth and substantial trade surplus with the US made it the primary target of US trade policies. The imposition of tariffs triggered a series of escalating tensions between the two countries, disrupting global economic integration and creating significant risks for US-China relations (Kapustina et al., 2020; Steinbock, 2018).
Four primary US goals were identified by Kapustina et al. (2020 after reviewing the history and examining the causes and possible outcomes of the US-China trade war. These goals were to: (a) reduce the bilateral trade deficit and boost employment opportunities; (b) restrict Chinese access to American technology and stop Chinese industry from becoming digitally modernized; (c) stop the expansion of Chinese military power; and (d) reduce the federal budget deficit.
According to Goulard (2020), a trade war between these two economic titans would probably lead to a global slowdown in production and international trade, and their study concludes that there are no winners in a trade war. Tu et al. (2020) used the lists of Chinese goods that were subject to additional tariffs during the 2018 US Section 301 investigation, as well as China’s countermeasures, to simulate the effects of trade creation/reduction, welfare, and trade diversion. According to their simulations, both Chinese and US imports from China have significantly decreased. Chinese imports are now going to countries like Brazil, Germany, Japan, Argentina, the United Kingdom, and Canada, while US imports are moving to markets like Mexico, Japan, and Germany. However, alternative suppliers could not completely replace US-China trade without resulting in additional expenses or utility losses, which would have significantly reduced both countries’ overall imports and welfare.
DID Analysis Method
Slaughter (2001) examines the effects of trade liberalization on income convergence across countries using a “Difference-in-Differences” (DID) approach. He finds that trade liberalization positively impacts the income of liberalized countries. Similarly, Behrens et al. (2013) utilize DID to study the trade collapse in Belgium during 2008–2009, attributing the decline mainly to decreased sales and unit prices rather than a reduction in firms or trading partners. Their findings suggest that a decline in demand for traded goods was the primary driver of the trade collapse.
Baker et al. (2016) also use DID to assess the impact of Free Trade Agreements (FTAs) on FDI inflows and production diversification in Peru, They find significant increases in FDI inflows and soft drink production, along with diversification of products in Peru, changes not observed in Bolivia. Their study echoes Slaughter’s (2001) findings on the positive economic impacts of trade policies, illustrating the broader applicability of DID in assessing trade policy outcomes.
Zhang et al. (2020) and Yang et al. (2020) use DID in environmental economics to examine how carbon emissions trading schemes (ETS) affect China’s economic and environmental results. According to the study, the adoption of ETS enhanced the average DEA efficiency across carbon trading mechanisms and raised the economic dividend from industrial output. The CO2 emissions trading scheme decreased CO2 emissions and energy consumption in regulated industries in pilot areas by 15.5% and 22.8%, respectively, in comparison to non-pilot areas.
Collectively, these studies underscore the versatility of the DID approach in evaluating diverse economic policies across various contexts. Whether examining trade liberalization, FTAs, or ETS, the DID methodology consistently reveals significant and measurable impacts on economic and environmental outcomes, reinforcing the importance of policy design and implementation in achieving desired objectives.
Research Gap
Previous studies have already conducted studies related to the US-China trade war through the DID model. For example, the changes in US-China trade policies between 2017 and 2018 harmed US county-level consumption and employment (Waugh, 2019). A partial equilibrium model reveals that the US-China trade war harms both economies, with the US experiencing greater losses, while trade liberalization benefits both, particularly China, in consumer, industrial, and agricultural goods, and the US in consumer and industrial goods (Archana, 2020). However, there are some shortcomings in the existing research, which only focuses on auto sales or some product categories and does not explore overall exports that are directly affected by the trade war. Future research should investigate a more macro picture of trade to gain a more comprehensive understanding of the impact of trade policy.
Existing research, exemplified by studies such as those employing global general equilibrium models to simulate US-China trade wars, offers valuable insights into the economic impacts and strategic dynamics between these two major economies (C. Li et al., 2018). In addition to focusing on the US and China in the trade war, the trade and economic development of other countries and regions will also be profoundly affected by the trade war. According to a study using the EAGLE model, US tariffs on Chinese imports reduce US exports and global output, with a further contraction when China retaliates (Bolt et al., 2019).
Jiao et al. (2022) investigate the effects of the 2018 US tariff surges on Chinese exporters, specifically focusing on export prices and sales adjustments across different markets. It finds that US tariffs did not impact the free-on-board prices of Chinese exports, though exports to the US dropped significantly. Exports to the EU increased moderately, while domestic sales and exports to other markets remained largely unaffected. Using the SMART Model, Tu et al. (2020) demonstrate how the US-China tariff war significantly lowers bilateral trade, redirects trade to other nations, and results in significant welfare losses, particularly for Chinese soybeans and autos and US machinery and electrical products. For US companies that depended on Chinese trade, the US-China trade war decreased market values; the effects were more pronounced for companies that had low R&D intensity or that used unique Chinese inputs (Huang et al., 2023).
Previous studies have examined various aspects of US-China trade relations, highlighting significant impacts on consumption, export prices, and overall economic dynamics. However, these studies often focused narrowly on specific sectors, regions, or short-term effects, leaving several critical gaps unaddressed. Our study addresses these gaps by systematically evaluating the comprehensive impact of the US-China trade war on China’s export trade to the US. Using a robust Difference-in-Differences model and leveraging extensive monthly export data from January 2017 to October 2022 across major global markets, including the US, EU, South Korea, Japan, ASEAN, and India, our research provides a holistic view of the trade dynamics.
Where previous studies examined isolated effects, such as consumption declines or localized price adjustments, our research offers a broader perspective. We analyze the overall export volumes to the US, compared against exports to other key markets, providing insights into how trade policies affect China’s global export strategy over both the short and long term. Specifically, our findings demonstrate a pronounced negative impact of increased tariffs resulting from US-China trade tensions on China’s exports to the US, driving them to their lowest levels. This contrasts with moderate increases in exports to other regions, underscoring the differential effects of trade policies across markets. Furthermore, our study enhances understanding by conducting rigorous parallel effects and placebo tests, ensuring the robustness of our conclusions. By shedding light on these previously unexplored dimensions, our research contributes essential insights for policymakers and stakeholders navigating global trade dynamics.
Data and Methodology
Data
The data used are exports between China and the US, EU, South Korea, Japan, ASEAN, and India. The sample period from January 2017 to October 2022 is used (Table 1).
List of Variables.

Source. Wind database.
Figure 3 shows that China’s exports to the US, the EU, and ASEAN are large, and exports to Korea, Japan, and India are relatively small. The change in China’s export volume to Japan, Korea, and India is less volatile, and the change in export volume to the US, EU, and ASEAN is more volatile. In February 2020, there was a significant drop in Chinese exports to various countries, which this paper infers is the result of seasonal variations combined with the impact of the US-China trade war.

China’s export trade six largest trading partners.
Model
The implementation of regional policies will have an impact on the economic activities in the policy implementation region and may or may not have an impact on the no-policy implementation region, depending on the closeness of economic ties between regions. The quantitative assessment of the effects of public policy or program implementation in recent years usually adopts the Difference-in-Differences (DID) method, which can largely avoid the endogeneity problem, and the policies are generally exogenous concerning microeconomic agents. Thus, there is no reverse causality problem.
Chinese exports to the US are selected as the experimental group, and Chinese exports to the European Union, South Korea, Japan, ASEAN, and India are selected as the control group to construct the DID model. According to the basic setup steps of the DID model, two dummy variables need to be constructed:
First, the grouping dummy variables (treat) is used. China’s export trade to the US as the experimental group, defined as 1; China’s five countries and regions, including the EU, Korea, Japan, ASEAN, and India, as the control group, defined as 0;
Second, the policy implementation dummy variable (period) is used. In September 2019, the US imposed tariffs on more than $125 billion worth of Chinese goods, which is used as the policy event for this paper to study. Considering that there is a time lag between the policy announcement and the actual effect of the policy, such as policy implementation and enterprise production cycle, and the choice of policy timing needs to pass the parallel effect test, this paper takes the policy time lag of 5 periods, that is, February 2020, as the time point to study the policy effect. Therefore, February 2020 and later are chosen to be defined as 1, and the time before is defined as 0.
The basic model of this paper is set as follows:

The US-China trade war has had a definite impact on China’s exports. The US tariff measures have led to higher prices for Chinese exports to the US, thereby reducing the volume of Chinese exports to the US. In addition, the uncertainty of the US-China trade war on the global trade environment has also harmed China’s exports. This study draws up the following hypothesis:
The DID model estimates the impact of the US-China trade war on Chinese exports by analyzing the differences between the treatment and control groups that have been exposed to the dispute. The treatment group consists of Chinese exports to the US that were directly affected by the US-China trade war, whereas the control group consists of Chinese exports to other countries that were not directly affected.
Based on the hypothesis, this study will run DID model analysis and robustness tests to see the result. This approach allows an accurate estimate of the impact of the US-China trade war on Chinese exports and excludes the effects of other factors.
The establishment of our model fills the gap in previous research and makes the following contributions: Introducing the Difference-in-Differences (DID) method as the primary approach to assess the impact of the US-China trade war on Chinese exports. Compared to traditional simple difference methods, DID effectively controls endogeneity issues, particularly suitable when complex causal relationships exist between policy implementation and economic activities. This study provides a new perspective and methodological support for scientifically evaluating the effects of international trade policies.
This study conducts an empirical analysis of the impact of the US-China trade war on Chinese export volumes, thereby addressing research gaps regarding the mechanisms through which such international trade conflicts affect exporting economies. Specifically, the study enriches existing theoretical frameworks by examining issues such as the selection of appropriate periods and control groups before and after policy implementation and explaining variations in impacts due to different economic ties between regions. These contributions enhance the scientific rigor and practical utility of assessing economic impacts post-policy implementation.
Result
The parallel trend assumption stands as a fundamental requirement when employing the Difference-in-Differences (DID) method within empirical research. In the context of an empirical study, the target variables of both the treatment and control groups must adhere to the parallel trend assumption, specifically before the policy intervention takes place. Suppose there are some significant differences between these groups before the implementation of the policy. In that case, the outcomes derived through the DID approach may lose their validity as an accurate representation of the net effect of the policy. In such cases, the observed positive outcomes could be misleading, as various other factors could contribute to changes in our explanatory variables, thus confounding the true impact of the policy under investigation.
Nevertheless, the variation in seasonal factors was applied to all countries and regions, including the experimental and control groups. Conversely, the policy shifts resulting from the US-China trade tensions solely pertain to the experimental group, specifically China’s exports to the US. Suppose the results can pass the parallel effects test. In that case, it can be very effective to separate the net policy effect brought by the US-China trade war from the trend of seasonal changes.
There Are the Following Explanations for the Seasonal Changes in Exports
First, the factor of the Spring Festival. The Spring Festival usually starts from the end of January to mid-February. Most enterprises will increase their exports before the Spring Festival. Therefore, in the first few months before the Spring Festival (November, December, and January), the export volume will be relatively large, and the relative export volume in February will decline by a large margin.
Second, Christmas is also one of the factors. Western countries attach greater importance to Christmas than the domestic Spring Festival. Therefore, every December (Christmas is December 25) is also the largest consumption period in Western countries, of which Chinese exports occupy a large proportion of the products. Chinese exporters also have to complete the export of goods before Christmas each year. After December, the export volume will decline.
Third, East and Southeast Asian countries celebrate the Lunar New Year. Most countries in East Asia (Japan and South Korea) and Southeast Asia (Singapore, Vietnam, and Myanmar) celebrate the Lunar New Year. Hence, they will buy a large amount of goods before February, and Chinese exports will also finish exporting before February. This festive season has contributed to higher export volume in November, December, and January, and the export volume will fall back significantly in February.
Fourth, most companies start their holidays before the Chinese New Year and start working again after the holidays, which will also lead to a drop in export volume in February.
There are the following explanations for the impact of the US-China trade war on exports:
On August 23, 2018, the US imposed a 25% tariff on $16 billion worth of Chinese goods; on September 24, 2018, the US imposed a 10% tariff on $200 billion worth of Chinese imports. As can be seen from Figure 1, after the US trade sanctions against China, China’s export data to the US decreased in September and October and increased again in November, but from December to February 2019, China’s export data to the US lower, which shows that this US sanctions on China’s exports have a greater impact.
On May 10, 2019, the US raised tariffs on $200 billion worth of Chinese goods from 10% to 25% after trade talks broke down. China then hit back at the US trade sanctions by imposing tariffs on $60 billion worth of US products at 25%, 20%, and 10% on June 1, 2019, and on August 23, 2019, China announced the imposition of 5% and 10% tariffs on $75 billion of US products. As can be seen from Figure 1, China’s export trade data to the US showed a declining trend between May and August 2019.
On September 1, 2019, the US began imposing tariffs on more than $125 billion worth of Chinese goods to counter China’s trade sanctions. From the above graph, it can be seen that after September 2019, China’s trade export data to the US showed a downward trend and dropped significantly to the trough of the data in February 2020. The data in the third quarter of 2019 (September–December) did not show an increase in export trade volume as in previous years but showed a continuous decline, from which it can be presumed that the frequent trade conflicts between China and the US between June and September had a significant dampening effect on China’s exports of US goods and were the most influential trade conflicts between China and the US since 2018.
Result of DID Model
This part assesses the impact of the US-China trade war on China’s exports by constructing a Difference-in-Differences (DID) model, as shown in Equation 1. The estimation results are shown in the table above. The explanatory variable in the table is trade, and the explanatory variable is did, which is the product of policy implementation and your variable (treat) and the grouped dummy variable (period).
From Table 2, it can be seen that the US-China trade war sanctions on Chinese exports significantly inhibit the growth of China’s trade with the US with a p-value of .09, and the regression coefficient passes the test at the 10% level of significance. Therefore, it can confirm the conjecture that the imposition of tariffs on Chinese exports by the US will significantly inhibit the growth of Chinese exports.
Result of the DID Model.
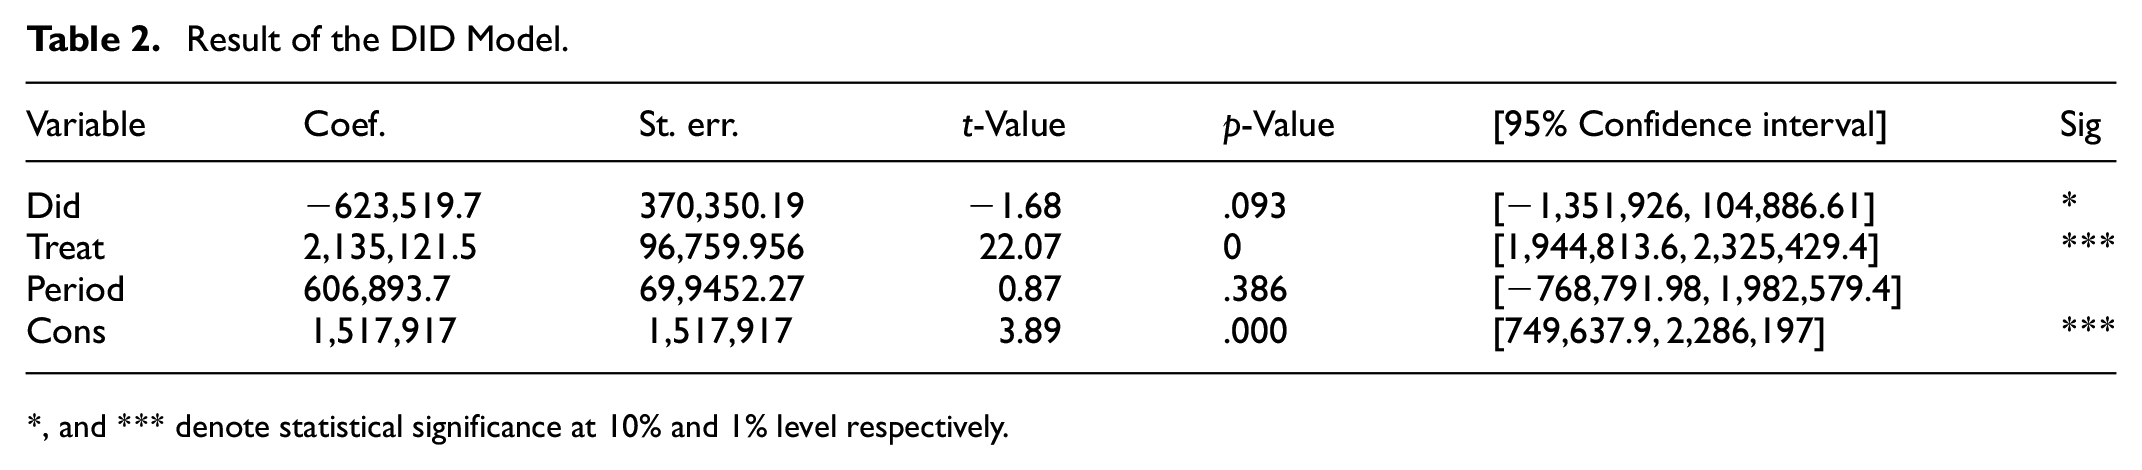
*, and *** denote statistical significance at 10% and 1% level respectively.
By imposing high tariffs on Chinese exports, the US directly raises the production costs of domestic foreign trade enterprises and thus loses its cost advantage in international competition. Since most of China’s exports are concentrated in the food, toy, garment, and electronic product OEM industries, the cost advantage of products is the main source of competition for China’s exports, and the tariff increase is a huge blow to China’s product exports. In addition, as the US is the largest trading country of China’s product exports (Morrison, 2019), accounting for more than 20% of China’s total exports, the US-China trade war with US tariffs imposed on China will certainly seriously affect the healthy development of China’s economy.
Parallel Trend Test
According to the requirements of the DID model parallel trend test, the coefficient of the product of the group dummy variable (treat) and the time-fixed effect should be insignificant before the occurrence of the policy (several consecutive periods are sufficient, and not all times are required); the coefficient of the product of the group dummy variable (treat) and the time fixed effect should meet the significance requirements and the coefficient changes as expected after the occurrence of the policy (several consecutive periods are sufficient, and not all times are required), which means that the experimental and control group data have a parallel trend and satisfy the parallel trend test.
As shown in Table 3, this study chooses January 2020 (Pre_1) as the baseline group for the Parallel trend test. In dynamic effect tests, use a base year or base control group to avoid multicollinearity problems. The reasons include:
Period Description.

Multicollinearity problem: When variables from all periods are included in the analysis (such as annual dummy variables or time trends), these variables may be highly correlated, resulting in multicollinearity. This situation will make the model estimation results unstable and the standard error increase, thus affecting the accurate assessment of the effect.
Avoiding the dummy variable trap: In a regression model, when dummy variables are used to represent different periods, if all periods are included, it will lead to the linear dependence of the dummy variables. For example, suppose dummy variables for all years are included. In that case, the sum of these variables is always equal to 1, which raises the problem of multicollinearity. In this case, the model cannot distinguish the independent effects between these variables.
The coefficient of the interaction term is significantly negative after the policy is implemented, but it quickly returns to near 0, indicating that the policy has a significant negative effect 2 months after its introduction but then disappears. The hypothesis of a parallel trend is satisfied because Figure 4 demonstrates that the coefficient of the interaction term is not significantly different from 0 before the policy (the 95% confidence interval contains a value of 0). This result suggests that there is no significant difference between the treatment and control groups before the policy point in time.

Parallel trend test.
Placebo Test
The placebo test in Table 4 was selected by random sampling from all samples, with a sampling number of 500 times. Suppose the random sampling regression results do not allow for illustrative significance. In that case, the DID regression results are proven to be explanatory. That is, they pass the placebo test.
Result of Placebo Test.
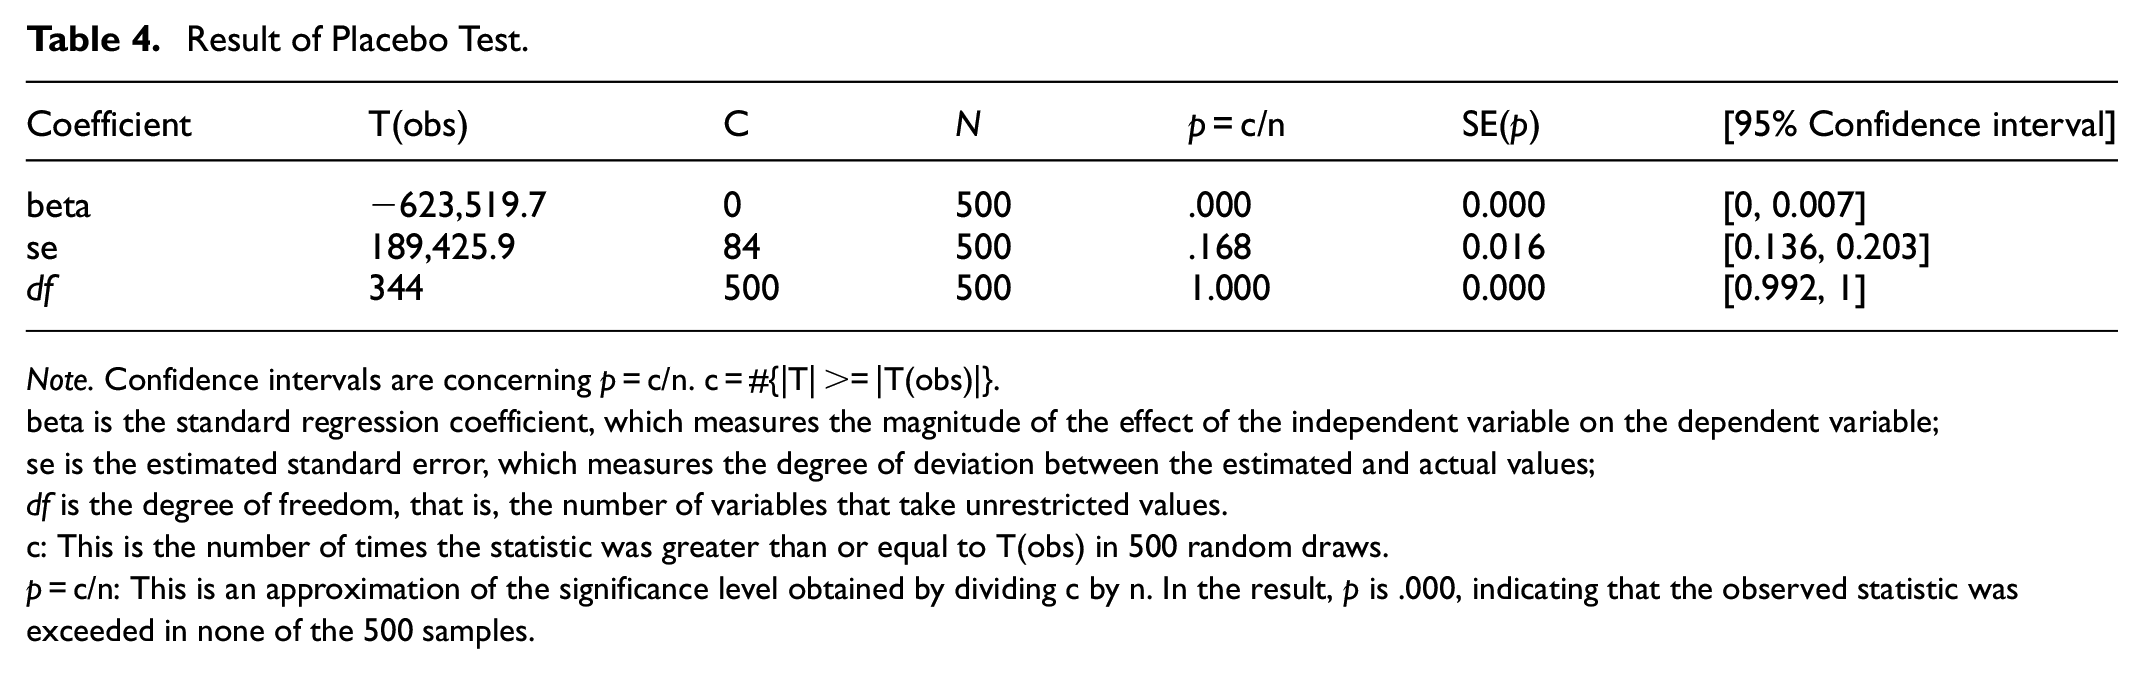
Note. Confidence intervals are concerning p = c/n. c = #{|T| >= |T(obs)|}.
beta is the standard regression coefficient, which measures the magnitude of the effect of the independent variable on the dependent variable;
se is the estimated standard error, which measures the degree of deviation between the estimated and actual values;
df is the degree of freedom, that is, the number of variables that take unrestricted values.
c: This is the number of times the statistic was greater than or equal to T(obs) in 500 random draws.
p = c/n: This is an approximation of the significance level obtained by dividing c by n. In the result, p is .000, indicating that the observed statistic was exceeded in none of the 500 samples.
The p-values of beta, se, and df are close to 0, which means that the new data set constructed under random sampling does not reproduce the regression results of the original data. This finding indicates that random sampling cannot reproduce the policy partitioning effect, which confirms that DID is valid.
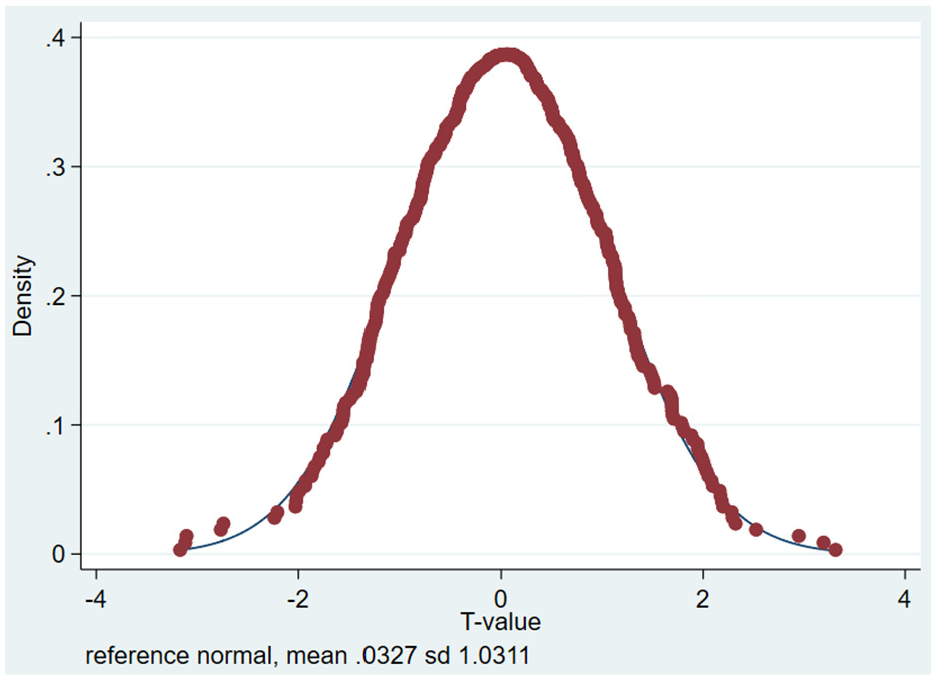
From Figure 5, the distribution of the coefficient estimates fitted a normal distribution, and at the highest probability, the coefficient estimates were 0. That is, under the condition that 500 random samples were conducted, the maximum probability of the outcome of the coefficient estimates was 0, that is, the explanatory variables had no effect on the explanatory variables. This figure indicates that random sampling is not illustrative and proves to pass the placebo test.

Parallel trend test of estimator.
From Figure 6, the T-values have a value of 0 at the highest probability density, which means that the maximum probability of the outcome of the T-value is 0 under the condition of 500 random samples. That is, the T-test does not pass. It means that the regression results of random sampling are not significant, thus indicating that random sampling is not illustrative and proves to pass the placebo test.
Parallel trend test of T-value.
From Figure 7, the distribution of p-values with probability densities up to near .5 indicates that the regression results of the coefficients of random sampling did not pass the significance test (p-values less than .1 and greater than .05 pass the 10% significance test; p-values less than .05 and greater than .01 pass the 5% significance test; p-values less than .01 and greater than 0 pass the 1% significance test), which means that the 500 random sampling conditions, the regression coefficients did not pass the significance test, thus proving that the DID model regression based on the original data regression is valid.

Parallel trend test of p-value.
In Figure 8, the dots are the p-values, and the lines are the estimated values. The left vertical axis measures the p-value, and the right vertical axis measures the estimate, indicating that the p-value distribution is consistent with the estimate distribution. It can be seen that the highest probability densities of p-values and estimates are around 0, indicating that the estimates of the random sample are not indicative of significance, indicating that they pass the placebo test.

Parallel trend test of p-value and K-density beta.
Conclusion
Major Findings
Using a Difference-in-Differences (DID) model, this study emphasizes the pivotal influence of trade conflicts between China and the US in instigating the remarkable decline in China’s exports to the US, reaching its lowest point in February 2020. This study demonstrates the causal connection between trade dynamics and the observed export contraction, attributing a significant amount of this decline to the trade disputes between these influential international economies.
The results of the parallel trend test show that the experimental and control groups maintained the same trend before the implementation of the policy, and there was a significant negative effect in the experimental group after the implementation of the policy related to trade frictions. The core idea of the placebo test is that the fictitious treatment group or fictitious policy time is estimated, and if the regression results of the estimated quantities under different fictitious approaches remain significant (H. Liu et al., 2022), then it indicates that the original estimation results are likely biased. Under the condition of conducting 500 random samples, the results of the placebo test showed that the results of the DID model could not be reproduced. So, the results of the DID model in this paper are robust.
Comparative analysis with previous studies reveals notable advancements. Traditional approaches often overlooked crucial endogeneity issues surrounding policy implementations, potentially biasing their findings (C. Li et al., 2018; Bolt et al., 2019; Jiao et al., 2022). In contrast, our study employs the Difference-in-Differences (DID) method, rigorously capturing and quantifying the actual impact of the US-China trade war on China’s exports. By meticulously comparing trends between affected and unaffected markets, our approach enhances the reliability and scientific validity of assessing trade policy effects.
Furthermore, our study extends beyond prior research by providing a comprehensive analysis of China’s exports across various major trading partners during the trade war period. While previous studies have focused only on specific product categories, such as car sales or certain product categories (Archana, 2020; Tu et al., 2020; Waugh, 2019 ), or only on micro-level firm value like Huang et al. (2023), our study provides a holistic perspective that enriches the understanding of broader trade dynamics affected by geopolitical tensions.
In addition to substantiating the adverse effects of US-China trade tensions on China’s exports, our application of the DID model sets a methodological benchmark for future studies evaluating similar trade policy impacts. By addressing previous methodological limitations and broadening the scope of analysis, our research contributes significantly to the literature and informs policymakers and stakeholders about the intricate dynamics of international trade relations.
Policy Recommendations
This study reveals the profound impact of trade conflicts between China and the US on China’s export performance, particularly highlighting the significant decline observed in exports to the US since February 2020. The findings establish a clear causal link between heightened trade tensions and the contraction in exports, attributing a substantial portion of this decline to the ongoing disputes between these global economic powers.
Based on these robust findings, several recommendations and policy implications emerge. Firstly, policymakers should prioritize diversification strategies to reduce reliance on any single export market. Diversification can mitigate risks associated with geopolitical tensions and enhance resilience against future trade disruptions. Additionally, enhancing monitoring capabilities to detect and respond to shifts in trade patterns swiftly is essential for proactive policymaking. This enables governments and businesses to anticipate changes in demand and adjust strategies accordingly, safeguarding against sudden market shocks.
Furthermore, investing in industry resilience and technological innovation is critical. Industries heavily reliant on exports to the US should focus on upgrading technology and improving efficiency to maintain competitiveness amidst uncertain international trade environments. Additionally, fostering multilateral trade agreements and strengthening diplomatic ties with alternative markets can provide avenues for diversifying export destinations. Collaborative efforts in multilateral forums also contribute to stabilizing global trade relations and promoting sustainable economic growth for all stakeholders involved.
In the face of trade frictions, retaliation tools should be used cautiously, and blind retaliatory measures may further deteriorate the domestic economy(Han, 2023). Therefore, when dealing with trade disputes, multilateral mechanisms should be reasonably used to resolve the problem properly. The WTO dispute settlement mechanism is an important way for countries around the world, especially developing countries, to deal with trade frictions between countries and defend their rights and interests. For example, Japan often deals with trade friction with the US through multilateral trade negotiations under the WTO dispute settlement mechanism (Urata, 2020).
Accelerating the upgrading of industrial structure and adjusting foreign trade strategy is an important way to solve trade friction from the source (Yan & Chunding, 2021). At present, China is in a new economic normal situation; the industrial structure is gradually optimized, but the export products are still mainly labor-intensive products. These industries have low added value, and most of them are the sunset industries of developed countries (Hanson, 2021).
As China’s labor resources and raw materials have a relative advantage, the long-term export of such products will impact the industries of developed countries and, at the same time, create a conflict of interest with other developing countries, which can easily cause trade friction problems. Therefore, whether from the perspective of their development or improving trade relations, adjusting the industrial structure and foreign trade strategy is an important way to solve the trade friction problem.
Limitation and Future Research
When analyzing the impact of the trade friction between China and the US on Chinese exports, we must take into account the effects of the Covid-19 pandemic. Since the outbreak of COVID-19 at the end of 2019, the global economy and trade activities have experienced unprecedented disruptions. Lockdowns and social distancing measures implemented by many countries have had significant impacts on global supply chains and trade flows. For China, Covid-19 has not only caused short-term disruptions to domestic production and logistics but also affected external demand. Economic uncertainty and declining consumer demand globally have posed challenges to China’s external exports. Particularly in early 2020, Chinese exports to the US and other major trading partners experienced significant fluctuations.
Although this study mainly focuses on the impact of the China-US trade friction, we acknowledge that COVID-19 serves as an important background factor with significant effects on trade data. To ensure the accuracy and robustness of our analysis, we conducted parallel trend tests, excluding other potential influencing factors, including Covid-19. The parallel trend tests indicate that before the outbreak of the pandemic, the export trends in each group of data were similar, which enhances the validity of our research design.
Future research can further explore the complex effects of the China-US trade friction and Covid-19 on Chinese exports. Researchers can delve into the performance and response strategies of various industries under the dual impact of trade friction and the pandemic by refining the analysis of different commodity categories and industries. In addition, long-term impact assessments and dynamic analyses can help reveal the long-term trends and structural changes in Chinese exports due to trade friction and the pandemic. Combining cross-national comparative studies and policy effect analyses can provide more targeted recommendations for the formulation of global trade policies. Through these in-depth studies, future scholars can gain a more comprehensive understanding of the mechanisms through which the China-US trade friction and COVID-19 affect Chinese exports, thereby providing more effective policy support for addressing future trade challenges.