
Abstract
The emoticon picture clarity in online service encounters has been overlooked in consumer research. Our study intends to investigate how emoticon picture clarity influences consumer service satisfaction. Across four experiments and a single-paper meta-analysis, we demonstrate that when service providers use clear rather blurred emoticon pictures to communicate with consumers, consumers will have higher service satisfaction (Study 1). This effect is attributed to the higher processing fluency induced by clear emoticon pictures, which in turn triggers greater satisfaction (Studies 2 and 3). Furthermore, this effect is weakened when consumers experience cognitive load (Study 4). These findings provide novel insights into consumers' biased evaluations of service providers and offer valuable guidance for marketers to enhance online shopping services through the strategic use of emoticon pictures.
Introduction
An emoticon is a picture used as a text character to convey emotions and add liveliness to online conversations by expressing humor and emotions (Hsieh & Tseng, 2017; Rodríguez-Hidalgo et al., 2017), which enhances communication effectiveness. Initially, emoticons were restricted to simple expressions like smiley faces or frowns (Ganster et al., 2012). However, the proliferation of emoticons has provided people with more ways to express themselves recently. These compact yet expressive images profoundly influence various aspects of consumers, including altering emotions (Kralj Novak et al., 2015), inducing empathy (Jeon, 2022a), fostering purchase intention (Das et al., 2019), and affecting advice-taking (Duan et al., 2018). As the use of emoticons is becoming an everyday occurrence, marketers are incorporating them into consumer interactions (Jeon, 2020). Besides traditional clear emoticon pictures, brands sometimes opt for blurred ones. For instance, the renowned brand, “MIXUE Ice Cream & Tea,” has successfully captured consumers’ attention with its blurred emoticons. Additionally, some blurred emoticons are popular and people enjoy using them to convey their emotions and reactions in their digital communications (see Figure 1). This raises a question: during interactions with consumers, should companies use clear or blurry emoticons to enhance consumer satisfaction?

Examples of clear and blurred emoticons.
Given the increasing prevalence of emoticons during marketing communications (Li et al., 2019a; Luangrath et al., 2017; Park & Sundar, 2015), the current study aims to explore the influence of emoticon clarity on consumer sentiment and consumer satisfaction. In our research, we define clarity as the sharpness and detail of the presentation, which determines how quickly consumers judge the reliability of information and ease of identification and comprehension (Ekman et al., 1982; Enns & MacDonald, 2013; Ester, 1990; Golden, 1990; Park et al., 2020). Service providers use emoticons of varying clarity during service encounters, which results in different experiences for consumers. However, there is little research on how emoticon picture clarity affects consumer behavior, so we referenced studies on image clarity in the advertising field. Advertisers believe that image clarity and blurriness can direct the viewer’s gaze (Enns & MacDonald, 2013), and clear advertisements allow viewers to better receive the message (De Pelsmacker et al., 2002). Most existing research focuses on image blurring and adapting blurred images (Held et al., 2010; Mather & Smith, 2002; Sawides et al., 2011), we are interested in how emoticon clarity affects consumer satisfaction.
Across four studies and a single-paper meta-analysis, we propose that service providers' use of clear (vs. blurred) emoticons enhances consumer satisfaction. Furthermore, processing fluency plays a mediating role, as consumers perceive higher processing fluency when they encounter clearer emoticons, which ultimately increases their satisfaction. Further, we argue that when consumers experience cognitive load, the positive impact of clear emoticons on processing fluency disappears, thus reducing service satisfaction.
Our study provides new insights into emoticon clarity, processing fluency, and consumer service satisfaction. First, this study examines consumer responses to emoticons of varying clarity, expanding the scope of research on emoticons in online service encounters (Jaeger et al., 2017; Li et al., 2019; Walther & D’Addario, 2001). Second, we drew on research on processing fluency (Lee & Labroo, 2004; Schwarz, 2004) to establish that clear emoticons enhance consumer service satisfaction, as the clarity of emoticons directly influences consumers’ processing fluency. Finally, given the widespread use of emoticons in marketing, our findings have important practical implications for all service providers engaged in consumer communication.
Literature Review
Processing Fluency Theory
Processing fluency theory is an important theory in cognitive psychology that explores how the ease of processing information influences individuals’ psychological experiences and behavioral decisions (Chattaraman et al., 2010; Labroo & Pocheptsova, 2016). It suggests that increased processing fluency can help make subjective experiences easier for the perceiver to process, which can influence the perceiver’s evaluative judgments (Chattaraman et al., 2009).
Processing fluency refers to the ease with which information is stored in memory (Schwarz, 2004) or the ease of processing external stimuli (Novemsky et al., 2007), which is a metacognitive experience (Alter & Oppenheimer, 2009) that accompanies human thought processes and judgments. It is influenced by various factors such as visual complexity (Sohn, 2017), contextual cues (Chattaraman et al., 2009), task complexity (Skehan & Foster, 1999), and so on. Furthermore, substantial empirical research has supported that processing fluency can result in positive responses, such as favorable consumer attitudes, evaluations, and behaviors. For instance, Reber et al. (2004) proposed that aesthetic pleasure is a function of how smoothly perceivers process dynamic stimuli, that is, the smoother the processing of an object by perceivers, the more positive their aesthetic response. Winkielman and Cacioppo (2001) discovered that fluency increases the enjoyment of stimuli by activating pleasure-related areas of the brain, which enhances positively correlated ratings. Okuhara et al. (2017) demonstrated that fluently processed materials that are easy to read and understand enhance perspicuity and persuasiveness, influencing willingness to undertake health behaviors.
Emoticon Picture Clarity and Processing Fluency
Emoticons have become a valuable social tool that has garnered the attention of marketers. For example, Burger King sent out a tweet that ended with three emoticons with big smiles on their faces, which would be thought much less effective if the emoticons were missing (Das et al., 2019). Moreover, prior research on emoticons has revealed their impact on consumer attitudes and behavior. For instance, Li et al. (2019) demonstrated that using emoticons in marketing communications affects consumers’ warm perceptions and competence perceptions toward service employees. Wall et al. (2016) found that the objective usage of “happy” emoticons positively impacts observers’ evaluations of targets’ agreeableness, conscientiousness, and openness. Additionally, Das et al. (2019) stated that incorporating emoticons in advertisements triggers higher purchase intentions.
In the current study, we focus on emoticon picture clarity, which refers to the sharpness and detail of the presentation, which determines how quickly consumers judge the reliability of information and ease of identification and comprehension (Ekman et al., 1982; Enns & MacDonald, 2013; Ester, 1990; Golden, 1990; Park et al., 2020). A picture with high visual clarity maintains good quality when enlarged or reduced, without becoming blurry or distorted. Given that processing fluency is associated with the ease with which people perceive and identify product features, like visual details, touch, sound, shape, or size (Lee & Labroo, 2004), we argue that clear emoticons are easier to process, leading to higher processing fluency. On one hand, high-clarity emoticons contain more pixels per square inch, meaning more details are captured. These details can clearly convey information, enabling individuals to identify and process various elements within the emoticon more accurately, thereby enhancing the smoothness and effectiveness of the processing (Glassner, 2002; O’Neil, 2011). On the other hand, high-clarity emoticons reduce the likelihood of visual disturbances and misunderstandings, offering a superior visual experience. This enables individuals to quickly identify and comprehend the content of the emoticons when viewing and processing them, resulting in smoother emoticon processing (Pellegrino et al., 1975).
Processing Fluency and Consumer Service Satisfaction
Based on processing fluency theory, the experience of processing fluency is a positive emotion for consumers and brings a sense of “feeling right” (Reber et al., 2004). Further, consumers often mistakenly associate their “feeling right” experience with the perceived high quality of the focal event and this misattribution ultimately enhances their overall evaluation (Reber et al., 2004). As a consequence, when consumers process particular information or attributes fluently, they are likely to have a more positive evaluation of the objects being processed (Liu et al., 2023a). Accordingly, we postulated that when consumers have a higher professing fluency, they will form a more favorable attitude toward the customer service who interact with them. For one thing, high processing fluency can lead to positive emotional experiences, which in turn are more likely to result in consumer satisfaction with customer services (Lee & Labroo, 2004; Reber & Greifeneder, 2017). Additionally, when consumers experience smoother processing of emoticons sent by customer services, they are better able to understand the emotions and meanings conveyed by customer services, thereby improving communication effectiveness (Kostyk et al., 2021). In conclusion, when consumers can process information more smoothly, their “feeling right” experience leads them to perceive the service provider as offering better service. Formally:
Moderating Role of Cognitive Load
In today’s society, multitasking places a high demand on consumers’ cognitive resources when processing information. Cognitive load pertains to the limited capacity of people’s cognitive abilities to process a limited number of chunks of information simultaneously (Bang & Wojdynski, 2016; Sweller, 1988). When the amount of information exceeds this limit, individuals can become overwhelmed (Wang et al., 2014). We argue that when consumers are under cognitive load, their cognitive resources become occupied and are therefore less available for the primary task at hand compared to normal circumstances. This means that it is difficult for consumers to understand and process stimuli, and consumers have reduced cognitive capacity to allocate toward the focal task (Ćirović et al., 2022).
Much research has examined cognitive load and its effects on individual creative thinking (Redifer et al., 2019), speech recognition (Mattys et al., 2009), consumer choice (Rottenstreich et al., 2007) and information processing focus (Liu, 2014). These findings consistently indicated that as cognitive load increases, cognitive ability decreases. This decrease in cognitive ability leads to impairments in memory and comprehension of information, which in turn results in a greater reliance on emotions for decision-making. Specifically, when consumers experience cognitive load, their available cognitive resources become dispersed, resulting in a reduced positive impact of clear emoticons on processing fluency. Consequently, we predict that when consumers experience cognitive load, clear emoticons no longer lead to high processing fluency, which mitigates the positive impact on consumer service satisfaction. Formally:
In summary, we propose that clear (vs. blurred) emoticons increase consumer service satisfaction. Moreover, processing fluency mediated this effect, and cognitive load played a moderating role in this mechanism. We tested these hypotheses through four studies. Study 1 investigated the influence of emoticon clarity on consumer service satisfaction using online shopping scenarios. Study 2 tested the mediation model to explore the underlying mechanism. Study 3 documented the emoticon picture clarity effect when considering some potential control variables. Study 4 confirmed that the basic effect is moderated by cognitive load. Finally, we used a single-paper meta-analysis as a corollary to verify the emoticon clarity effect. Figure 2 illustrates the final model proposed for our current research.

Final conceptual model proposed.
Study 1
Participants and Design
The goal of Study 1 is to examine the main effect of emoticon clarity on consumer service satisfaction. The recruitment information was published on Credamo (https://www.credamo.com/), a Chinese data survey platform, and two hundred participants (40.5% male, Mage = 33.99) participated in this study for payment. We used a single factor (emoticon picture clarity: clear vs. blurred) between-subject design. Participants were randomly assigned to either the clear condition (N = 100, 41.0% male, Mage = 35.26) or blurred condition (N = 100, 40.0% male, Mage = 32.72).
Procedure
Participants were instructed to imagine after purchasing a pair of sneakers, they communicated with customer service whom they needed to evaluate. At the end of the communication, the customer service sent an emoticon picture. Participants were shown a picture of the chat records about the communication. To manipulate emoticon clarity, the emoticon picture shown to participants was either clear or blurred. In all studies, we utilized the Gaussian blur function in Adobe Photoshop, a professional drawing software to adjust the clarity of emoticon images. In this way, we ensured that other parameters such as image size, color schemes, and presentation mode remained constant, with only the blurriness varying See Appendix A for blur radius specification and see Appendix B for stimuli of all studies. Furthermore, a post-test (N = 50) was conducted to confirm whether the stimulus used in the study was clear or blurred, and results revealed that the emoticon picture in the blurred condition was perceived as more blurred than that in the clear condition (Mclear = 2.92, SD = 1.12 vs. Mblurred = 5.76, SD = 1.01; t (48) = 9.43, p < .001, 95% CI: [2.235, 3.445], d = 2.67).
Then, participants were asked to report their service satisfaction after viewing the chat records. Specifically, we assessed this construct on three 7-point scale questions (i.e., “Were you satisfied with the customer service,”“Did the customer service meet your expectations,” and “How close do you feel your satisfaction with the service performance was to your ideal online shopping service”; Ruan & Mezei, 2022). Additionally, participants indicated how blurry they perceived the emoticon (1 = very clear, 7 = very blurry), serving as a manipulation check for emoticon clarity. Finally, participants reported some demographic information (i.e., gender and age). Appendix C contains the full measures.
Results
Manipulation Check
Our manipulation of emoticon clarity was successful. In comparison to participants in the clear condition, those in the blurred condition perceived the emoticons sent by customer service as more blurred (Mclear = 1.90, SD = 0.97 vs. Mblurred = 5.17, SD = 1.32; t (198) = 19.98, p < .001, 95% CI: [2.947, 3.593], d = 2.83).
Consumer Service Satisfaction
We averaged participants’ responses to the three items measuring their customer service satisfaction (Cronbach’s α = .771). As hypothesized, our results revealed that participants who received clear emoticons reported higher service satisfaction (Mclear = 5.98, SD = 0.65) compared to those who received blurred emoticons (Mblurred = 5.65, SD = 0.96, t (198) = −2.86, p = .005, 95% CI: [−0.5578, −0.1023], d = −0.40), providing further support for our main effect hypothesis (H1).
Discussion
Study 1 obtained preliminary evidence supporting our hypothesis that emoticon clarity influences consumer service satisfaction. Consistent with our expectations, participants expressed higher satisfaction when service providers sent clear emoticons compared to blurred ones. These findings imply that service providers should be mindful of emoticon clarity when communicating with consumers online. Specifically, marketers who utilize clear emoticons are likely to enhance consumer satisfaction. However, the underlying mechanism behind this effect remains unknown and our next study (Study 2) will examine how processing fluency plays a mediating role.
Study 2
Participants and Design
Study 2 aims to delve into the mechanism behind the impact of emoticon clarity on consumer service satisfaction. Two hundred participants (45.5% male, Mage = 29.24) from Credamo completed a single factor (emoticon picture clarity: clear vs. blurred) between-subject study for payment. Participants were randomly assigned to either the clear condition (N = 100, 44.0% male, Mage = 29.84) or blurred condition (N = 100, 47.0% male, Mage = 28.63).
Procedure
We instructed participants to imagine purchasing a pair of sneakers on a shopping platform and engaging in communication with customer service after receiving it. At the end of the communication, the customer service sent an emoticon. We presented the participants with the chat records of this interaction. It is worth noting that we utilized non-human emoticons in prior studies but a human emoticon in this study, demonstrating the robustness and generalizability of our findings. To manipulate emoticon clarity, we presented participants with a clear or blurred emoticon (see Appendix B). A post-test (N = 50) about emoticon picture clarity has revealed that the emoticon picture in the blurred condition was perceived as more blurred than that in the clear condition (Mclear = 2.96, SD = 1.65 vs. Mblurred = 5.68, SD = 1.18; t (48) = 6.72, p < .001, 95% CI: [1.906, 3.534], d = 1.90).
Then, participants reported their service satisfaction as in previous studies. Next, we measured their processing fluency via a three-item scale: “I find the emoticon sent by this customer service very easy to understand,”“I find the emoticon sent by this customer service difficult to process,” and “Viewing this emoticon sent by this customer service gives me a sense of feeling right” (Yan, 2016). To check the manipulation of emoticon clarity, participants evaluated how blurry they perceived the emoticons (1 = very clear, 7 = very blurry). Finally, participants reported some demographic information (i.e., gender and age).
Results
Manipulation Check
The manipulation of emoticon clarity was successful. The emoticon sent by the customer service in the blurred condition was perceived as more blurred (Mblurred = 5.93, SD = 0.91) than in the clear condition (Mclear = 2.08, SD = 1.08; t (198) = 27.23, p < .001, 95% CI: [3.571, 4.129], d = 3.85).
Consumer Service Satisfaction
We averaged participants’ responses to the three items measuring their customer service satisfaction (Cronbach’s α = .924). Consistent with the findings from previous studies, participants who received clear emoticons in their service encounters reported higher service satisfaction (Mclear = 5.87, SD = 0.77) than those who received blurred emoticons (Mblurred = 4.78, SD = 1.61, t (198) = −6.11, p < .001, 95% CI: [−1.4417, −0.7382], d = −0.86), reaffirming our main effect (H1).
Processing Fluency
We averaged participants’ responses to the three items measuring their processing fluency (Cronbach’s α = .894). Our results showed that participants who received a clear emoticon experienced higher processing fluency (Mclear = 4.71, SD = 0.45) than those who received a blurred emoticon (Mblurred = 4.34, SD = 0.80, t (198) = −4.00, p < .001, 95% CI: [−0.5477, −0.1857], d = −0.57).
Mediation Analysis
The results from PROCESS model 4 (5,000 samples; Hayes, 2012) confirmed the proposed mediation model (Figure 3), which revealed that there is a mediated relationship between emoticon clarity and consumer service satisfaction through processing fluency (β = 0.49, SE (boot) = 0.14; 95% CI: [0.2286, 0.7840]). This finding provides support for H2, highlighting the importance of considering processing fluency as a mechanism through which emoticon clarity influences consumer satisfaction in customer service interactions.

Mediation results (Study 2).
Discussion
Study 2 further validated the main effect of emoticon clarity in online service encounters by using a different type of emoticon, which extended our investigation from non-human emoticons to human emoticons. Additionally, this study delved into the underlying process by examining the mediating role of processing fluency between emoticon clarity and consumer service satisfaction. Specifically, clear emoticons led to higher processing fluency, which in turn resulted in greater satisfaction with the service experience. Overall, these results enrich our understanding of how consumers react to emoticon clarity in online service encounters. Moreover, we gain insights into the mediating effect of processing fluency in shaping how consumers respond to different types of emoticons. However, we did not take into account some potential factors that influence service satisfaction in this study, so the next study (Study 3) will include several important control variables in our model.
Study 3
Participants and Design
The purpose of this study was to test for main effects taking into account variables such as product familiarity, brand reputation, and picture attractiveness. Two hundred participants (30.5% male, Mage = 31.44) from Credamo completed a single factor (emoticon picture clarity: clear vs. blurred) between-subject study for payment. Participants were randomly assigned to either the clear condition (N = 100, 33.0% male, Mage = 30.86) or blurred condition (N = 100, 28.0% male, Mage = 32.01).
Procedure
We asked participants to imagine that they were going to buy chocolates on a shopping platform and that customer service recommended chocolate after sending a greeting emoticon. We showed participants the chat record of this interaction. In order to manipulate the emoticon clarity, we presented participants with either a clear or a blurred emoticon (see Appendix B). A post-test (N = 50) about emoticon picture clarity has revealed that the emoticon picture in the blurred condition was perceived as more blurred than that in the clear condition (Mclear = 2.32, SD = 1.31 vs. Mblurred = 5.52, SD = 0.96; t (48) = 9.82, p < .001, 95% CI: [2.545, 3.855], d = 2.78).
Then, participants reported their service satisfaction and processing fluency as in previous studies. Next, we measured several control variables on 7-point scale questions, including product familiarity (“How familiar are you with this product?,” 1 = very unfamiliar, 7 = very familiar; Ziamou & Ratneshwar, 2002), brand reputation (“How good do you think the brand’s reputation is?,” 1 = very bad, 7 = very good; Skard & Thorbjørnsen, 2014), picture attractiveness (“To what extent do you think the emoticon sent by customer service is attractive?,” 1 = very unattractive, 7 = very attractive; Ton et al., 2023). To check the manipulation of emoticon clarity, participants evaluated how blurry they perceived the emoticons (1 = very clear, 7 = very blurry). Finally, participants reported some demographic information (i.e., gender and age).
Results
Manipulation Check
The manipulation of emoticon clarity was successful. The emoticon sent by the customer service in the blurred condition was perceived as more blurred (Mblurred = 4.38, SD = 1.66) than in the clear condition (Mclear = 2.20, SD = 1.19; t (198) = 10.67, p < .001, 95% CI: [1.777, 2.583], d = 1.51).
Consumer Service Satisfaction
We averaged participants’ responses to the three items measuring their customer service satisfaction (Cronbach’s α = .831). We conducted an ANCOVA, with emoticon (clear vs. blurred) as the independent variable and consumer service satisfaction as the dependent variable, while controlling for the five aforementioned covariates (product familiarity, brand reputation, picture attractiveness, gender, and age). Participants in the clear (vs. blurred) condition were more satisfied (Mclear = 5.57, SD = 0.75; Mblurred = 4.85, SD = 1.05; F (1, 193) = 11.80, p < .001; ηp2 = 0.058). When we excluded all covariates, the difference between the two conditions was still significant (Mclear = 5.57, SD = 0.75; Mblurred = 4.85, SD = 1.05; F [1, 198] = 31.27, p < .001; ηp2 = 0.14).
Processing Fluency
We averaged participants’ responses to the three items measuring their processing fluency (Cronbach’s α = .805). We conducted an ANCOVA, with emoticon (clear vs. blurred) as the independent variable and processing fluency as the dependent variable, while controlling for the five aforementioned covariates (product familiarity, brand reputation, picture attractiveness, gender, and age). Participants in the clear (vs. blurred) condition were more satisfied (Mclear = 5.83, SD = 0.78; Mblurred = 5.13, SD = 1.27; F [1, 193] = 6.50, p = .012; ηp2 = 0.033). When we excluded all covariates, the difference between the two conditions was still significant (Mclear = 5.83, SD = 0.78; Mblurred = 5.13, SD = 1.27; F [1, 198] = 22.18, p < .001; ηp2 = 0.101).
Mediation Analysis
We ran a model with emoticon picture clarity (clear vs. blurred) as the independent variable, processing fluency as the mediator, consumer service satisfaction as the dependent variable, product familiarity, brand reputation, picture attractiveness gender, and age as control variables in a mediation model. The results from PROCESS model 4 (5,000 samples; Hayes, 2012) confirmed the proposed mediation model, which revealed that there is a mediated relationship between emoticon clarity and consumer service satisfaction through processing fluency (β = .08, SE (boot) = 0.04; 95% CI: [0.0141, 0.1521]). This finding also supports H2, showing that our proposed effect remains when considering five covariates (product familiarity, brand reputation, picture attractiveness, gender, and age).
Discussion
This study used an online shopping recommendation scenario to further validate the main effect of emoticon clarity in an online shopping scenario by using different types of emoticons. In addition, we examined the main effect by considering several control variables (product familiarity, brand reputation, and picture attractiveness). Meanwhile, this study also reconfirmed the mediating role of processing fluency in the relationship between emoticon clarity and consumer service satisfaction, with product familiarity, brand reputation, and picture attractiveness as control variables. In the next study (Study 4), we will investigate the moderating effect of emoticon clarity on consumer service satisfaction to enrich our understanding of our main effect and potential underlying mechanism.
Study 4
Participants and Design
In Study 4, our objective is to examine how cognitive load moderates the relationship between emoticon clarity and processing fluency. Two hundred participants (46.0% male, Mage = 29.61) from Credamo completed this study in exchange for payment. We employed a 2 (emoticon picture clarity: clear vs. blurred) × 2 (cognitive load: yes vs. no) between-subject design. Participants were randomly assigned to one of the four conditions: clear emoticon and cognitive load (N = 50, 56.0% male, Mage = 28.86), clear emoticon and no cognitive load (N = 50, 48.0% male, Mage = 28.80), blurred emoticon and cognitive load (N = 50, 42.0% male, Mage = 30.30), and blurred emoticon and no cognitive load (N = 50, 38.0% male, Mage = 30.46).
Procedure
To manipulate cognitive load, we followed the approach from prior literature (Madzharov & Block, 2010). In the cognitive load condition, participants first completed a memory skills test—in reality, the cognitive load manipulation. They were presented with a list of eighteen words, which included a mix of Chinese and English words, and were informed that there would be a recall task at the end of the questionnaire related to these words. In the no cognitive load condition, participants weren’t presented with this memory skill test. Next, all participants were instructed to imagine a scenario where they were communicating with customer service on a shopping platform. After the interaction, the customer service sent an emoticon which is the same as in Study 2. Participants were then shown the chat records, which included either a clear or blurred picture of the emoticon (see Appendix B). Afterward, participants reported their service satisfaction and processing fluency as in previous studies. Additionally, we also asked a manipulation check question of emoticon clarity as in previous studies. Finally, participants reported some demographic information (i.e., gender and age).
Results
Manipulation Check
The manipulation check of emoticon clarity was successful in both the cognitive load condition and the no cognitive load condition. Specifically, in the cognitive load condition, participants who were exposed to the blurred emoticon perceived the emoticon as more blurred (Mblurred = 5.34, SD = 0.20) than those who were exposed to a clear emoticon (Mclear = 2.26, SD = 0.20; F [1, 196] = 121.35, p < .001, ηp2 = 0.43). Similarly, in the no cognitive load condition, our manipulation of emoticon clarity was also successful (Mblurred = 5.74, SD = 0.20, Mclear = 2.22, SD = 0.20; F [1, 196] = 158.50, p < .001, ηp2 = 0.52).
Consumer Service Satisfaction
We averaged participants’ responses to the three items measuring their service satisfaction (Cronbach’s α = .875). We then conducted a 2 (emoticon picture clarity: clear vs. blurred) × 2 (cognitive load: yes vs. no) ANOVA on consumer service satisfaction, which demonstrated a significant two-way interaction between the effect of emoticon clarity and cognitive load on consumer service satisfaction (F [1, 196] = 6.80, p = .010, ηp2 = 0.34). As Figure 4, the planned contrast showed among participants under cognitive load, there was no significant difference between consumer service satisfaction in the clear condition and the blurred condition (Mclear = 5.64, SD = 0.16 vs. Mblurred = 5.42, SD = 0.16; F [1,196] = 0.98, p = .324, ηp2 = 0.05). However, among those under no cognitive load, the clear emoticon resulted in higher consumer service satisfaction (Mclear = 6.02, SD = 0.16) than the blurred emoticon (Mblurred = 4.98, SD = 0.16; F [1, 196] = 21.87, p < .001, ηp2 = 0.10). These results revealed that how emoticon clarity shapes consumer service satisfaction depends on the presence or absence of cognitive load.

The moderating role of cognitive load.
Moderated Mediation Analysis
We averaged participants’ responses to the three items measuring their processing fluency (Cronbach’s α = .841). We conducted a moderated mediation analysis using emoticon clarity as the independent variable, cognitive load as the moderator, consumer service satisfaction as the dependent variable, and processing fluency as the mediator (Figure 5; PROCESS Model 7; Hayes, 2012). As predicted, the impact of emoticon clarity on consumer service satisfaction was moderated by cognitive load and mediated by processing fluency (β = −.63, SE (boot) = 0.25; 95% CI: [−1.1289, −0.1804]), supporting H3. Specifically, the indirect effect of the processing fluency was significant only in the no cognitive load condition (β = .95, SE (boot) = 0.21; 95% CI: [0.5548, 1.3731]), but not in the cognitive load condition (β = .32, SE (boot) = 0.17; 95% CI: [−0.0021, 0.6714]).
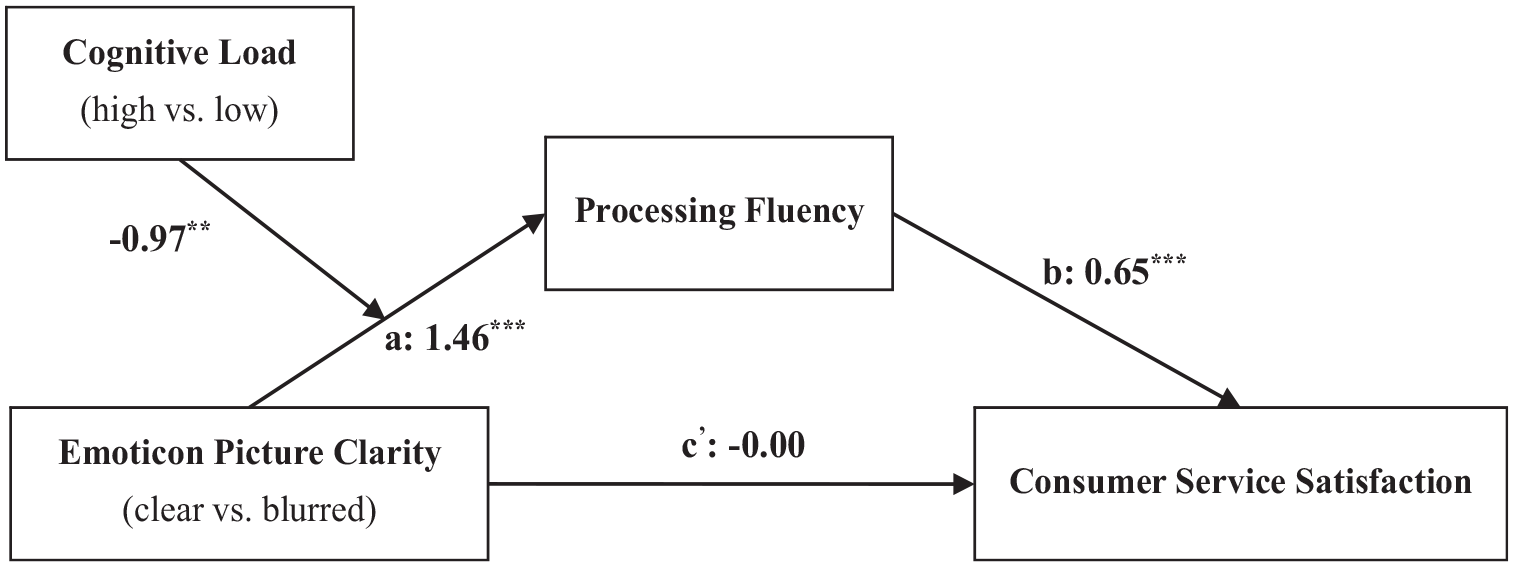
Moderated mediation results (Study 4).
Discussion
Study 4 suggested that the relationship between emoticon clarity and processing fluency is moderated by cognitive load. Specifically, when consumers are under cognitive load, the positive influence of emoticon clarity on processing fluency and consumer service satisfaction is no longer significant. This implies that when individuals are mentally occupied or experiencing high cognitive demands, they may not pay as much attention to the clarity of emoticons and their impact on service satisfaction may be diminished. Therefore, cognitive load should be taken into consideration when examining how emoticon clarity biases consumer outcomes.
Single-Paper Meta-Analysis
To assess the overall impact of emoticon picture clarity on consumer service satisfaction, a single-paper meta-analysis (McShane & Böckenholt, 2017) was conducted on all relevant studies. The results confirmed that, compared to blurred emoticons, clear emoticons enhance consumers’ satisfaction with customer service, and the overall effect estimate of β = .64, with a standard error (SE) of 0.15 (95%CI: [0.34, 0.94]). We also found a high degree of heterogeneity between studies, I2 = 89.78 (95%CI: [81.48, 94.36]). Such high heterogeneity is quite common (Pena-Marin & Wu, 2019; Taylor et al., 2019) and could be attributed to variations in study outcomes, such as different emoticon images and various shopping scenarios (post-purchase interaction and pre-purchase recommendation). See Appendix D for further details on the results.
Discussion and Conclusions
This study builds on the existing literature and supports a causal relationship between emotion clarity and consumer service satisfaction. Specifically, Study 1 demonstrated that consumers manifest higher satisfaction when service providers use clear emoticons, thus supporting H1. Studies 2 and 3 investigated the potential mechanism of this main effect, identifying processing fluency as the driving force, further supporting H2. Furthermore, Study 4 found that the positive impact of emoticon clarity on consumer service satisfaction diminished when consumers were under cognitive load, thereby supporting H3. To further substantiate our findings, we conducted a meta-analysis on a single-paper meta-analysis that corroborates the proposed effect.
Theoretical Contributions
The current research extends research on emoticons in online services by focusing on emoticon clarity, a topic often overlooked in consumer research. Aligned with previous literature on emoticons (Li et al., 2019a; Liu et al., 2023b; Ma & Wang, 2021), our current research highlights the significant impact of emoticons on consumer attitudes and behaviors. However, prior research mainly examined the impact of emoticons on consumer engagement (Valenzuela-Gálvez et al., 2023; Wang et al., 2023), message evaluation, and electronic word-of-mouth (Orazi et al., 2023), with limited focus on emoticon clarity in the consumer context. Considering the widespread use of emoticons in marketing (Van Kleef, 2009; Li et al., 2019; Wu et al., 2022), our study examines the impact of an emoticon on consumer service satisfaction. It is noteworthy that, unlike prior studies that primarily addressed the general effects of emoticons, our research specifically investigates how the clarity of emoticon pictures influences consumer perceptions and satisfaction levels in service interactions. By addressing this gap, our study provides valuable insights into the use of emoticons and enriches the emoticon clarity literature.
This paper makes a valuable contribution to consumer service satisfaction literature by identifying a new driver of satisfaction. Previous consumer research has investigated factors that promote customer service satisfaction, such as communication skills (Zabava Ford, 2003), professional knowledge (Zhang et al., 2019), provision of personalized services (Behera et al., 2021), customer expectations (Habel et al., 2016), and so on. However, few studies have explored consumer service satisfaction from the perspective of emoticon clarity. Drawing on the processing fluency model, this study establishes a connection between emoticon clarity and consumer service satisfaction, highlighting processing fluency as a potential mechanism underlying this relationship. The findings deepen our understanding of consumer service satisfaction and its antecedents as well as emphasize the importance of processing fluency, which contributes to explaining satisfaction through processing fluency.
Moreover, our study contributes to the literature related to processing fluency. Consistent with previous studies that have extensively explored the positive effect of processing fluency on consumer responses (Chan & Northey, 2021; Sohn, 2017; Youn, 2024), our research proposes that clear visual information can elicit favorable consumer behaviors, mediated by processing fluency. However, existing research has primarily revealed the effects of processing fluency through font size (Chang & Brainerd, 2022), text legibility (Oppenheimer & Frank, 2008), internal repetition of visual information (Joye et al., 2016), and other visual elements, while there is still a lack of emoticon-based exploration of the impact of processing fluency on consumer responses. Although the basic functions of emoticons may be similar to other marketing stimuli (images, colors, text, etc.), as an intuitive visual element, the emoticon can be quickly recognized and understood by users in online interactions, and their novelty and innovation offer new possibilities for marketing strategies. Therefore, studying the effect of processing fluency from an emoticon perspective remains valuable. This study investigates the effect of emoticon clarity on purchase intentions, using processing fluency as a mediator.
Finally, our study provides novel insights into the influence of cognitive load on consumer responses to emoticon clarity. While previous literature has examined the influence of cognitive load on various aspects such as advertising messages, product and brand placements, and customer decision-making (Balasubramanian et al., 2006; Rottenstreich et al., 2007; Pantoja et al., 2016), our research extends to a relatively underexplored area. Our research builds upon the foundation insights provided by Drolet and Frances Luce (2004), Madzharov and Block (2010), and White et al. (2016), who have devoted considerable attention to understanding how cognitive load impacts consumers’ reactions to products or services. Aligning with this line of research, our study also investigates the moderating role of cognitive load. However, we expand the moderating effect of cognitive load to the domain of emoticons—a digital communication tool that has become ubiquitous yet remains understudied in this context. Specifically, in our study, we examine how cognitive load shapes the effect of emoticon picture clarity on consumer service satisfaction.
Practical Implications
The results of this study carry important implications for the managerial level, specifically in relation to the impact of consumer service satisfaction on business revenues (Babakus et al., 2004; Ittner & Larcker, 1998). Lower consumer service satisfaction can lead to potential losses for service providers and firms. For instance, dissatisfied consumers are more likely to engage in conflicts with service providers, which can ultimately result in dissatisfaction with the overall firm. To mitigate these risks, marketers should pay more attention to the communication between frontline service providers and consumers, including the use of emoticons and so on, as this is an important prerequisite for consumer service satisfaction. Many marketing stimuli (images, colors, text, etc.) can shape consumer service satisfaction, and our research focuses on emoticons, which have some unique characteristics. On the one hand, emoticons act as emotional symbols that quickly convey emotions and attitudes and are not dependent on language (Cherbonnier & Michinov, 2021; Derks et al., 2008; Walther & D’Addario, 2001). On the other hand, emoticons are used more frequently and naturally in customer service and consumer interactions (Das et al., 2019; Li et al., 2019b).
Furthermore, the use of emoticons has become increasingly prevalent in online service interactions. Hence, companies should prioritize the training of their service employees on effective emoticon usage. For instance, some frontline service employees may inadvertently use blurred emoticons during service encounters, potentially decreasing consumer satisfaction. To prevent such occurrences, managers should encourage service providers to utilize clear emoticons as a means to enhance service quality. Moreover, leveraging clear emoticons represents a highly convenient and cost-effective measure, as service providers simply need to ensure emoticon clarity to improve consumer satisfaction, which is of great benefit to managers.
Finally, our study investigated the moderating effect of cognitive load. Service providers should recognize that emoticon clarity enhances consumer service satisfaction only when consumers possess adequate cognitive resources. Therefore, when engaging with consumers, service providers should make efforts to minimize potential disruptions that could impose cognitive load on consumers. For example, service providers should avoid using ambiguous or confusing language that distracts consumers’ cognitive resources. In this way, service providers can create optimal conditions for their consumers, thereby increasing their overall service satisfaction.
Limitations and Future Research
First, we primarily utilize a scenario-imagination-based experimental design to test our hypotheses, which lacks real-life authentic data to support them, limiting the external validity of our conclusions. If we were able to incorporate real-life data from actual service staff-user interactions, we would be able to observe the genuine evaluation of service satisfaction by users. However, obtaining such real-life data presents challenges, primarily due to the private nature of communication between service personnel and users on real platforms.
Additionally, more moderators, such as the association of emotions with a brand, may moderate the influence of emoticon clarity on consumer service satisfaction. Prior studies have shown that strong associations between emoticons and a brand are linked to more favorable consumer attitudes (Casado-Molina et al., 2022; Jeon, 2022b; Lee & Hsieh, 2019; Liu et al., 2019; McShane et al., 2021). In such cases, the positive effect of clear emoticons on consumer service satisfaction may be further amplified. To fully comprehend the underlying effects, further research is necessary to explore potential moderating variables and boundary conditions.
Finally, the current study focused solely on measuring consumers’ satisfaction with the service and did not explore subsequent behaviors. Future research might explore the impact of emoticon clarity on purchasing decisions, willingness to donate, and other consumer behaviors. Specifically, we can examine whether consumers are more inclined to make a purchase or participate in a donation campaign when customer service employs clear or blurred emoticons. These studies would have significant research implications for companies seeking to enhance product sales and promote public welfare initiatives.
Footnotes
Appendix
Blur radius specification for stimuli.

| Study | Blur radius in clear condition | Blur radius in blurred condition |
|---|---|---|
| 1 | 0 pixel | 9 pixel |
| 2 | 0 pixel | 8 pixel |
| 3 | 0 pixel | 5 pixel |
| 4 | 0 pixel | 8 pixel |
Appendix B. Study stimuli
Our experimental materials were in Chinese and we attached the translation on the right side.
Appendix C. Wording of Measures.

| Studies | Construct | Measures |
|---|---|---|
| 1, 2, 3, 4 | Consumer service satisfaction | Were you satisfied with the customer service? Did the customer service meet your expectations? How close do you feel your satisfaction with the service performance was to your ideal online shopping service? |
| 2, 3, 4 | Process fluency | I find the emoticon sent by this customer service very easy to understand. I find the emoticon sent by this customer service difficult to process. Viewing this emoticon sent by this customer service gives me a sense of feeling right. |
| 3 | Product familiarity | How familiar are you with this product? |
| 3 | Brand reputation | How good do you think the brand's reputation is? |
| 3 | Picture attractiveness | To what extent do you think the emoticon sent by customer service is attractive? |
| 1, 2, 3, 4 | Manipulation check-clarity | How blurry do you think that emoticon is? Very clear - very blurry |
Appendix D. Results of the single-paper meta-analysis
We conducted a single-paper meta-analysis, with detailed results presented in Tables A1-A3 and Figure A1.
Acknowledgements
Thanks to the editors and reviewers for reviewing our article.
Author contributions
Both authors contributed to the study conception and design, material preparation, data collection, and analysis. The first draft of the manuscript was written by both authors. Both authors read and approved the final manuscript.
Declaration of Conflicting Interests
The author(s) declared no potential conflicts of interest with respect to the research, authorship, and/or publication of this article.
Funding
The author(s) received no financial support for the research, authorship, and/or publication of this article.
Ethical Approval
Our research does not involve any sensitive issues, does not involve research data of special categories, does not involve research that is deceitful or has not obtained full and informed consent from participants, does not involve research that acquires personal or confidential information, such as individual genes, biometric information, etc. Data was collected through a survey platform only after the consent of the participants is obtained, and ethical permission is unnecessary.
Consent Details
Our participants were recruited from a formal survey platform, and all these participants voluntarily participated in the survey to receive money, without the need for obtaining individual informed consent forms separately.
Data Availability Statement
The data that support the findings of this study are available from the corresponding author upon reasonable request.