
Abstract
This study examines how audit committee size (ACZE), independence (ACIND), and meetings (ACMEET) affect earnings management (EM) in public non-financial companies in both Saudi Arabia (SA) and the United Arab Emirates (UAE). Based on 1,128 observations from 188 SA- and UAE-listed companies between 2016 and 2021, the comprehensive regression analysis shows that more extensive and independent mitigates earnings management. However, audit committee size (ACZE), and ACMEET meetings had little effect. The results also reveal that AC best mitigates EM in companies with minimal agency costs. Interestingly, ACIND restrained EM in companies with few political connections. However, prominent committees work best in firms with strong political connections. ACZE and independence protect companies immune to financial restatements against EM. Additionally, larger and more independent AC are inversely associated with EM in firms with low board compensation, highlighting their critical role in maintaining financial integrity. Firms with high board compensation have a weaker relationship. This study adds to the regional corporate governance literature on RCG. Analyzing AC characteristics helps clarify the relationship between AC and QFI and how they affect CG practices in different organizational areas in this region. Analyzing the characteristics of AC enables a more nuanced understanding of the relationship between AC and financial reporting quality, which adds depth to the understanding of how these characteristics operate in different organizational areas.
Keywords
Introduction
The evolution of AC as a prominent factor in corporate governance (CG) structures, together with suggestions about their composition and organization, has prompted scholarly investigations aimed at enhancing our comprehension of the governance functions fulfilled by these committees. Investigators have provided substantial factual evidence over the last two decades to support the effectiveness and significance of AC (Ali & Zhang, 2015; Dhaliwal et al., 2010; Ghafran & O’Sullivan, 2017; Islam et al., 2021; Krishnan & Visvanathan, 2008; Tanyi & Smith, 2015).
Researchers generally seek to ascertain the impact of these attributes on certain aspects of corporate behavior and QFI, with the aim of determining whether such effects are beneficial or negative (Al-ahdal & Hashim, 2022). The AC, a subcommittee of the executive board, has the duty to supervise financial reports and their releases. This is a fundamental component in the analysis of financial reports (Alabdullah et al., 2021). Consistent with Buallay and Al-Ajmi (2020), the AC plays a vital role in establishing robust CG structures. AC is expected to elevate the level of financial statements; enhance the effectiveness, autonomy, and impartiality of auditors, as well as the risk management function; and augment the process of making financial decisions. Consequently, the AC oversees accounting, auditing, and financial reporting procedures and enhances the organization’s internal control mechanisms (Anderson et al., 2004; Buallay & Al-Ajmi, 2020).
Significant empirical evidence indicates the beneficial effects of several elements on QFI. In particular, earlier research by Kent et al. (2010) and Yang and Krishnan (2005) indicated that ACZE has a significant influence. Similar results were found for committee independence, as shown by Sharma and Kuang (2014). Additionally, Kent et al. (2010) and Vafeas (2005) reveal that meeting frequency has a beneficial impact on the quality of financial information. However, no clear pattern has been consistently supported by previous research. No consistent effect has been found in research from France (Piot & Janin, 2007), Spain (Osma & Noguer, 2007), and the United Kingdom (Habbash et al., 2013). Our knowledge of the influence of AC mechanisms can be significantly affected by examining how AC characteristics work. The majority of current investigations on this topic focus on the overall function of AC and frequently examine how AC features affect broad performance metrics such as the accuracy of financial information.
Although this research is not new, most subsequent studies on this subject (Alqatamin, 2018; Fariha, 2021; Musallam, 2020) have concentrated on other Asian nations. As a result, research in SA and the UAE has mostly concentrated on board structures, ignoring the relationship between AC characteristics and the accuracy of financial information. This gap serves as an impetus for this study because AC makeup is important for corporate governance. This study advances this subject by investigates how AC characteristics impact firm performance in SA and UAE nonfinancial companies. Accordingly, future studies in SA and the UAE mostly focus on board structure and thus pay less attention to AC characteristics’ connection with firm performance (Y. A. Al-Matari, 2022; Boshnak, 2023). This gap motivates this study, given the role of AC mechanisms in mitigating earnings management. Thus, by concentrating on the impact of various AC mechanisms on business performance in SA and UAE settings, this study adds to the literature.
In this study, we use panel data fixed-effect regression with a robust standard error (control for heteroscedasticity) to examine the direct effect of independent and control variables on earnings management. The main motivation for choosing SA and UAE for study over others is that the organizational culture of companies in both countries has fairly similar characteristics, and the economies of the two countries together constitute approximately 70% of the capitalization of GCC countries. These two nations produce 33% of the world’s oil reserves (Al-Bassam et al., 2018). Managers can choose company policies because SA and UAE firm ownership is evenly dispersed across families. The CG regulation suggests hiring independent directors and financial professionals on AC in these two nations to promote disclosure (Alzeban, 2020). Thus, it is worthwhile to examine how AC practices affect SA and UAE companies. Thus, our analysis shows that AC characteristics significantly affect organizations’ QFI.
This study emphasizes how the size and independence of AC affects the accuracy of financial data. AC sessions do not seem to impact the quality of financial data. This study examines how AC traits affect earnings management accuracy when assessing the quality of financial information. This study offers senior management advice to organizations on how to restructure the AC and enhance CG practices. According to the conclusions, SA and UAE regulatory organizations should ensure that listed businesses form AC with a greater proportion of independent directors and financial experts. By bridging the knowledge gap between shareholders and management, this rule may assist organizations in minimizing agency conflicts and improving their overall performance. This study aims to shed light on the non-financial business environments of SA and the United Arab Emirates. The results of this study may help investors make wise investment choices.
The present study adds to the discussion by showing how competent AC arrangements increase financial information quality by reducing management’s EM engagement. The results of this study may aid Middle Eastern and Arab officials and regulators to assess and develop audit committee efficacy standards. By evaluating political ties, agency costs, and board compensation as aspects of AC effectiveness and their effects on the standard of financial information as evaluated by discretionary accruals, the study extends the existing research in other countries.
Review of the Literature and Development of Hypotheses
Researchers have presented various definitions of earnings management. Sasaninejad et al. (2014) define earnings management as the deliberate manipulation of profit determination to align with management goals. Earnings management, identified as a key driver of business performance misrepresentation (Dichev et al., 2013), has a significant impact on the decision-making of many stakeholders such as investors, regulators, and analysts (J. Krishnan, 2005). According to Healy and Wahlen (1999), EM refers to a practice in which managers manipulate financial reports using their own judgment to deceive stakeholders about the true economic performance of the company or to affect contractual outcomes that depend on reported earnings. This finding suggests that management teams are motivated to manipulate earnings to optimize a company’s wealth and/or the wealth of the manager. Under these circumstances, the financial outcomes and standing of the company may not be portrayed appropriately. This could potentially facilitate fraudulent activities and the occurrence of material misstatements by reporting entities. This study focuses on the adverse features of earnings management because of its reliance on a greater level of managerial discretion. According to Habbash and Alghamdi (2015), the primary motivations for Saudi managers to manipulate earnings are: “to increase the amount of remuneration,”“”“to report a reasonable profit and avoid loss,”“to obtain a bank loan,” and “to increase share price.”
Prior research has examined the correlation between various EM practices and AC effectiveness. It is generally considered that AC play a vital role in an organization’s governance structure (Baxter & Cotter, 2009). In addition to the benefits of an AC, previous research has indicated that these factors may also affect how well it oversees (Sun et al., 2014; Zehri & Zgarni, 2020). These factors include AC size, independence, expertise, and meeting frequency. As it relates to earnings management, this study analyzes three AC dimensions: ACZE, ACIND, and ACMEET.
AC Size and EM
Every nation has a varied mix of AC among the publicly traded companies. According to Abbott et al. (2004), an AC should have three to four members at the very least. According to Vafeas (2005), if the AC is too small, there may not be enough members to perform its duties, which could affect the efficiency of oversight. A committee with a small number of members can have trouble effectively performing their duties, but a committee with a large number of members may have trouble with coordination and procedural concerns. This explains the occurrence of the phenomenon. According to Vafeas (2005), these elements can result in insufficient monitoring. The relationship between the dimensions of the AC and the application of EM has been the subject of a large body of research. Agency theory posits that companies have a division between ownership and control, which results in potential conflicts of interest between shareholders (principals) and managers (agents). The size of the audit committee functions as a mechanism for shareholders to oversee the management team’s actions and ensure that they are in line with shareholders’ best interests. AC size of AC can significantly associated with earnings management.
A thorough investigation has produced a range of results (Baxter & Cotter, 2009; Pratomo & Sudibyo, 2023). According to Lin and Hwang (2010), ACZE and EM have statistically significant negative relationships. In contrast, Davidson et al. (2005) find no evidence of a relationship between the number of discretionary accruals and AC size in their study of 434 publicly traded Australian companies. According to G. Krishnan and Visvanathan (2009), the goal of choosing the right AC size is to achieve a compromise between providing effective control and facilitating effective monitoring. As it lowers the possibility of financial statement restatements, the size of the AC has been proven to positively affect both audit and earnings quality (Agyei-Mensah & Yeboah, 2019). Consistent with Vafeas (2005), there is a relationship between AC size and monitoring effectiveness. According to the author, it may be difficult for smaller AC to perform all their duties effectively. Previous studies have revealed that four people make up the ideal average AC (Abbott et al., 2004; Cohen et al., 2008). According to Lin et al. (2006), ACZE significantly affects how managers’ participation in earnings manipulation is mitigated.
Moreover, M. Mishra and Malhotra (2016) find an important connection between ACZE, the number of directorships held by AC members, and the frequency of ACMEET and earnings quality. There are scant data to support the idea that other AC characteristics significantly affect the degree of EM in India. According to the empirical data of Zehri and Zgarni (2020), the size of the audit engagement, presence of an AC, and makeup of the board of directors have a statistically significant effect on mitigating EM. The dimensions of AC and prevalence of EM activity were found to be correlated in earlier studies. According to Ghosh et al. (2010), ACZE and discretionary accruals are substantially correlated. According to research, companies with smaller AC typically accrue more discretionary spending. This suggests that AC with more members have more skills and knowledge, which helps them to oversee financial reporting activities more successfully. Salihi and Jibril (2015) found a strong association between AC size and the extent of EM in their investigation. Galal et al. (2022) found that ACZE and their degree of independence were positively correlated in their study. They also discovered a connection between EM, as determined by discretionary accruals, and the previously described association between non-financial companies listed in Egypt. However, from 2012 to 2019, the researchers were unable to detect any appreciable effects of ACMEET frequency on these characteristics. Any company listed on the Saudi Stock Exchange (Tadawul) is required to create an AC with a minimum of three members in accordance with the Saudi Code of Corporate Governance. This study claims that ACZE has a major impact on EM and aims to test the following theories scientifically:
Audit Committee Independence and EM
ACIND in publicly traded companies has received widespread recognition partly because of its major contribution to the generation of trustworthy financial data used by investors and other stakeholders. It is widely recognized that ACIND is crucial for ensuring an AC’s overall effectiveness and permitting improved oversight of corporate financial disclosure methods (Bliss et al., 2011; Carcello et al., 2011; Tušek, 2015). Many regulatory organizations and academics agree that a member is often regarded as independent if they have no personal or financial ties to the company or any other board members. In this study, independent CEOs have been stressed as crucial for monitoring and oversight (Armstrong et al., 2014; Chen et al., 2015; Klein, 2002).
According to Sharma and Kuang (2014), evidence supports the idea that EM and ACIND have a poor connection. Salleh et al. (2014) did a study to look into the impact of ACIND on EM practice. According to the conclusions of this study, ACIND is more effective in limiting EM. According to Al-Rassas and Kamardin (2016), there is a significant and direct relationship between independent AC and the use of accrual EM. According to Baxter and Cotter (2009), the degree of independence displayed by an AC is inversely related to the EM. According to Sun et al. (2014), a direct link exists between ACIND and a decrease in discretionary accruals. Evidence shows that increasing the number of independent directors serving on the AC can result in a decrease in anomalous accruals (Klein, 2002; Soliman and Ragab, 2014). Therefore, the current study emphasizes the important role of independent AC in society. Almarayeh et al. (2022), Salem et al. (2023), Chatterjee and Rakshit (2023), and Davidson et al. (2005) found a negative association between ACIND and earnings management in an Australian setting. The outcomes of these studies were comparable. Soliman and Ragab (2014) find that discretionary accruals, a stand-in for EM, and ACIND are significantly negatively correlated in Egypt. According to Bédard et al. (2004), aggressive EM and AC have a negative connection with total independence in the US. The following theory is formulated based on the aforementioned justifications:
ACMEET and EM
Several studies have claimed that regular meetings of the AC during the financial year are essential for real control. According to previous research (Abbott et al., 2004; Xie et al., 2003), the frequency of meetings is positively correlated with people’s capacity to carry out supervisory responsibilities. Several studies have focused on the association between ACMEET and EM. However, despite thorough investigation, the results were ambiguous, which can be attributed to differences in CG standards among other nations because of their various legal systems, cultural norms, and political difficulties. Intriguingly, Abbott and Parker (2000) and Lin and Hwang (2010) revealed an inverse relationship between the use of ACMEET and EM techniques.
Karla and Bedard (2004) state two main factors: (i) the duties and responsibilities that the committee is expected to fulfill and (ii) ACMEET—determine the quantification of the activity level of committee meetings. Previous studies have demonstrated the significance of meeting frequencies. According to Katmon and Farooque’s (2017) analysis, there is a direct link between fewer ACMEET and lower levels of discretionary accruals. According to previous studies (Abbott et al., 2004; Zgarni et al., 2016), conducting regular meetings with AC members improves CG and lowers managers’ involvement in profit manipulation. Sun et al. (2014) found that an AC that is actively involved and holds regular meetings demonstrates more efficiency and is linked to more efficient monitoring processes (Chatterjee & Rakshit, 2023; Kaoje et al., 2023). Moreover, Lin and Hwang (2010) and ACMEET have substantial influence on the caliber of revenue. According to Ebrahim (2007), a higher degree of engagement within AC is linked to a reduction in earnings manipulation. According to the literature, a higher frequency of ACMEET has the potential to reduce the incidence of financial fraud and financial reporting mistakes. Based on this evidence, this study proposed and validated the following hypothesis:
Data and Techniques
Sample Size and Population
Annual reports and accounts of the sampled companies from 2016 to 2021 were used as a secondary source of data collection. This sample is similar to previous studies (Almuzaiqer et al., 2022; Hashed & Almaqtari, 2021). Various filters were created to produce the data necessary for the analysis. First, because of their distinct reporting systems and financial rules, financial and insurance organizations were omitted from the study (Rajan & Zingales, 1995). As a result, the annual reports of the sampled companies retrieved from the Saudi Stock Exchange Market (TADAWEL), Abu Dubai stock market (ADX), and Dubai stock market (DFM) were used to compile corporate governance-related data. Company-level data were also acquired from the company websites. Second, as stated in Table 1, the current study includes 1,200 observations and 240 non-financial businesses across 12 industries listed on the SA Stock Exchange (TADAWEL) and UAE Stock Exchange (ADX and DFM). Third, businesses with a significant amount of missing data are disregarded. Ten firms were removed by Wensorize owing to their unusual values. As indicated in Table 2, this study used a net sample of 188 organizations with 1,128 observations.
Target Population by Industry.

Data Source: TADAWEL stock exchange (SA) and ADX & DFM (UAE) as at 31 December 2021.
Computation of Valid Sample.

Variables Measurement
To proxy for AC attributes, size, independence, and frequency of meetings were used as independent variables. The DV represented by discretionary accruals is earnings management, as Jones (1991) defines it. The control variables were used in the regression analysis.
We used three moderating variables to test for heterogeneity: political connections, agency costs, and board compensation. The following is a brief explanation of how each variable was measured.
Dependent Variable
Discretionary accruals are used to measure EM. The modified Jones model (1991) by Dechow et al. (1995) was improved by Etemadi et al. (2014), and is a more effective model for identifying EM. The two primary parts of discretionary accruals (DA) are total accruals (TA) and nondiscretionary accruals (NDA).
The discretionary accrual calculation using the Modified Jones Model is as follows:
Total accruals (TA) were calculated using Equation 1:

Calculating non-discretionary accruals using Equation 2:

Equation used to calculate discretionary accruals 3:

TAit = the firm’s total accruals for year t.
Ait-1 = the sample firm i’s total assets in year t−1.
DREVit = the change in the company’s revenues for the year t;
DRECit = the change in the firm’s net accounts receivable for year t
PPEit = gross value of the company’s property, plant, and equipment in year t.
Independent Variables
Size, independence, and meetings are typically considered major proxies for evaluating the efficacy of AC (DeZoort et al., 2002). These are the primary explanatory factors. The first is the number of people in an AC (Haji, 2015; Klein, 2002). The laws and regulations in SA and the UAE stipulate that the AC must have a minimum of three members. Therefore, we designated the code “0” for organizations having three AC directors and “1” for organizations with more than three directors. According to legislative regulations in SA and the UAE, organizations with three directors on AC obtained a code “0,” while those with more than three directors received a code “1.” Third, the annual frequency of ACMEET is quantified (E. M. Al-Matari, 2020). Publicly traded firms that held no more than four meetings per year were assigned the code “0,” whereas those that held more meetings were assigned the code “1.” The measurements of independent variables are presented in Table 3.
Measurement of Independent Variables.

Control Variables
We discovered numerous control factors employed in previous studies (Aanu et al., 2014; Bansal & Sharma, 2016; Dyck & Zingales, 2009; Epps & Cereola, 2008; Jiraporn & Gleason, 2007; Lepore et al., 2018); the following list: Natural logarithm of total assets is Ln Total Asset (FSZE); Total debt to total asset ratio is referred to as debt level (LEV); Net income to shareholder equity ratio is known as the firm performance (ROE) ratio. Industry Type (IND) is a categorical variable; Sales Growth (GRW) is the percentage increase in sales from the previous year over the current year; Board Size (BSZE) is the number of directors who are executives; Board Independence (BIND) = the proportion of outside directors; Ownership Concentration = Total Shares Outstanding/Total Value of Shares Held by CEO in a year; Other Control variables (OCV) =Total assets, proportion of inventory in total assets, return on assets (ROA); cash holding = the cash and cash equivalent/total assets; Year = 2016–2021. Table 4 summarizes the information on the control variables.
Measurement of Control Variables.

Measurement of Moderating Variables
To ensure a comprehensive and reliable presentation of the research findings, this study included three moderating variables to conduct the heterogeneity tests. These variables include political connections, agency costs, and executive remuneration. Moderating analysis was conducted by categorizing the study samples into several groups according to firms’ political connections, agency costs, and executive pay levels. An additional moderating study was conducted to ascertain whether three separate scenarios could potentially yield varying regression results regarding the direct influence of AC characteristics on EM. Our research examines the potential impact of many factors, namely strong or weak political ties, high or low agency expenses, and high or low board compensation, on the outcomes of a fundamental regression analysis.
Model Specifications
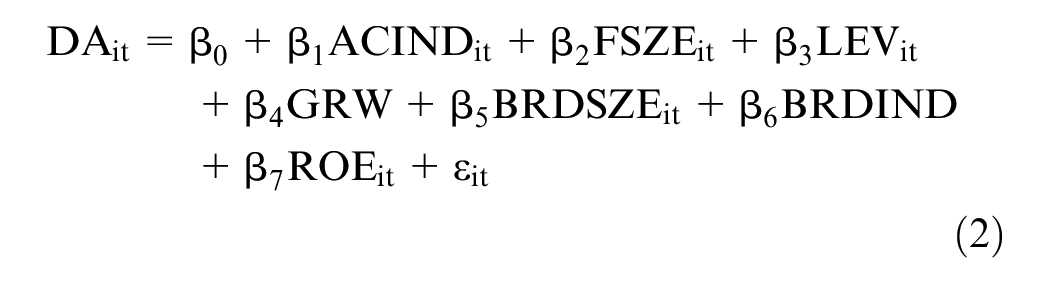
Examining whether AC features in publicly traded businesses in SA and the UAE could affect the quality of financial information by reducing EM is one of the main goals of this study. Three mathematical models were created, and regression analyses were performed. The details of the regression models used to analyze the relationship between AC characteristics and EM are presented as follows.
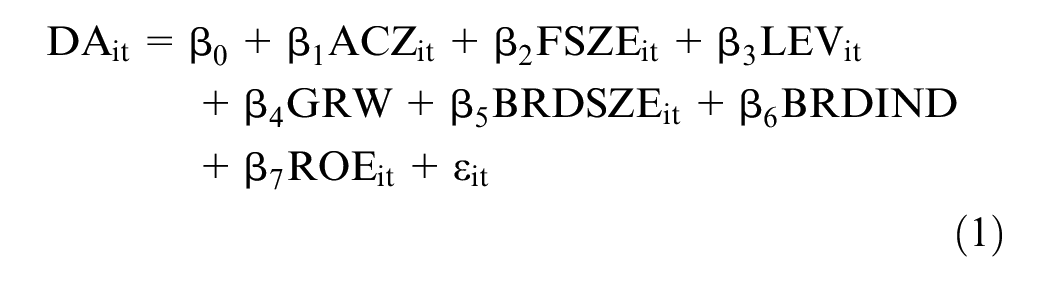

Where:
DA = Discretionary accruals,
ACZE = audit committee size,
ACIND = audit committee independence,
ACMEET = Audit committee meetings,
FSZE = firm size,
LEV = leverage,
GRWGRW = sales growth,
ROE = return on equity,
BSZE = board size,
BIND = board independence, and
ROE = return on equity.
Empirical Results
Diagnostic Tests
Prior to commencing the data analysis process, it is imperative to conduct post-estimation tests to ascertain the suitability and quality of data for analytical purposes. The data were thoroughly examined based on assumptions made in the fundamental regression analysis to reduce the risk of obtaining misleading results. To start, the “Wensorize” method is used to look for any potential outliers. The results of the Mahalanobis test performed in this study indicate that 10 firm/year obtained a score lower than 0.001. The exclusion of these firms from the sample was justified because their scores were beyond the established threshold of the Mahalanobis distance, set at 0.001. The inclusion of these outliers in the analysis could potentially introduce bias and inaccuracies in the hypothesis-testing findings. According to Hair et al. (2010), removal of outliers has been found to enhances outcomes.
Furthermore, the regularity distribution of the data was evaluated by examining the Skewness and Kurtosis values. The findings indicate that all the factors examined in the study’s data are normally distributed, as shown by the data presented in Appendix 1. Hair et al. (2010) proposed that in a substantial sample size (e.g., 200 or more), the impact of non-normality on the analysis is negligible and can be disregarded. Given the substantial number of observations (1,128) analyzed in this study, it is plausible that the results obtained under this particular scenario may not be subject to distortion. Nevertheless, it is noteworthy that the hypotheses were rigorously assessed and the data underwent a rigorous cleaning process. multicollinearity was evaluated by examining a correlation matrix. Researchers can acquire a complete picture of data in their study using correlation matrices (Drobetz et al., 2004). A correlation matrix was used to determine the correlation between dependent and independent variables. multicollinearity among independent variables was also examined in this study. As shown in Table 5, the Pearson correlation method was used to assess and clarify the strength of the links between variables in this study.
Correlation Pearson for 1,128 firms Observations.

p < .01. **p < .05. *p < .1.
According to Gujarati (1995), multicollinearity may be a problem if the correlation in a correlation matrix comprising all independent variables is greater than 0.80. The correlation matrix analysis provides evidence that this study does not exhibit detrimental multicollinearity, as none of the variables demonstrates a correlation of over .80. Generally, the correlation coefficients of the dependent, independent, and control variables, which were observed in the correlation matrix, did not exhibit a statistically significant level of association above .80. Hence, the findings in Table 5 demonstrate the absence of multi-collinearity.
Statistical Evaluation
Descriptive statistics for the numerical and binary variables in the linear regression approach applied to SA and UAE non-financial listed firms during 2016 to 2021 are presented in Table 6. The statistical results showed that the EM score had a mean of 0.159, whereas the means for AC_ Size, AC_ Independence, and AC_ Meetings were 0.430, 0.520, and 0.540, respectively. A particular variable used as an explanation can be correlated with other explanatory variables without experiencing any appreciable difficulty, as shown by the fact that all correlation coefficients in Table 5 are less than 0.9. Additionally, all variables have a variance inflation factor (VIF) under 10 Table 7, which is the upper limit recommended by Gujarati (1995), Kennedy (1998), and James et al. (2013). These findings indicated that no significant issues were identified.
Statistical Evaluation.

Variance Inflation Factor.

Regression Analysis
To examine the impact of AC characteristics on Earnings Management as shows in Table 8 the following empirical model is utilized: control variables may have an effect on EM (FSZE, LEV, GRW, OWNC, CASHH, BRDSZE, BRDIND, and ROE). Examining the direct effect of the independent and control variables on earnings management, this analysis employs panel data fixed-effect regression with a robust standard error (control for heteroscedasticity).
Basic Regression Results: ACZE, ACIND, ACMEET and EM (Obs. 1,128).

Note. DAC= discretionary accruals; ACZE = audit committee size; ACIND = audit committee independence; ACMEET = Audit committee meetings; FSZE = firm size; LEV = leverage; GRW= sales growth; ROE = return on equity; BSZE = board size; BIND = board independence; OWN= ownership concentration; CASHH= cash holdings.
p <.10. **p <.05. **p <.01.
The results of this study are similar to those of prior studies in the Western context, such as in the USA and the UK, which revealed that CGMs could reduce earnings manipulation (Peasnell et al., 2005). However, in Asian countries, some studies have reported that CGMs are ineffective in mitigating agency problems (Cheung & Chan, 2004). Nevertheless, a review of the literature indicates a dearth of research on the internal firm-level determinants of EM in the context of SA and the UAE. Moreover, very few studies (e.g., Almaqtari et al., 2021; Kolsi & Grassa, 2017) focus on country-based predictive variables of EM in the UAE context. In their research on the impact of audit committee characteristics on earnings management in Vietnamese listed companies for the period 2015 to 2018, Ngo and Le (2021) report that the size and expertise of the audit committee are inversely related to discretionary accruals representing earnings management. According to Al Azeez et al. (2019), board independence has a significant impact on the reduction of earnings management, as it plays an essential role in disciplining and monitoring managers’ practices in earning and ensuring that managers set objectives aligned with shareholders’ interests.
Robustness Test
Robustness tests were conducted to ensure that any potential bias resulting from individual firm or year fixed effects did not alter the estimations of the study’s findings to assess the strength and reliability of the results. In this regard, this study used three robustness evaluations.
Alternative Measurements of the EM
Regression analysis was performed based on an alternate measure of EM using Dechow and Dichev’s (2002) model and Equation 4:

Where:
CACCt = current corporate accruals for year t;
TAt−1 = total asset value on average since year t−1;
OCF t + 1= cash flow from operations from year t + 1.
The signs and coefficients of the primary models exhibit notable resemblance to those of the robustness checks. According to this study, there was a poor association between EM and the size and independence of the AC. The estimated values for this relationship were −0.059 (p = .002) and −0.068 (p = .011), respectively. The calculated value of −0.012 at a significance level of 0.231 indicates that there is no significant association between ACMEET and EM.
Robustness Test: Adding Control Variables
The third robustness test employed two more control variables in the basic regression analysis: cash holding and ownership concentration. The mathematical models used for basic regression are presented in Table 9. This section presents the robustness tests by conducting a regression analysis by adding two more control variables: cash holding and ownership concentration.
Robustness Test Adding More Control Variables.

Note. DAC = discretionary accruals; ACZE = audit committee size; ACIND = audit committee independence; ACMEET = Audit committee meetings; FSZE = firm size; LEV = leverage; GRW = sales growth; ROE = return on equity; BSZE = board size; BIND = board independence; OWN = ownership concentration; CASHH = cash holdings.
p < .10. **p < .05. ***p < .01.
Table 9 illustrates the robustness of the findings using the addition of the two control variables, cash holdings and ownership concentration, in conducting the basic regression models.
The reported outcomes agreed better with the findings shown in Table 10 from the major regression model. The findings provide empirical evidence that ACZE and autonomy negatively affect EM practices. Nevertheless, it is important to note that the number of ACMEET per week did not seem to have a statistically significant impact.
Robustness Test: Alternative Measure of EM (Obs. 1,128).

Endogeneity Tests
This study investigated potential endogeneity concerns by employing two-stage least squares methodology. This study uses the industry average of the three main firm-specific independent variables as instrumental variables: ACZSE, ACIND, and ACMEET. Endogeneity test. An additional test used in the present study is the endogeneity test, which is conducted using the generalized method of moments (GMM). Similar to the steps taken by Suman and Singh (2021), the test consists of a two-step GMM estimator. The testing uses a lagged endogenous variable model (Din et al., 2021), allowing fewer samples to be used compared to those in the previous test. Shahab et al. (2022) during the period 2002 to 2019 results are robust to alternate proxies of main variables and potential endogeneity concerns (using propensity score matching, two-stage least squares, and generalized system method of moments technique). Prawitt et al. (2009) and Erickson et al. (2006), who contend that the behaviors of AC members in a specific firm are probably influenced by industry-wide practices, serve as a basis for this judgment. Furthermore, there is no real connection between them and EM. Prawitt et al. (2009) used 2SLS in the data analysis, while Erickson et al. (2006) used the industry average.
Endogeneity Test for AC Size and EM
The Table 11 illustrates the outcomes of a statistical technique known as Two-Stage Least Squares (2SLS), which was used to examine the connection between the dimensions of AC (ACZE) and the occurrence of EM (INV/ASSETS). This particular type of analysis is frequently used when endogeneity or the potential for a bidirectional link between the independent variable (the size of the AC) and the dependent variable (earnings management) is a concern.
Two-Stage Least Squares Test (2SLS) of AC size, AC Independence and AC Meetings and EM (Obs. 1,128).

p < .10. **p < .05. ***p < .01.
This finding indicates that when considering endogeneity through the use of the 2SLS technique, there exists an important negative impact of AC size on the practice of EM. The negative coefficient of “ACZE Prediction” in the second stage provides clear evidence of this. The results of this study show a substantial inverse link between ACZE and EM levels, highlighting the beneficial impact of a larger AC on the accuracy of financial reporting and CG efficiency.
This Table 11 provides the results of a statistical analysis called Least Squares in Two Stages (2SLS), which was performed to examine the relationship between AC independence (INDAVACZE) and EM (INV/ASSETS). As shown in the previous table, this analysis addresses endogeneity issues in the observed relationship.
The results of the 2SLS analysis in Table 11 indicate that when endogeneity is considered, there is a considerable negative influence on the practice of EM. The second stage’s inclusion of a negative coefficient, notably with respect to the “ACZE Prediction,” provides unmistakable proof. According to this study, there is an inverse relationship between ACIND and EM use, which has positive ramifications for maintaining financial reporting accuracy and boosting CG.
The results of a Two-Stage Least Squares (2SLS) study that investigates the connection between AC meetings (ACZE) and EM (INV/ASSETS) while adequately resolving any endogeneity problems are presented in the table.
The results obtained from the two-stage least squares (2SLS) analysis presented in Table 11 demonstrate that, upon considering endogeneity, a statistically significant positive correlation exists between the number of ACMEET each month and EM usage. This assertion is supported by the second stage’s positive “ACZE Prediction” coefficient. The results of this investigation show an unexpected finding of a statistically significant positive correlation between the number of AC encounters and EM intensity. The analysis of this outcome within the context of one’s study and the investigation of possible justifications for this correlation are essential factors to consider.
Heterogeneity Tests
AC plays a crucial role in the reduction of EM by guaranteeing the accuracy and transparency of financial reporting. The efficacy of AC in fulfilling their obligations is greatly influenced by various factors, such as Political Connections (PC), Agency Costs (AGC), and Board Compensation (BCOMP). Political connections can influence corporate decision-making and generate biases and conflicts of interest. When management’s and shareholders’ interests are not aligned, the cost of the agency becomes a problem and can become expensive. Board compensation also impacts earnings management because compensation systems can create incentives to manipulate financial results. By addressing these factors, AC can effectively carry out their responsibility of mitigating EM, safeguarding shareholder interests and upholding trust in financial markets. Our study is similar to previous studies (Alhebri et al., 2021; Ibawa & Wardhani, 2018; Kim & Jang, 2023) that divided the sample data into two categories (high or low).
Finally, the estimation results of the basic regression were obtained by performing heterogeneity tests. We employ three moderating variables: political connections (PC), agency costs (AGC), and board compensation (BCOMP). The study sample was divided into firms with high or low political connections, firms with high or low agency costs, and firms with high or low board compensation levels. Table 12 presents the measurement scales used to assess these four moderating variables.
Measurement of Moderating Variables.

Political Connections (PC)
The identification of corporations that possess significant political connections and those that have relatively lower levels of political influence can be accomplished using Shannon entropy weighting and the technique for order preference by similarity to ideal solution (TOPSIS). A binary variable, the political effect variable, takes a value of one for businesses with strong political ties and zero for businesses without such connections. Faccio et al. (2006) used political cost considerations to distinguish between these businesses.
(1) The number of employees directly correlates with the level of interaction between an organization and the Ministry of Labor and Social Affairs.
(2) The income tax level directly influences the extent of a firm’s affiliation with the Ministry of Economic Affairs and Finance.
(3) The level of connection with the Commerce Department is positively correlated with the magnitude of total export sales.
(4) Stock market value is directly proportional to the firm’s affiliation, a branch of the Ministry of Economic Affairs and Finance, with the Stock Exchange.
(5) As the book value of assets increases, a higher correlation is observed between it and the Ministry of Economic Affairs and Finance.
(6) The extent of the employer’s insurance contribution and the level of unemployment are positively correlated with the degree of association with the Ministry of Labor and Welfare. Researchers measure PC by assessing the networks of the CEO or its or previous position (working in parliament or ministry). Owing to the lack or difficulty of obtaining similar data, this research focused on measuring political connections based on data gained from public companies’ financial statements and annual reports. The political connection indicator is measured by calculating the sum of the six dimensions. Equal proportions were assigned to each dimension and compared to the mean scores. A publicly listed company is considered to have strong political connections when its total score is higher than its mean score.
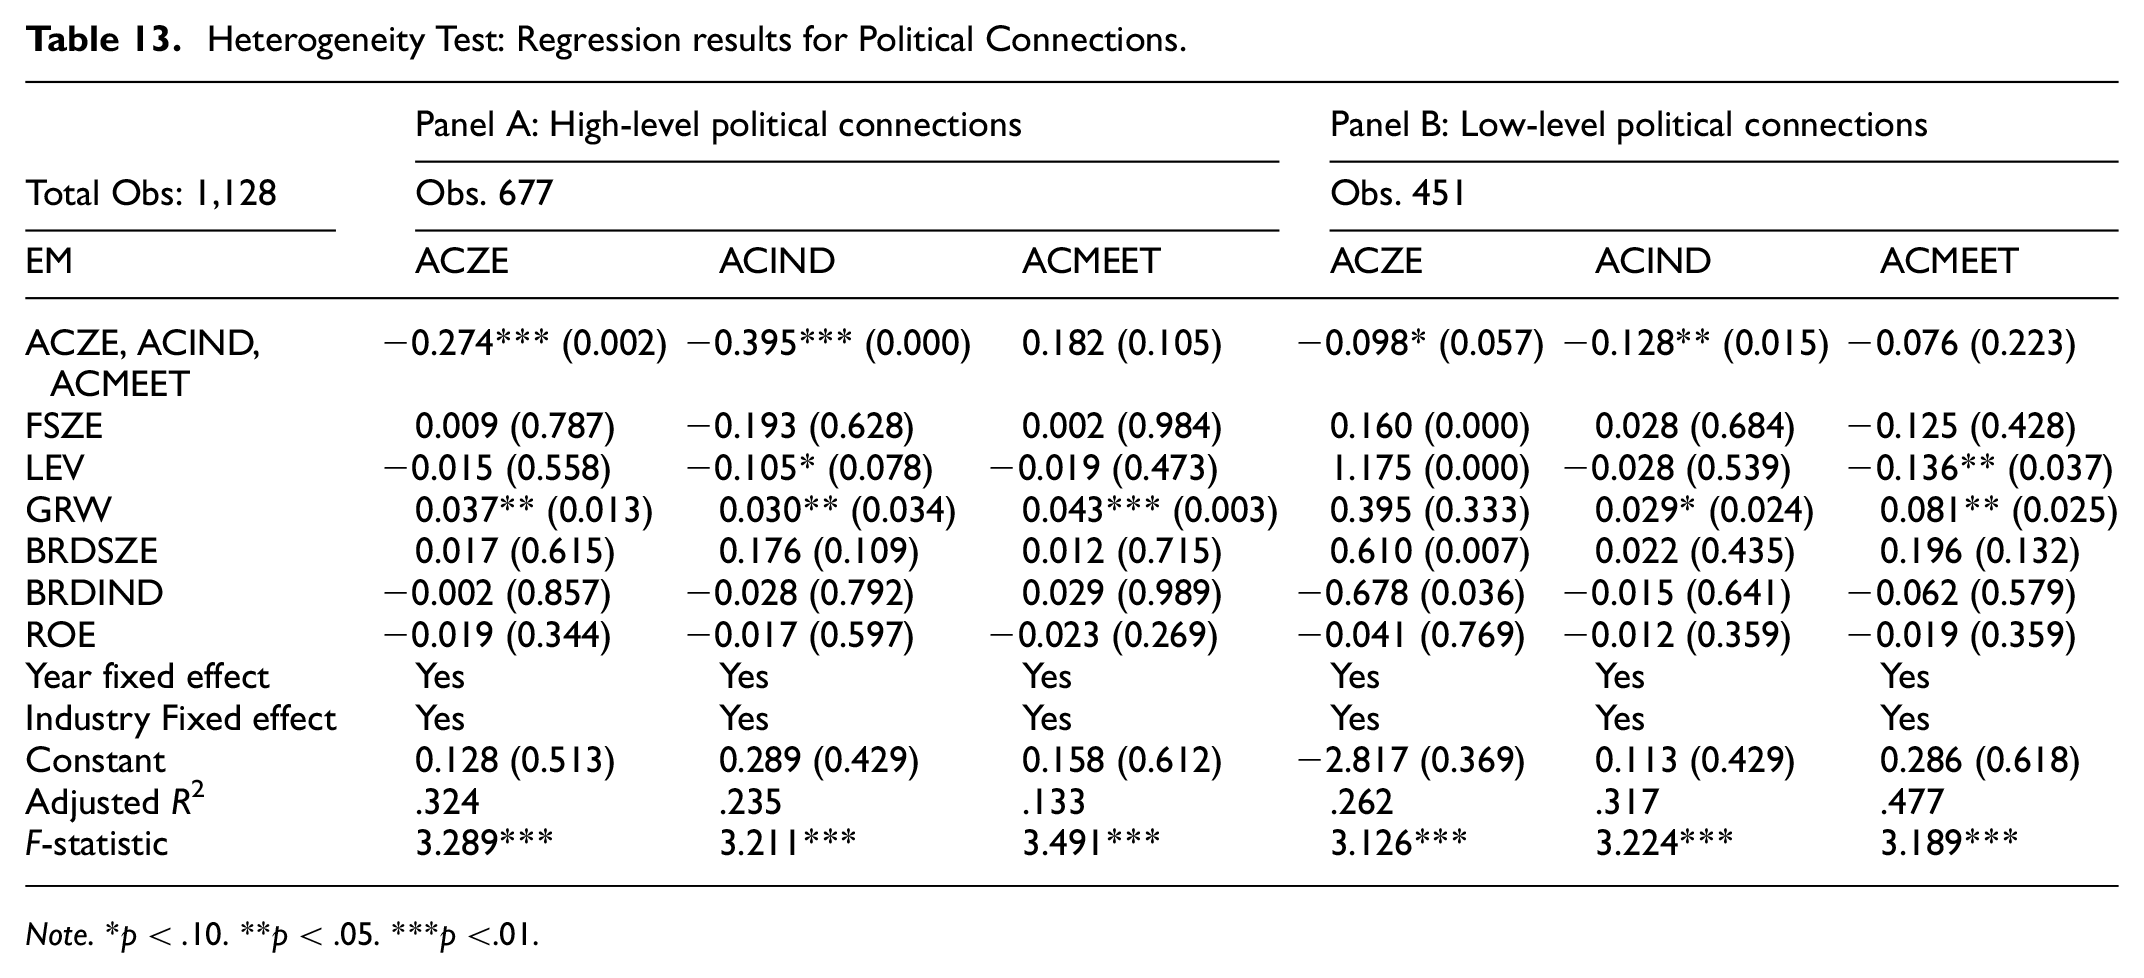
This study investigates the influence of AC characteristics (ACZE, ACIND, and ACMEET) on EM in two distinct panels categorized based on the presence of political links within the sample as follows in Table 13. A study conducted by a panel of researchers revealed a significant correlation between the presence of a larger and more independent AC and a reduction in EM practices inside firms that possess strong political links. Nevertheless, the ACMEET framework lacks statistical significance within this context, indicating that the frequency of ACMEET does not have a substantial impact on EM manipulation in companies that possess robust political ties. On the other hand, it can be observed from panel B that the affect of ACZE and independence on EM is not statistically significant in companies that have limited political links. A negative correlation exists between the frequency of ACMEET and EM practices in corporations with limited political affiliations. In summary, our findings suggest that the impact of AC characteristics on EM manipulation depends on the degree of political association.
Heterogeneity Test: Regression results for Political Connections.
Note. *p < .10. **p < .05. ***p <.01.
High-level political connections have a greater impact on earnings when the AC exerts supervisory effects. Low-level political connections in a company make AC less effective at reducing EM.
The findings of the intergroup difference test regarding the influence of ACZE and independence on EM in the high- and low-politically connected groups are presented in Table 14. The observed discrepancy in the coefficient values of ACZE between firms with high and low political connections (−0.176) suggests that the influence of ACZE on EM is more pronounced for firms with strong political ties. Furthermore, a p-value of .031 indicates that this disparity was statistically significant at a significance level of .05. Similarly, the coefficient disparity (−0.267) pertaining to ACIND in both sets of entities indicates that’sIND the influence on EM is more noticeable in firms with significant political affiliations. Furthermore, this mismatch is statistically significant at the .01 level, as shown by the p-value of .009.
Inter-group Coefficient Difference for ACZE and ACIND.

Agency Costs (AGC)
The level of agency costs was used to categorize the valid sample as either a high agency-or low agency costs-based company. Median values were used to determine firms with high agency costs and board compensation. A value of 1 was given to firms paying higher agency costs and board compensation superior to the respective median value; otherwise, 0. While ACIND had a negative impact on EM only in firms with minimal political ties, ACZE and independence had a higher negative impact on EM in firms with high PC than in firms with low PC. When the agency’s cost to a company is low, this gives an advantage to the internal AC in carrying out its supervisory work on management, which, in turn, leads to a more important impact in mitigating EM in the company.
Agency conflicts have the potential to create favorable conditions for managers to manipulate earnings. Chung et al. (2003) claim that managers are driven to actively monitor financial data to improve their financial performance, earn bonuses, and reduce the likelihood of running financial trouble. A. V. Mishra and Ratti (2011) contended that effective CG practices must be implemented to protect shareholder interests and reduce agency expenses. The inclusion of internal audit and board compensation committees has a major effect on reducing agency costs (Singh & Davidson, 2003). Agency expenses were evaluated using a scale created by Man and Locke (2018).
The table provides the results of a heterogeneity test that examines the effect of AC characteristics (ACZE, ACIND, and ACMEET) on EM in two panels, classified based on the degree of agency cost observed in the sample.
The data presented in Table 15 illustrate the impact of AC attributes on EM practices within companies characterized by heightened agency expenses. The findings indicate that various aspects of the AC, such as its size, independence, and frequency of meetings, do not have a statistically significant impact on EM in firms that face higher agency expenses. The study incorporates supplementary variables, including company size, leverage, growth, board size, board independence, return on equity, year fixed effects, and industry fixed effects.
Heterogeneity Test: Regression results for Agency Cost.

Note. *p <.10. **p < .05. ***p < .01.
By contrast, the results show that companies with lower agency costs experience a significant decline in EM when they have a larger and more autonomous AC. Additionally, the analysis incorporates fixed effects for both the year and industry variables. In general, the findings suggest that the influence of AC characteristics on earnings manipulation depends on the level of agency costs.
Board Compensation
It is anticipated that the existence of high pay for the board of directors will increase the efficiency of internal AC in EM mitigation as shows in Table 16. Conversely, low compensation for the board of directors diminishes the efficacy of internal audit management in reducing EM.
Heterogeneity Test: Regression results for Level of Board Compensation.

Note. *p <.10. **p < .05. ***p < .01.
When the study sample was divided based on high or low compensation, it was observed that in firms with high board compensation, the size, independence, and meeting frequency of the AC had a positive effect on EM. However, only ACIND had a detrimental effect on EM in companies with low board compensation.
Discussion of Results
According to the findings of the regression investigation, the sizes of AC and EM were negatively correlated. The coefficient value of the ACZE variable is −0.195, indicating that EM declines as ACZE increases. This relationship is statistically significant at the 0.01 level, as indicated by the p-value of .007. Therefore, it can be concluded that hypothesis H1a is supported. Furthermore, ACIND had a detrimental impact on EM, as evidenced by a coefficient value of −0.241 and p-value of .000 at a significance level of .01. Thus, Hypothesis H2b is deemed acceptable. The findings showed no connection between EM and the frequency of ACMEET. The coefficient for this relationship is negative (−0.045), suggesting a weak inverse association. Additionally, a p-value of .159 suggested that this finding was not statistically significant. Therefore, Hypothesis H3c is deemed invalid. Furthermore, the control variables FSZE (Firm Size), LEV (Leverage), GRW (Growth), BRDSZE (Board Size), BRDIND (Board Independence), and ROE (Return on Equity) are also included in the regression, but only GRW (Growth) shows that AC characteristics had a significant impact on EM, with coefficient values of −0.037, −0. 030, and −0.043, respectively, and p-values of .013, .034, and .003, respectively, at a significance level of 0.01. The other controls do not exhibit any connections to EM, which is meaningful.
Conclusion
In this study, we examine a dataset that includes 1,128 companies, AC variables, and EM data collected from the Saudi Stock Exchange (TADAWEL), Abu Dhabi Stock Market (ADX), and the Dubai Stock Market (DFM) in the investigation period from 2016 to 2021. Following the agency theory perspective, the role of ACs is essential in reducing asymmetric information and conflicts of interest between managers and stakeholders, while managers have the ability to manipulate earnings and focus on their benefit instead of scoring shareholders’ goals. This study investigates how the characteristics of AC, specifically size, independence, and meetings, affect FIQ. The analysis is conducted in a specific context: non-financial firms in SA and UAE listed companies that operate in SA and UAE states throughout the period from 2016 to 2021. We fill a gap in the scarcely available literature by directly investigating how some AC variables affect FIQ in that firm. In addition, the originality of our research is justified by the scarcity of previous studies that have addressed the relationship between AC characteristics and EM, especially with the use of more control variables such as political connections, agency costs, and board compensation.
Although this study adds to the body of accounting knowledge and practice, it faces several obstacles, particularly in light of the QFI requirements that businesses in the Gulf Cooperation Council (GCC) region must meet. Due to limited data availability, the scope of this analysis is restricted to companies listed on the SA and UAE stock markets.
This study contributes to the ongoing debate regarding the impact of AC variables on EM. Firstborns represent a novelty in the literature on the ACs and EM of listed companies in SA and the UAE. Second, we demonstrate that internal audit quality proxies by AC characteristics play a vital role in ensuring that fundamental internal controls related to financial, operational, and compliance activities operate effectively. This role includes validating the effectiveness of AC-related controls and activities to reduce earnings management.
This study yielded significant practical and theoretical results. From a pragmatic standpoint, stakeholders have the opportunity to utilize these implications to tackle the makeup of an advisory committee (AC) with distinct attributes and to enforce the establishment of a self-directed and engaged AC. By doing so, they can facilitate the development of AC members’ capacities as a means of self-improvement, thereby safeguarding them from the potentially exploitative actions of managers. Albitar et al. (2023) aim to enhance the understanding of creditors and investors regarding the significance of earnings management manipulation and corporate governance systems.
The findings of this study are significant for several stakeholders including investors, accounting professionals, owners, and policymakers. This is because they offer a beneficial framework for evaluating and enhancing AC characteristics associated with its functioning. The results of this study support the notion that accounting conservatism (AC) impacts financial information quality, as shown in prior research. This assertion was substantiated by the findings of this study. To provide a scholarly contribution to the existing body of literature on AC, this study focuses on examining specific characteristics rather than emphasizing their fundamental contributions, a perspective that has been relatively unexplored in previous studies. Ultimately, the outcomes of this study have the potential to be valuable to other organizations’ inquiries and make a meaningful contribution to the growing corpus of knowledge regarding financial reporting practices in emerging economies. Research conducted in nations with economic conditions comparable to SA and the UAE could potentially use the outcomes of this study as a benchmark reference.
Limitations and Future Suggestions
In addition to acknowledging the significance of the present study, it is essential to recognize certain shortcomings that can be addressed by future research endeavors, as outlined below. The present study examined the effects of audit committee (AC) size, independence, and meetings on earnings management, as perceived by decision-makers. To enhance the validity of future research, it is recommended that alternative measures be employed, such as the development of a self-constructed index that spans a longer period to assess ACIND and competence. This approach would help mitigate the potential bias and subjectivity arising from investors’ perceptions of AC. It is imperative to acknowledge that these constraints do not impinge on the results; nonetheless, further investigations may encompass additional features pertaining to the audit committee, such as expertise in audit committee (AC) matters or the duration of AC tenure. Although earnings management is a broad concept, this study uses discretionary accruals as a proxy for earnings management, following Nelwan and Tansuria (2019) and Kapkiyai et al. (2020). Future studies could apply other proxies as indicators of earnings management, such as real earnings management. Furthermore, this study focuses exclusively on a limited time frame spanning 6 years, specifically from 2016 to 2021. Therefore, future studies should include a larger number of years. The research design employed in this study had certain methodological limitations. Specifically, the dataset used was restricted to a subset of GCC countries, which may restrict the generalizability of the findings. Additionally, the econometric models used in the analysis may have introduced biases due to the omission of important variables.
Footnotes
Appendix 1
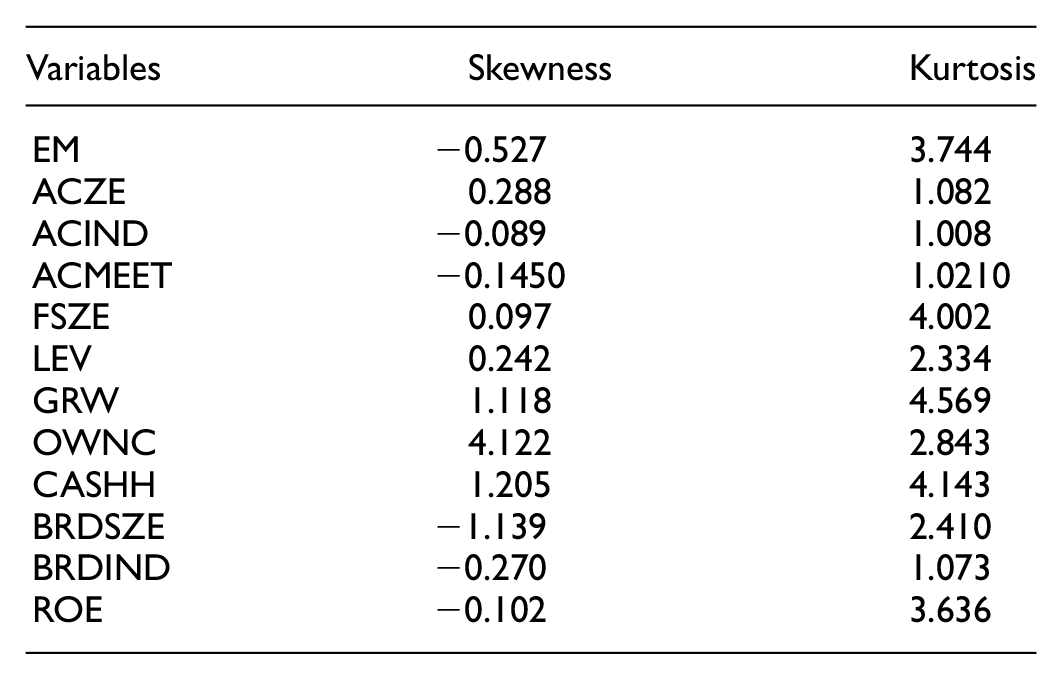
| Variables | Skewness | Kurtosis |
|---|---|---|
| EM | −0.527 | 3.744 |
| ACZE | 0.288 | 1.082 |
| ACIND | −0.089 | 1.008 |
| ACMEET | −0.1450 | 1.0210 |
| FSZE | 0.097 | 4.002 |
| LEV | 0.242 | 2.334 |
| GRW | 1.118 | 4.569 |
| OWNC | 4.122 | 2.843 |
| CASHH | 1.205 | 4.143 |
| BRDSZE | −1.139 | 2.410 |
| BRDIND | −0.270 | 1.073 |
| ROE | −0.102 | 3.636 |
Funding
The author(s) received no financial support for the research, authorship, and/or publication of this article.
Declaration of Conflicting Interests
The author(s) declared no potential conflicts of interest with respect to the research, authorship, and/or publication of this article.
Data Availability Statement
Data sharing not applicable to this article as no datasets were generated or analyzed during the current study.