
Abstract
The purpose of this study was to consolidate machine learning applications and develop a method to simultaneously analyze unstructured text and images pertaining to travel and tourism. This paper extracted city-related tourist-generated content from social media posts and analyzed this content to elucidate public perception of Taipei and identify the factors that make these posts attractive. Amidst the global COVID-19 pandemic of the early 2020s, this study examines social media discourse on urban topics. Focused on the period from 2019 to 2020, it compares content to discern shifts in societal concerns amidst the pandemic’s progression. The analysis aims to illuminate evolving thematic patterns within city-related discussions against the backdrop of this unprecedented public health crisis. Several techniques and technologies, including content mining, Google Cloud Vision AI, topic modeling, and artificial intelligence machine learning were adopted to analyze the images and interactive characteristics of tourist-generated content relating to the city imagery and tourism transformation of Taipei. The data analyzed in this study was collected from Facebook, and RapidMiner was employed as the mining environment to apply topic modeling to identify the topics in tourist-generated content relating to Taipei before and during the pandemic and elucidate expectations and topic evolutions; and extract meaning images and text from the topics and combine them with interactive data from social media posts to identify the topics inductive to the public at different periods of the pandemic. The main graphic theme before the epidemic was to convey the charm of Taipei, compared to the graphic theme during the epidemic, which shifted to a nature-based image.
Introduction
The greatest challenge for the travel and tourism industry in 2020 was undeniably the outbreak of the COVID-19 pandemic. An analysis of the effects of the pandemic on travel revealed that the imposition of border restrictions by various countries in response to the pandemic between February and March of 2020 was the single most influential factor for international travel. In Taiwan, the successive implementation of lockdown policies worldwide drastically reduced the number of inbound passengers to 2,559. Of that number, only ten passengers arrived in Taiwan for the purpose of tourism, presenting a stark contrast to the almost 500,000 monthly international tourists before the pandemic. The impact of public health measures on Taiwan’s tourism industry is undeniable. Fortunately, the pandemic has gradually been brought under control in in Taiwan, and local tourism is showing signs of recovery. To further promote tourism and differentiate Taipei from other cities, the Taipei City Government introduced its worry-free travel initiative, offering a selection of quarantine hotels and tourism-centered discounts to tourists traveling independently or in groups. The purpose of these incentives is to help deepen tourists’ experiences and encourage them to visit Taipei.
New tourism and travel trends emerged in 2020 amidst the COVID-19 pandemic. A survey conducted by the World Trade and Tourism Council (WTTC) on pandemic travelers revealed that 92% trusted the recommendations of their family and friends. These findings coincided with the growing attention to tourist-generated content (TGC) on social media. Social media users post content containing cultural and city elements using images or text that are meaningful to them to showcase their travel experiences and city imagery. Unfortunately, current tools for measuring the online images of tourism cities (Papathanassis & Knolle, 2011; J. Zhang, 2018) lack academic and empirical support (Xu et al., 2023), and most text-based software is ill-equipped to process graphical data. Therefore, the purpose of this study was to consolidate machine learning applications and develop a method to simultaneously analyze unstructured text and images pertaining to travel and tourism.
Social media has become an indispensable part of everyday life. City governments take advantage of social media to interact with the public and promote their cities. However, few studies on the communicative traits of social media have focused on the thematic preferences of social media users during the pandemic or on the effective exchange of social media content. To fill this knowledge gap, this paper extracted city-related TGC from social media posts and analyzed this content to elucidate public perception of Taipei City and identify the factors that make these posts attractive.
Several techniques and technologies, including content mining, Google Cloud Vision AI, topic modeling, and AI machine learning were adopted to analyze the images and interactive characteristics of TGC relating to the city imagery and tourism transformation of Taipei City. The data analyzed in this study was collected from Facebook, and RapidMiner was employed as the mining environment.
The objectives were to apply topic modeling to identify the topics in TGC relating to Taipei City before and during the pandemic and elucidate expectations and topic evolutions; and extract meaning images and text from the topics and combine them with interactive data from social media posts to identify the topics inductive to the public at different periods of the pandemic.
This paper attempted to capture the value dimensions of cities, elucidate how the public interprets and interacts with city images, and investigate how people’s perception of city images is shaped by textual and graphical cues on social media. The term “city image” discussed in this study refers to the textual and graphical TGC on social media. This paper applied this term to deduce how users subjectively interact with one another. A comprehensive algorithm was developed to analyze the interactivity of city-related social media information and construct different topic models. More specifically, this study identified the representative independent variables of the text and image sets. These sets were adopted inputs for function selection and sorting. The results were combined with the text and image content to estimate the city-related TGC characteristics in each condition class. Finally, the aggregated content variables of the text and images were used to highlight valuable city-related posts.
This study examined pre-pandemic and peri-pandemic social media posts to elucidate how social media satisfies user needs and how users use TGC to satisfy their information needs. It applied the findings of this paper to develop a post-pandemic city promotion strategy for Taipei City that encourages collaboration between city promoters and social media users. This study is structured as follows. Section “Literature” briefly discusses existing literature on cities and travel expectations, past viral outbreaks, city image analysis and TGC, and topic analysis and latent Dirichlet allocation (LDA), city-related cues that frequently appear in pre-pandemic and peri-pandemic social media posts and several hypotheses on the effects of these cues on post interactivity. The hypotheses were applied to assess the impact of topical cues on engagement. Section “Methods” discusses the research process and methodology. Section “Results” presents the data analysis results and presents the results and several recommendations for city-related social media content.
Literature
Expectations of Cities and Pandemic Studies
Smart cities have been developing globally, but because studying them involves multiple disciplines, understanding and describing them holistically is difficult. Lim et al. (2021) conducted a study providing a comprehensive overview of smart city literature (Lim et al., 2021). Their findings demonstrate the latest research developments, provide a common foundation for understanding smart cities from a multidisciplinary perspective, and facilitate further research and development.
Technologies such as artificial intelligence (AI) and the Internet of Things have the potential to transform cities into more sustainable smart cities. Herath et al. (2022) discuss the application of AI in smart cities, including in key areas like healthcare, education, environmental and waste management, mobility and smart transportation, agriculture, risk management, and security (Herath & Mittal, 2022). The integration of AI into smart cities can be beneficial by automating operations, reducing human error, making decisions based on valid data, and improving the environment through different systems. This helps create new business opportunities and allows for more efficient city management through automation (Gonzalez et al., 2021).
Urban agglomerations are becoming centers of social, economic, cultural, and artistic activities, and a United Nations report predicts that 68% of the world’s population will live in cities by 2050. In the study by Lim et al. (2021), they explore a case study applying Twitter text mining in a smart city: Quito, the capital of Ecuador. Local governments can use information and communication technologies (ICT) in such ways to collect data via social networking and social mining, which allows for analysis of residents’ opinions and reactions to government actions and thus helps governments make more informed decisions and policies (Lim et al., 2021).
Expectation theory details how people unintentionally form experiences and perceptions and how they apply these experiences and perceptions to process future knowledge and beliefs. When people lack personal experiences, they tend to form expectations to minimize the risk attached to information sources, such as comments or responses posted by their friends (Hsu & Song, 2014). In the absence of personal information, information from the government or travel and tourism vendors can be used to evaluate travel expectations. Expectation refers to an anticipatory process of future or unfinished events. It can be positive or negative and be both rational (a certain outcome may be achieved) and emotional (hope or fear). Previous studies on travel expectations largely focused on expectation fulfillment and the role of expectation in satisfaction psychology (Nath et al., 2016; C. Wang et al., 2016). Therefore, assessing people’s attitudes can uncover their expectations of the city.
In expectations models, attitude is governed by the probability that the subject demonstrates specific subjective traits, and the subject’s overall attitude reflects the relative strength of these traits and can consequently be measured based on the subject’s overall attitude. Therefore, it can be said that expectation is a determinant of subjective attitude. Travelers generally have limited knowledge of the city they are visiting, particularly those they have not yet visited. Therefore, travelers’ attitudes, regardless of correctness, often mediate their revisit intentions. For example, electronic word-of-mouth (eWOM) reflects subjective norms, perceived influence, and behavioral control and positive reviews can change people’s attitudes and expectations. The theory of planned behavior states that when travelers post pictures of their travels, expectations are formed from specific beliefs, and these expectations reflect the traveler’s ideal city imagery. When people learn about a tourism city, they form a subjective city image and expectations (Crump et al., 2023), including traffic conditions around attractions, services and conveniences (McKercher, 2016), cultures, places they want to visit (H. Kim & Chen, 2019; Kruger et al., 2013), affordable products or services (Xie et al., 2016), restaurants and local cuisines (J. Kim & Fesenmaier, 2017), and travel protection and risks (Tasci, 2016).
Liang et al. (2019) examined Ebola-related Twitter feeds in 2019 and modeled the trajectories of Ebola-related messages (Liang et al., 2019). The researchers concluded that community spread and transmission were the most discussed topics on Twitter. Fung et al. (2014) randomly sampled Tweets relating to the Ebola outbreak and found that most of the Tweets originated from the United States, even though the outbreaks primarily occurred in countries with limited Internet access, such as Guinea, Liberia, and Sierra Leone (Fung et al., 2014). Subsequently, most of the Tweets were negative and angry, leading to high levels of anxiety associated with the Ebola virus. Fu et al. (2016) analyzed Ebola-related Tweets by the Centers for Disease Control and Prevention (CDCUSA), World Health Organization (WHO), and Médecins Sans Frontières (MSF) and concluded that Twitter is a useful platform for engaging in meaningful discussions, suggesting that public health authorities can take advantage of social media to spread correct information and combat misinformation (Fu et al., 2016). The researchers suggested that Twitter can take advantage of its platform to provide accurate information about the disease to reduce fear and anxiety in unrelated regions.
Vijaykumar et al. (2018) analyzed Zika-related Tweets and found that among 12 topics, the spread of the Zika virus was the most discussed topic on Twitter (Vijaykumar et al., 2018). Pruss et al. (2019) built tweet corpora in three languages (Spanish, Portuguese, and English). The corpora were then used to construct a multilingual model for identifying key topics across multiple languages. The researchers found that the outbreak of the Zika virus was discussed differently worldwide and that the topics were distributed differently across the three languages (Pruss et al., 2019). In cognitive linguistics, especially in the study of metaphors, public discourse is often analyzed with different figurative and literal frames. Metaphors are often used to discuss different aspects of diseases, such as their treatments, outbreaks, and symptoms. Metaphors are particularly powerful in framing health-related discourse, and they have been shown to affect the overall health of patients (Entman, 1993).
Government-enforced social distancing has spurred Internet users to use social media to express their concerns, opinions, beliefs, and views of reality. On Twitter, tweets containing the hashtags #coronavirus, #COVID-19, or #COVID have exploded. Recently, researchers are mining tweets to gain a better understanding of the discussions surrounding the Zika virus. Miller et al. (2017) combined natural language processing and machine learning techniques to analyze topic distributions associated with four characteristics of the Zika virus: symptoms, transmission, prevention, and treatment (Miller et al., 2017).
Image Analysis and City-Related TGC
Deng et al. (2019) conducted a two-stage destination image (DI) analysis, which included a qualitative state for providing relevant structures (attributes) and a quantitative stage to measure these structures (Deng et al., 2019). Compared to text, images have a greater impact on human memory. Therefore, photos are a powerful medium for destination professionals. They are visual cues shared between experienced and inexperienced people. They reflect what people experience at a destination. Therefore, they are a product of people’s travel experiences (Hunter, 2016). Content included or omitted from photos has the power to shape people’s perceptions. Early studies that used photos and visual content to analyze DIs mainly focused on one or several destinations. Those that adopted qualitative approaches to analyze unstructured data were extremely time-, resource-, and labor-intensive (Xiao et al., 2022). In recent years, the emergence of online platforms and digital technologies has led to the explosion of digital content. This content, also referred to as big data, can be analyzed using statistical analysis and machine learning technologies. The prevalence of the Internet has led to the study of TGC, which is defined as photos or static visual content of travel and tourism created and shared by people over the Internet.
People share their travel experiences online through social media (Taecharungroj & Mathayomchan, 2019), leading to the rapid accumulation of text, images, and videos online (Mak, 2017). Deng and Li (2018) asserted that TGC had become a more reliable source of video content than that produced by destination management/marketing organizations (DMO) (Deng & Li, 2018). Therefore, TGC-related studies have exploded in popularity in recent years. Social media data provide a new way to understand DI (Z. Zhao et al., 2018). TGC refers to destination-related content posted by Internet users voluntarily that influences other users. Compared to DMO content, TGC, which is typically user-centered, is more reliable, and previous studies have found that TGC, including social media posts (Y. Zhao et al., 2019) and online discussions (M. T. Liu et al., 2021), more accurately represents DIs than DMO content.
Compared with traditional sociological techniques, analyzing social media content is a new and cost-effective way of studying image perceptions. By examining and sorting photo content, researchers can identify the traits, similarities, and differences of different cities. Salesses et al. (2013) examined thousands of geotagged photos of New York, Boston, Linz, and Salzburg to compare the safety and unique characteristics of these cities (Salesses et al., 2013). Liu et al. (2016) applied a deep learning technique to sort photos posted on Flickr. The researchers then conducted a statistical analysis of the images of seven classic cities to determine their city images (L. Liu et al., 2016). Long and Zhou (2017) analyzed the metadata of photos of 24 Chinese cities posted on Flickr to determine their traits and similarities (Long & Zhou, 2017). Flicker is one of the most popular photo storage platforms. Many recent studies have examined the content of Flickr for a variety of reasons, including analyzing people’s emotions in different cities (Ashkezari-Toussi et al., 2019), classifying events in different cities (Clarke & Hassanien, 2020), and examining travel and tourism activities (Nechita et al., 2019).
Zhou et al. (2018) surveyed 10 US cities and found that despite 3 to 8 times as many tourists as residents, residents contribute more photos than tourists on average (Zhou et al., 2018). Yuan and Medel (2016) combined Google Cloud Vision AI and LDA to convert visual information into textual information (tags; (H. Yuan et al., 2018)). LDA results showed that in 12 countries, 85% of DIs taken were by residents (Y. Yuan & Medel, 2016). The survey suggested that Flickr users were a mix of tourist and citizens.Taecharungroj and Mathayomchan (2020) was the first study to combine Vision AI and topic modeling to research cities (Taecharungroj, 2019; Taecharungroj & Mathayomchan, 2020). Previous studies on DIs found that users of Flickr prefer to upload images of popular landmarks or city centers and show increased interest in cultural and entertainment destinations.
Topic Analysis and Latent Dirichlet Allocation
With services supporting digital platforms having more and more access to big data, the importance of text mining for business management is clear. Kumar et al. (2021) analyzed the use of text mining methods such as sentiment analysis, topic modeling, and natural language processing in reputed business management journals (Kumar et al., 2021). They then used text mining and topic association analysis, applying visualization tools to understand major research themes and relevance. The findings highlight that topics including social media analysis, market analysis, and competitive intelligence dominate the research on text mining in business management.
Social Media Analytics (SMA) has become an important tool for organizations to gain insights and improve performance and productivity in various areas. However, the field of SMA is becoming increasingly diverse and thus benefits from a comprehensive understanding of its trends and approaches. Rathore et al. (2017) provide a thorough review of the empirical evidence and future research directions in SMA, focusing on applications across domains, including industry, data mining, use cases, and user applications (Rathore et al., 2017). In the studies reviewed, public administration and non-essential consumer sectors are the main areas of application, with Twitter data being the most commonly used source for analysis and categorization techniques and regression models being the most popular analytic methods used.
Stone et al. (2021) explored the relationship between the gender of leadership and social media communication styles (Stone & Can, 2021). The study examined gender language differences in the Twitter feeds of the 100 most populous cities in the United States, with the goal of assessing whether mayors’ tweeting styles conformed to those recognized gender language differences. The influence of a council’s gender composition on tweeting style was also examined, and an awareness of gender differences helped mayors and their teams produce messages for different audiences.
The application of big data analysis in tourism management research is on the rise (Law et al., 2020). However, most studies focus on applying existing methods to TGC (Chang et al., 2020). Many studies have contributed to academia by introducing unique approaches and models, such as sentiment analysis (Geetha et al., 2017), topic modeling (Guo et al., 2017), and clustering and classification (Morosan & DeFranco, 2019). Despite the immense potential of photos, a major limitation of content analysis is the need for the manual formulation of categories and attributes, which renders content analysis ineffective for analyzing vast amounts of images. In recent years, scholars have applied machine learning to the analysis of big data. For example, J. Zhang (2018) applied topic modeling and LDA to identify destination attributes from travel blogs. LDA was used to extract, identify, and analyze the attributes of hotels (H. Zhang et al., 2018).
A review of existing literature on the analysis of city imagery through online text revealed that most studies focused on the calculation and measurement of city imagery (Chan et al., 2021), testing city imagery theories (Priporas et al., 2020), and the analysis and measurement of city imagery cases (Li et al., 2015). Most of these studies used word processing software to process the city-related text and applied the results to determine the relationships between various word frequencies and city imagery. In recent years, many image-related studies have turned to social media to collect data and examine the value of image connections on social media (Mariani et al., 2016; Molinillo et al., 2018). For example, Munar et al. (2014) collected data from TripAdvisor and Flickr to determine the interactive relationships between temporal structure, scope of communication, social value, and content richness (Munar & Jacobsen, 2014).
In terms of methodology, topic modeling has been combined with a number of natural language processors to analyze user-generated online contributions (Chaudhari & Thakkar, 2020), travel recommendation systems (Nitu et al., 2021), and destination similarities (J. Kim et al., 2017). Rahmani et al. (2018) applied topic modeling to analyze user-generated long-form travel content and determine traveler experiences. The researchers also combined topic modeling and exploratory analysis to test theories related to the phenomenology of tourism experience (Rahmani et al., 2018).
In addition to analyzing cities, LDA has been used to analyze modeled topics. For example, Ilyas et al. (2020) examined Brexit-related tweets and discovered a link between Brexit sentiment and the GBP exchange rate (Ilyas et al., 2020). H. Zhang et al. (2018) used topic modeling to mine tweets and elucidate consumers’ attitudes toward vaccines (H. Zhang et al., 2018). Doogan et al. (2020) applied LDA to explain public perception of nonpharmaceutical interventions (NPIs) for COVID-19. The researchers highlighted keyword problems corresponding to the topics of six countries. The results served as a reference for the formulation of NPI strategies (Doogan et al., 2020). LDA topic modeling has also been used to examine Twitter users, identify product features, and quantify various topics (Jeong et al., 2019). Opinion searches are a mechanism for social media operators to collect user views and feedback on specific issues.
Methods
The focus of this study was to analyze the image elements of Taipei City before and during the pandemic. The data analyzed in this paper was derived from Facebook. Relevant data on city images were collected based on Facebook hashtags, posts, and user information. This study retrieved the TGC using Python API. Big data mining is a technique that can minimize repetitive mining (Sohrabi & Barforoush, 2012), ensure the consistency of mined content (Anwar & Abulaish, 2014), produce technical frameworks for network interaction, and articulate user interaction models (Pachidi et al., 2014). Crowd data analysis, clickstream analysis, and classification analysis are the three most popular forms of data mining. This paper combined topic modeling and multiple linear regression (Figure 1).
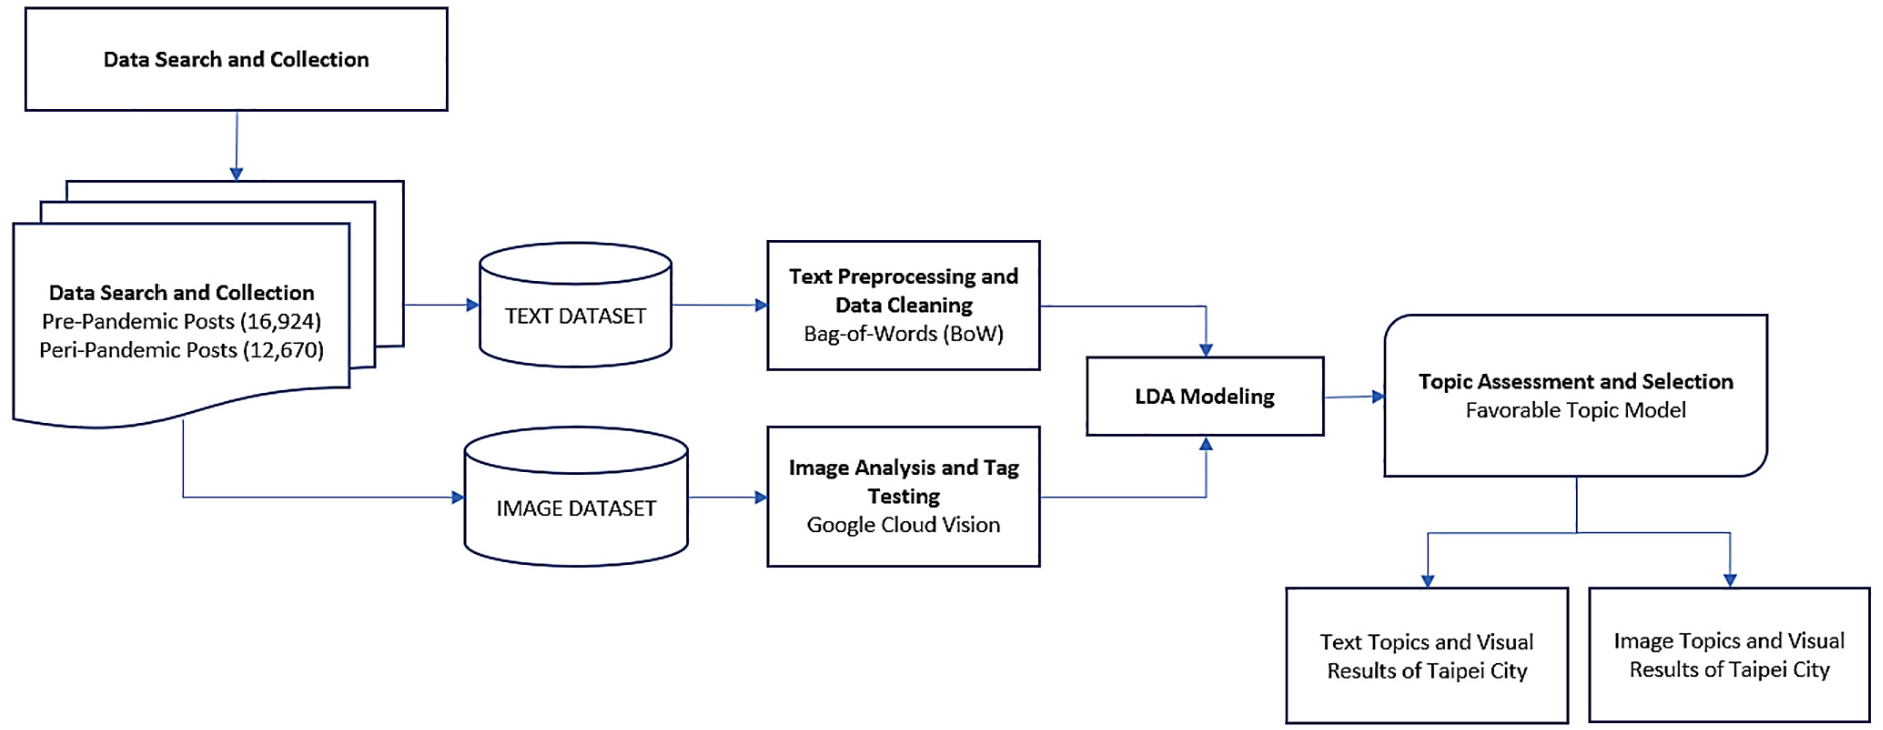
Data analysis flow chart.
Data Search and Collection
The onset of the 21st century witnessed the emergence of a profound global health crisis with the rapid proliferation of COVID-19, transforming it into a pervasive pandemic of unprecedented scale. Originating in late 2019, the contagion swiftly traversed international borders, catalyzing a formidable challenge to public health infrastructure and societal resilience worldwide. Notably, by January 13, 2020, the epidemic had disseminated across contiguous territories, including Thailand, Japan, and Korea, underscoring the relentless transnational transmission dynamics of the pathogen.
This research endeavors to delineate temporal differentials in the thematic composition of urban-centric discourse within the domain of social media against the backdrop of the COVID-19 pandemic. With the delineation of the temporal demarcation at the threshold of 2020, a comparative analysis is conducted on the content of social media posts spanning the temporal expanse of 2019 and 2020. The objective therein is to discern and evaluate the presence of discernible disparities in the thematic constituents of city-related discourse between the aforementioned temporal epochs, thereby elucidating potential shifts in societal preoccupations and concerns engendered by the exigencies of the prevailing public health crisis.
In this study, it analyzed users’ Facebook posts relating to Taipei City during the peak of the COVID-19 pandemic between 2019 and 2020. The first step was to search for relevant posts using hashtags. We used RapidMiner to search for these posts. This paper, therefore, used Python to collect post data associated with #Taipei (Lehmann et al., 2012). This study sorted the collected data based on content, type, time, likes, shares, and comments. A total of 29,594 posts (pre-pandemic 16,924, Peri-pandemic 12,670) associated with the image uploaded between 1 January 2019 and 31 December 2020 were collected. All of the data was saved as .csv files.
Text Preprocessing and Data Cleaning
The raw data collected from Facebook were preprocessed using RapidMiner. The data underwent two levels of preprocessing: preparation and preprocessing. First, the raw data of the Excel file were imported into RapidMiner for extraction, conversion, and loading. The standard operators used in this process included “Select Attributes,”“Text in Name,” and “Process Data in File.” After the data was prepared, they were converted to files for subsequent processing. The subsequent preprocessing procedures were tokenization, case conversion, stopword removal, and stemming.
To ensure the validity of the input data, the next step was cleaning the data, which involves several steps. The first step was removing all non-English text. Next, all duplicated content was omitted. Then, post formatting was adjusted and converted into a bag-of-words (BoW) corpus. Finally, words with no semantic meaning, such as “the,”“is,” and “on,” were omitted to improve data quality. In addition, the content was automatically deleted if it did not contain the words “Taipei” or “Taipei City.”
Image Analysis and Tag Testing
Google Cloud Vision AI was employed to extract feature tags from every image and facilitate image analysis. It has been used in many recent studies for image analysis (Hosseini et al., 2017). Google Cloud Vision API allows developers to encapsulate machine learning in a REST API for data extraction. Therefore, it can be used for image classification, object detection, and word recognition. Google Cloud Vision API is able to analyze uploaded images and image sets stored using Google’s cloud services through Jumptuit, automatically detect figurative elements, such as people and objects, in images or video, and categorize the data in learned databases. Next, this paper carried out tag detection, in which objects and features were extracted from the images. This study set the maximum and minimum tag count per image to 10 and 0. Using these parameters, it collected traditional/classic images from TGC and their element features (Galí et al., 2017).
LDA Modeling
In RapidMiner, topic modeling was achieved using the Operator Toolbox extension. The LDA method was employed to detect hidden topics. Because topic modeling is a form of unsupervised learning, all data were preprocessed before grouping. The topics were then grouped into meaningful topics after topic annotation, in which each image was allocated to the most probable topic. Each topic was composed of tags of varying degrees of relevance, with the most relevant tags for each topic displayed and used for topic naming. LDA is a highly efficient, unsupervised machine learning algorithm (Y. Wang & Taylor, 2019) that can be applied to carry out a number of research objectives (Taecharungroj & Mathayomchan, 2020). LDA is a three-level hierarchical Bayesian probability model, in which images and text are assigned a probability distribution topic, and each topic represents a probability distribution keyword (or tag).
import pandas as pd from sklearn.feature_extraction.text import CountVectorizer from sklearn.decomposition import LatentDirichletAllocation data = pd.read_csv('facebook_posts.csv') documents = data['message'].tolist() vectorizer = CountVectorizer() X = vectorizer.fit_transform(documents) lda = LatentDirichletAllocation(n_components=n_topics) lda.fit(X) feature_names = vectorizer.get_feature_names() for topic_idx, topic in enumerate(lda.components_): print("Topic %d:" % (topic_idx + 1)) print(" ".join([feature_names[i] for i in topic.argsort()[:-10 - 1:-1]])) print() new_post = "This is a new post about technology and social media" new_post_vectorized = vectorizer.transform([new_post]) new_post_topic = lda.transform(new_post_vectorized) print("New Post Topic:", new_post_topic.argmax() + 1)
Alpha (α) and beta (β) are corpus-level hyperparameters that are sampled once in the process. A smaller α-value represents fewer topics per image, while a smaller β-value represents fewer tags per topic. The α-value and β-value were set at .1 and .001 (Subeno et al., 2018). Theta (θ) is a document-level (photo-level) variable that refers to the probability of certain topics appearing in an image (where the combined probability is equal to 1). After LDA modeling, KNIME can be applied to assign the most probable topic to each image and sort images into topics that help to depict city compositions. Z and w are word-level (tag-level) variables for each photo, where w is the tag and Z is the topic assigned to it. Every word in the document is assigned to a topic. This assignment is determined using conditional probability estimates. After determining the probability of each word, the words were assigned to different topics. Only words with a probability value equal to or greater than this threshold (min count = 5, threshold = 100) were assigned to a corresponding topic.
Topic Assessment and Selection
This study employed two methods for model evaluation. The first was manual evaluation, in which we analyzed the first Nth number of words in a topic. This method was also used to analyze words without topics. The second was the application of quantitative indices: perplexity and conformity. Perplexity is a measure for comparing probabilistic models. It represents the predictive power of the probabilistic model. Generally, a lower perplexity value (approximating 0) denotes a more favorable model function. By comparison, conformity is a measure of semantic similarity between words in a topic. The conformity value ranges between 0 and 1, where a higher conformity value denotes a more favorable topic model.
Previous studies have demonstrated the feasibility of machine learning and LDA in identifying topics from big data. To close the knowledge gap in DI research and highlight the potential of machine learning, this study introduced a consolidated method for analyzing TGC text and images. The topic models were probabilistic models that can be applied to the Bayesian hieratical analysis of raw text to determine the underlying semantic structures (Shafqat & Byun, 2020). In travel and tourism research (Lin et al., 2021), topic modeling is used to discover the abstract topics embedded in the text. These text and images are then used to determine relevance. The extracted destination text and images can be used in destination analysis or travel personalization/recommendation.
import pandas as pd from sklearn.feature_extraction.text import CountVectorizer from sklearn.decomposition import LatentDirichletAllocation data = pd.read_csv('facebook_posts.csv') aipei_data = data[data['message'].str.contains('Taipei')] documents = taipei_data['message'].tolist() vectorizer = CountVectorizer() X = vectorizer.fit_transform(documents) lda = LatentDirichletAllocation(n_components=n_topics) lda.fit(X) feature_names = vectorizer.get_feature_names() for topic_idx, topic in enumerate(lda.components_): print("Topic %d:" % (topic_idx + 1)) print(" ".join([feature_names[i] for i in topic.argsort()[:-10 - 1:-1]])) print() new_post = "This is a new post about Taipei city and its attractions" new_post_vectorized = vectorizer.transform([new_post]) new_post_topic = lda.transform(new_post_vectorized) print("New Post Topic:", new_post_topic.argmax() + 1) import pandas as pd from sklearn.feature_extraction.text import CountVectorizer from sklearn.decomposition import LatentDirichletAllocation import pyLDAvis.sklearn data = pd.read_csv('facebook_posts.csv') taipei_data = data[data['message'].str.contains('Taipei')] documents = taipei_data['message'].tolist() vectorizer = CountVectorizer() X = vectorizer.fit_transform(documents) lda = LatentDirichletAllocation(n_components=n_topics) lda.fit(X) pyLDAvis.enable_notebook() vis = pyLDAvis.sklearn.prepare(lda, X, vectorizer) pyLDAvis.display(vis)
Text Topics and Interactivity
Besides elucidating the co-occurrence of attractions, observing implicit semantic information contained in travel and tourism reviews undoubtedly helps to model correlations through different lenses. Attraction image is a message type. It reflects people’s impressions of certain attractions and can be categorized into several topics, including destination (beaches), environment (weather and public health), and experience (Ankarali & KÜLcÜ, 2020). Attractions have a strong correlation when they have similar texts. These texts can be found in travel and tourism reviews and blog posts. Therefore, a model can be developed to extract attraction text and delineate different semantic dimensions. Large amounts of unstructured TGC are generated on travel and tourism websites and social media platforms each day (Chang et al., 2020). These messages are extremely valuable to various city image stakeholders (Huang et al., 2021). However, there is simply too much TGC online for manual analysis (Filieri, 2016).
Image Topics and Interactivity
Adding images to text facilitates presentation. Taking advantage of the symbolic representations to concretize images fortifies the value of images in city dialogs (Hunter, 2016). Michaelidou et al. (2013) analyzed image data to elucidate people’s perceptual responses to city imagery (Michaelidou et al., 2013). Schroeder et al. (2015) compared online images generated by marketers in a city to verify the importance of image content to city marketing (Schroeder & Pennington-Gray, 2015). Social media sites provide a convenient platform (Lo & McKercher, 2015; Syed-Ahmad et al., 2013) for sharing, viewing, and responding to travel and tourism images (Vu et al., 2015). Today, social media sites provide functions to share images to multiple platforms (Hunter, 2016). In terms of examining image cues, Michaelidou et al. (2013) examined photos posted online to elucidate people’s perceptions of tourism city images. The researchers compared the images of the same city to verify perceptional differences (Michaelidou et al., 2013).
Results
Text Topics and Visual Results of Taipei City
In this study, it carried out topic modeling after data extraction and preparation using the pyLDAvis library. Using this library was the first step in the topic modeling process. It visualized different topics from an image comprising multiple circles. Each circle represented a topic. The distance between the circles represented the correlation between the topics, and the sizes of the circles represented the data size of the topic.
The results of this paper found that the textual topics before the pandemic were mostly related to city-related tourism (Table 1). The topics included “event,”“urban,”“recreation,”“tour,” and “hotel.” In particular, “breakfast,”“mall,”“temple,” and “architecture” were the most common textual elements. By comparison, the peri-pandemic textual topics shifted to nature-related tourism. Topics included “landscape,”“natural,”“plant,”“travel,” and “environment.” Keywords such as “happy,”“mountain,” and “groundcover” were used to attract users.
Pre-Pandemic Text Topic.
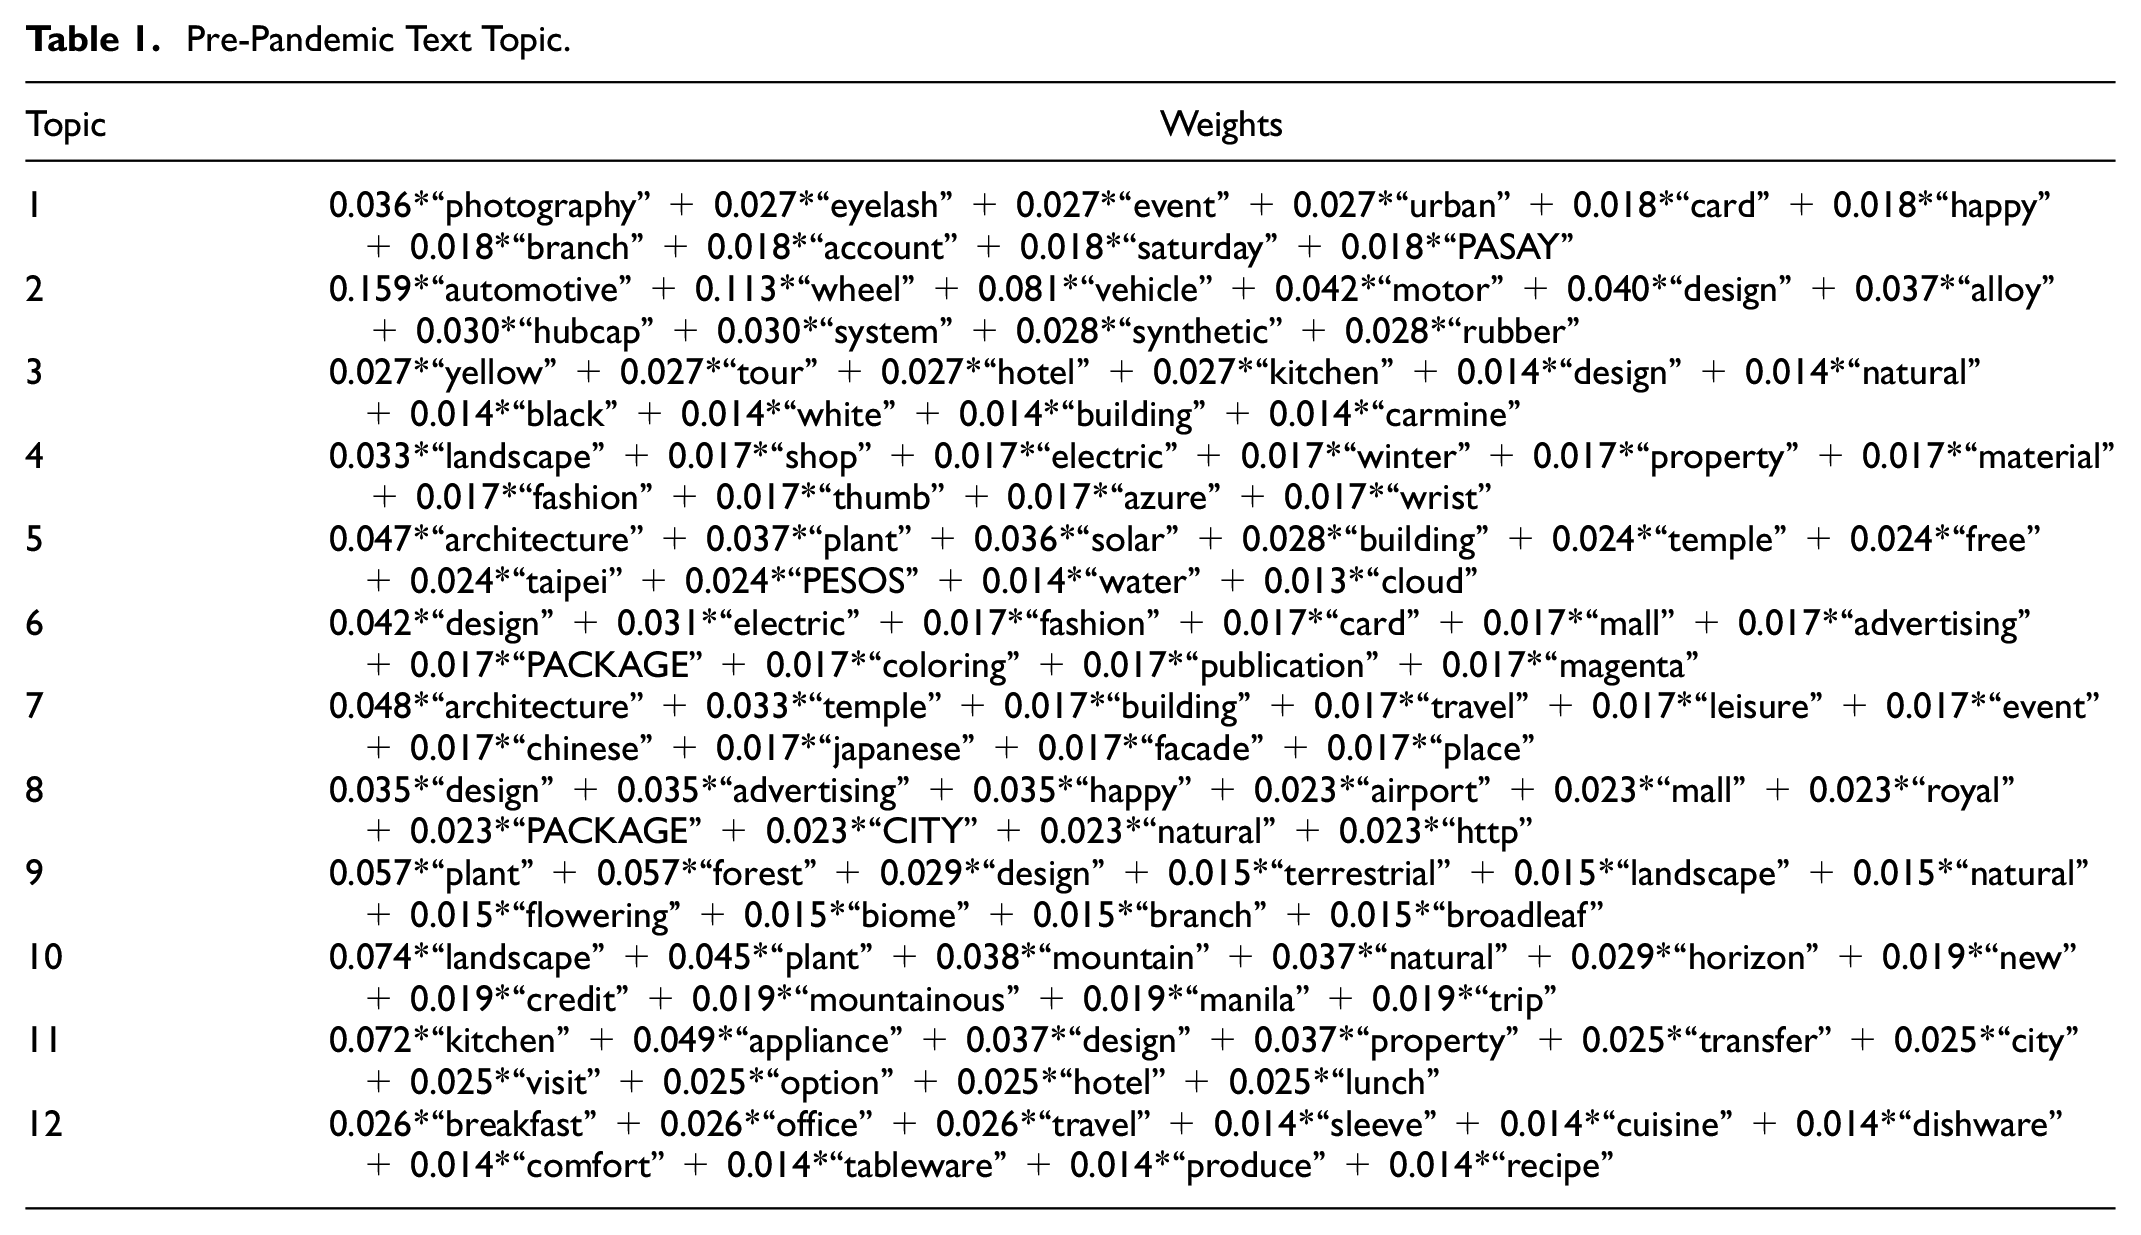
Pre-pandemic text topics in quadrant 1 are dominated by indoor travel keywords, such as “city,”“hotel,”“shop,”“leisure,”“landscape,” and “automotive,” and quadrant 2 includes topics like “mall” and “event” (Figure 2).
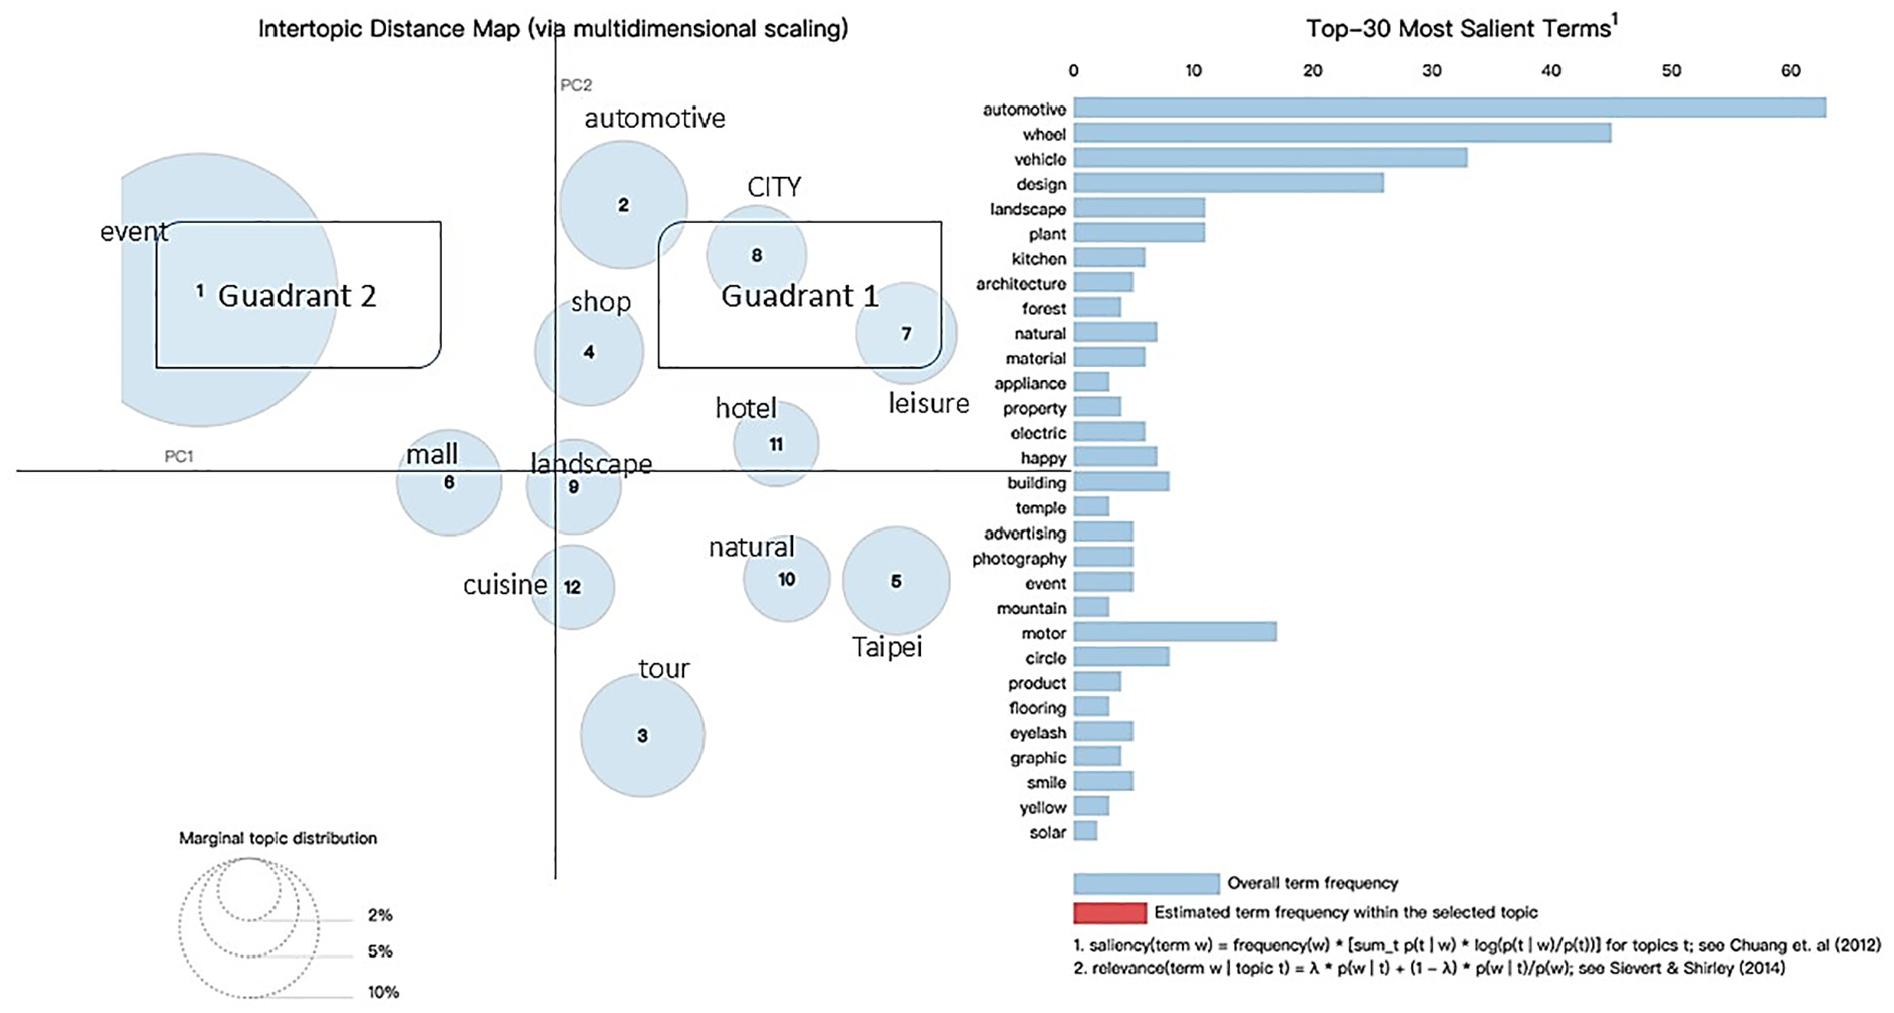
Pre-pandemic text topic.
Peri-pandemic, on the other hand, text topics in quadrant 1 include “landscape” and “natural,” while quadrant 4 includes outbound travel-related key themes of “travel,”“automobile,” and “recreation” (Figure 3).

Peri-pandemic text topic.
Image Topics and Visual Results of Taipei City
The results of this study showed that the main graphical topics before the pandemic were “service,”“brand,”“cuisine,”“fashion,” and “cityscape.” In particular, “design,”“luxury,”“landmark,” and “urban” were the most common images used to convey the charm of Taipei City (Table 2). By comparison, the peri-pandemic graphical topics shifted to “landscape,”“leisure,”“natural,”“nature,” and “tourism,” and images transitioned to more nature-based tourism images, such as “leisure,”“urban,”“plant,” and “ocean.” Images associated with independent travel, such as “vehicle,”“photography,” and “comfort,” also increased, suggesting that messaging shifted to destinations away from crowds.
Pre-Pandemic Image Topic.
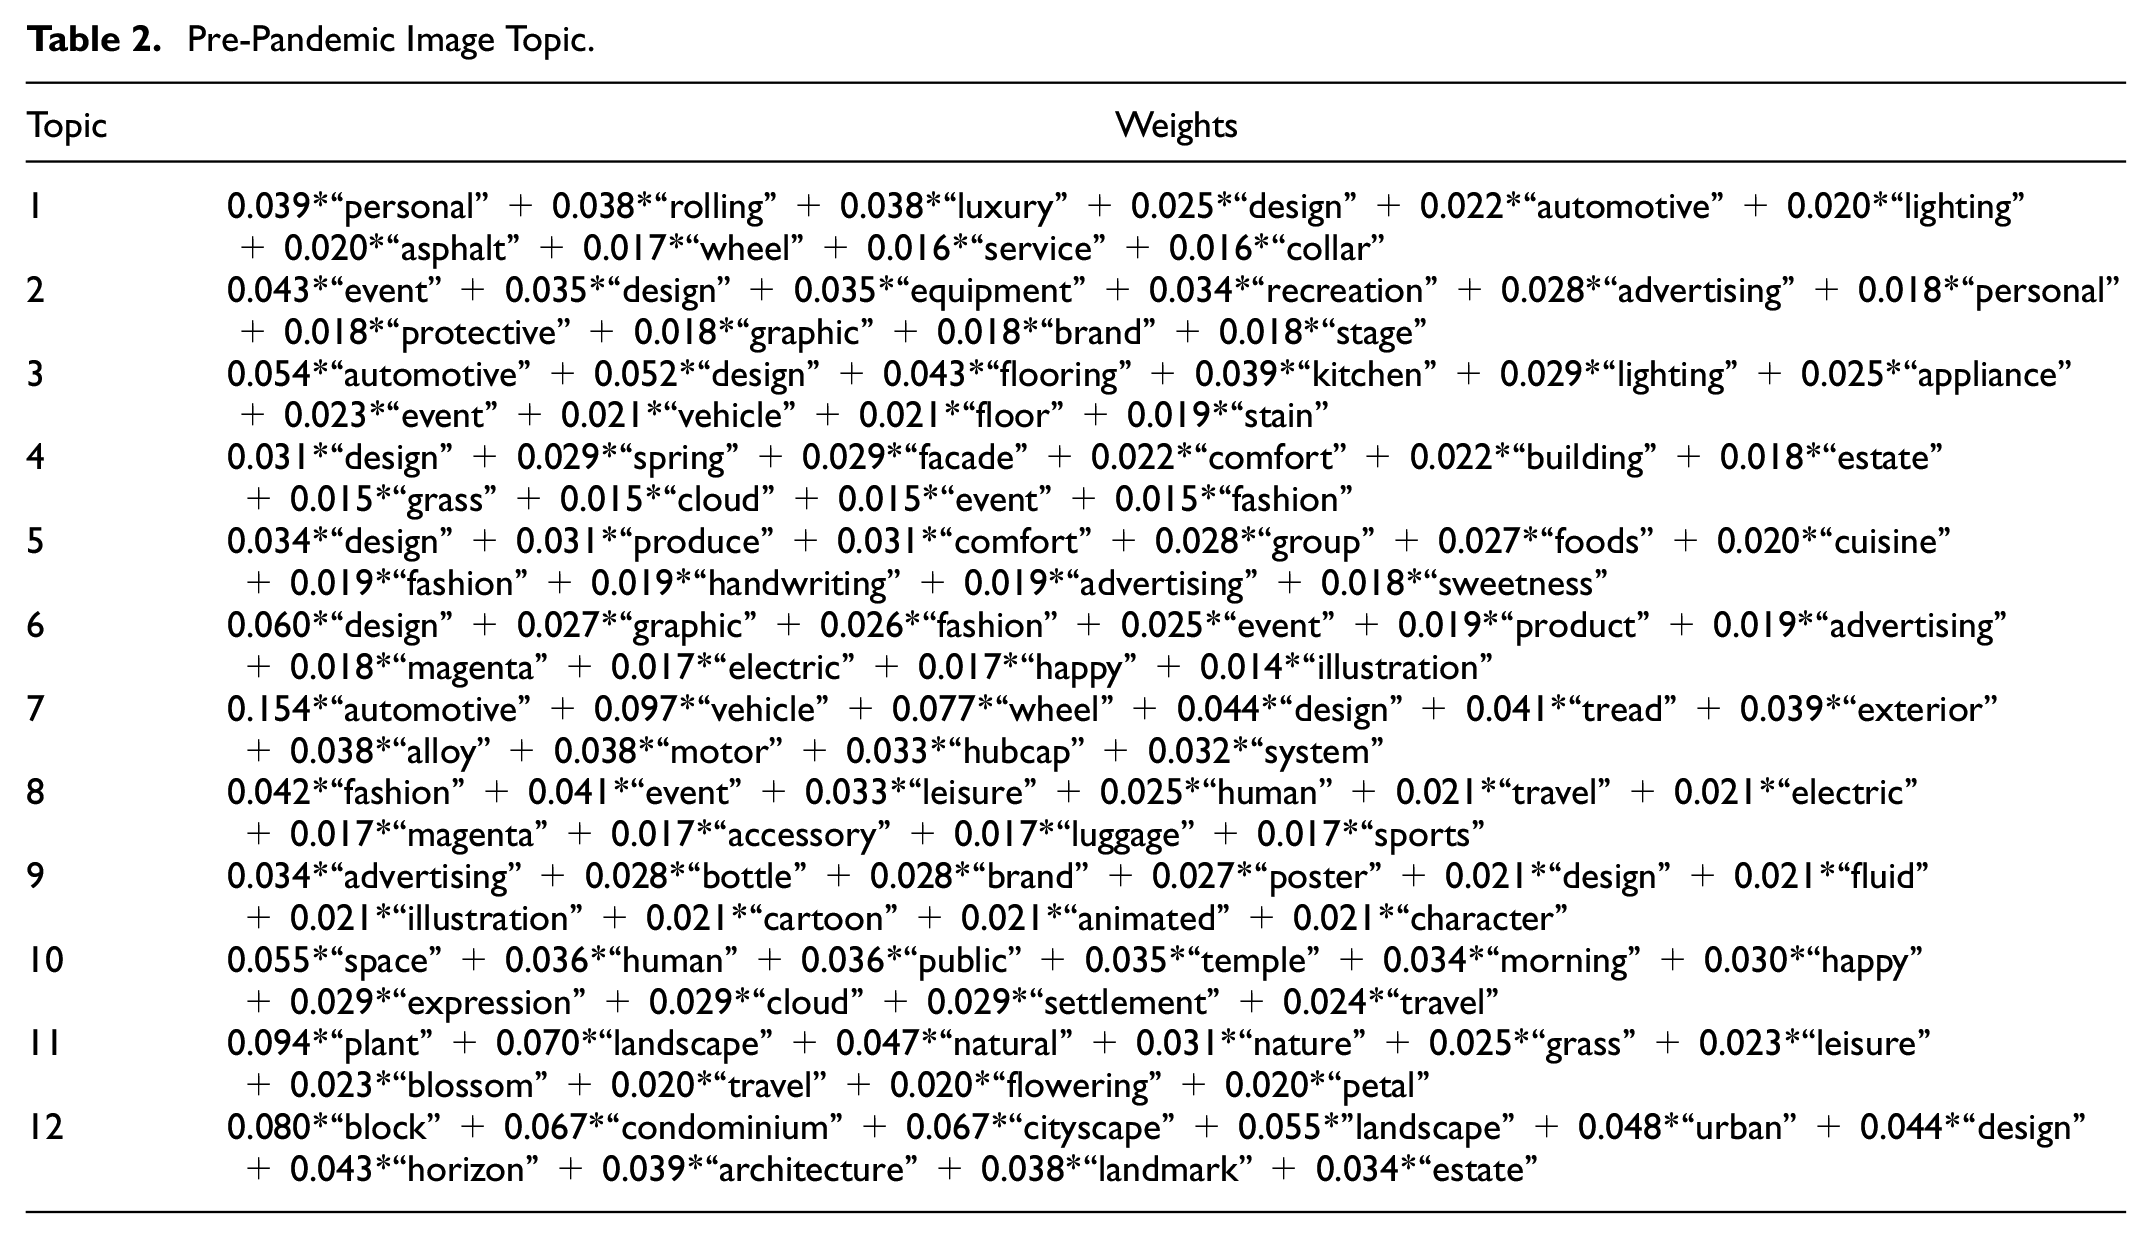
From the cross-quadrant topic grouping, it is obvious that pre-pandemic text topics are dominated by keywords associated with shopping or food, such as “luxury” and “advertising” in quadrant one and “fashion,”“estate,” and “cuisine” in quadrant two. Meanwhile, quadrant four contains words like “brand” and “cuisine” (Figure 4).

Pre-pandemic image topic.
Peri-pandemic, text topics in quadrant 1 include “landscape” and “comfort,” while quadrant 4 contains “nature” and “travel,” where key themes of “natural” and “brand” are more obvious (Figure 5).

Peri-pandemic text topic.
Discussion
LDA has been used in many previous studies on travel and tourism to examine various topics, such as hotels (Sutherland et al., 2020), restaurants (Jia, 2020), theme parks (Luo et al., 2020), national parks (J. Wang et al., 2021), and travel routes (Law et al., 2020). LDA was applied in their study to explore people’s perceptions and expectations of cities. TGC is online content produced through co-creation. It is dynamic, interactive, non-linear, and non-commercial. TGC takes many forms, including people’s comments and reviews (Storbacka et al., 2016), their interactions with others (Harrigan et al., 2017), and their collective experiences (Prebensen & Xie, 2017). TGC is likely to have varying degrees of influence on people’s perceptions of cities (Ferrer-Rosell et al., 2017).
In terms of the presentation of city imagery, image presentations are the most effective way to attract mass attention and elicit image perception and impression. Images freely transform personal experiences and help shape unique perceptions. Therefore, incorporating symbolic functions in images helps elicit perceptional responses from viewers. For potential viewers, social media images can increase familiarity and trust (Krumm et al., 2023). Therefore, carrying out visual analyses of city imagery can help managers determine the constructs of city image, including the textual and graphical dimensions or the abstract and figurative dimensions (H. Kim & Stepchenkova, 2015). Subsequently, managers can enhance message interactions by taking advantage of shares and comments on social media (Xu et al., 2023), content sharing (Stepchenkova & Zhan, 2013), and mass chats. However, city image is affected by people’s subjective perceptions. Al-Ghamdi et al. (2015) highlighted the importance of socioeconomic factors, such as customs, history, and urban functions, in city images (Al-Ghamdi & Al-Harigi, 2015). Fedorova (2016) asserted that city images contain visible/tangible perceptual elements and social and cultural meaning embedded in social activity (Fedorova, 2016).
User-generated city information not only conveys city images but also contains impressions of different individuals and groups and reflects the current social culture. Therefore, TGC is useful in projecting city image. It can also be used by marketers to engage in electronic word-of-mouth (eWOM) (Crump et al., 2023) and TGC marketing (Brown et al., 2019). Subsequently, the content of influencers can be consolidated to increase the exposure of city messages (Dunne & Hanrahan, 2017; Shankman, 2014). By consolidating the common ideas within the complementary framework of text and pictures, past researchers were able to create new city reflections from an originally ambiguous city image. The interactive generation of TGC has unintentionally become a diverse city culture. Therefore, it can be used to analyze the source of city image elements (Hunter, 2016; Mak, 2017).
Text Topics
According to the results of this study, forecast topics include “event,”“urban,”“recreation,”“tour,” and “hotel.” In particular, “breakfast,”“mall,”“temple,” and “architecture” were the most common textual elements. Studies that analyze online content are referred to as studies of city projection. Some studies report the sum of all visual attributes communicated by DMOs and other stakeholders. These projections are important because the visual and verbal messages in promotional materials represent destinations to potential visitors. Many recent studies have adopted content analysis methods to analyze various destinations, including those in Seoul (Hunter, 2016), Eastern Taiwan (Mak, 2017), and Zhangjiajie (Z. Zhao et al., 2018). Content analysis allows researchers to determine DI attributes from specific topics. This approach has been shown to help project topic concepts through visual elements (Deng et al., 2019).
City image is often used as an overarching term for a set of tangible resources and characteristics, including tourism infrastructure, landscape, cultural heritage, and local elements and features (Fernández-Cavia et al., 2017). This study found that peri-pandemic, text topics shifted towards nature-related tourism and included topics like “landscape,”“natural,”“plant,”“travel,” and “environment.” Keywords such as “happy,”“mountain,” and “groundcover” have been used to attract users, and weaving these elements into city identity can directly project an image of the city to the public (Mariné-Roig & Clavé, 2016; Marine-Roig & Ferrer-Rosell, 2018). Once city image is embedded in the minds of the public, the physical characteristics and resources of the city become cognitive information that helps promote the city to potential visitors (Xiao et al., 2022), consequently influencing people’s emotions and needs (Villamediana et al., 2019).
The composition of a city’s image is complex, diverse, and dynamic and cannot be explained by simply examining city constructs. For example, city culture is conveyed through everyday experiences (Allam & Newman, 2018). In this way, culture can be observed in all aspects of life, and experiences are affected by the shared attitudes of individual groups. Cultural identity is then formed through common symbols, text, and messages that contain shared beliefs, customs, and values. City culture can therefore be seen as the combination of art and experiences and represents the significance of culture to individuals and groups. Both functional and symbolic interpretations can create dialogs about culture. These processes are similar to how individuals contribute to the development of culture by participating in cultural events. Evaluating the individual properties of a city’s image thus helps researchers uncover what real factors affect a city’s image.
City image refers to individuals’ beliefs and impressions of a city, is co-created by city organizations and residents, and is formed by consolidating the knowledge, emotions, and perceptions of individuals (Xiao et al., 2022). Visual elements are useful for clearly projecting crucial components of city image; they maintain symbolic meaning and are an example of how the use of information can help present the complexities of a city’s image (Hunter, 2016). Visual elements thus significantly impact people’s travel decisions and satisfaction with a city. City identity and value can also be examined to measure community engagement. Previously, scholars used city identity and the creation of city value to determine city image. Researchers also found that community engagement had a significant impact on city image.
Image Topics
Social media provides a high level of spatial and temporal resolution in many urban centers. Through image analysis, this study determined that the main graphical topics before the pandemic were “service,”“brand,”“cuisine,”“fashion,” and “cityscape.” In particular, “design,”“luxury,”“landmark,” and “urban” were the most common image types used to convey the charm of Taipei City. Similarly, Hunter (2016) conducted a semiotic analysis of the cultural characteristics of Okinawa and Kinmen by classifying image characteristics into indices, icons, and symbols (Hunter, 2016). As photo sharing continues to rise in popularity, user responses will become increasingly useful in examining city image. Galí and Donaire (2015) also examined photos taken by social media users to identify their perceptions of tourism cities (Galí & Donaire, 2015), and Liesch (2011) found that both casual and professional photos can serve as windows into tourism imagery. The results of this study support the idea that visual analysis of city photos can effectively illustrate the dimensions of tourism cities’ online image (Liesch, 2011).
Peri-pandemic, graphical topics shifted to “landscape,”“leisure,”“natural,”“nature,” and “tourism,” and images transitioned to more nature-based tourism images, such as those associated with “leisure,”“urban,”“plant,” and “ocean.” Images connected to independent travel, such as “vehicle,”“photography,” and “comfort,” also became more common, suggesting that messaging shifted to destinations further away from crowds. The results confirm that city-related photos can be easily converted into visuals that attract user attention and promote city imagery. This is similar to how travelers convey their travel experiences through photographic records. In constructing these travel memories, important symbols form that can evoke a sense of urgency (Lim et al., 2021). Users often form a sense of familiarity with destinations when viewing photos on social media, and these feelings inspire a desire to visit. To captivate viewers and enhance sensory pleasure, photos are often accompanied by descriptive text. Lim et al. (2021) assert that people’s awareness of tourism cities and their motivation to visit these cities could be reinforced by presenting their reflections with images. Kar and Dwivedi (2020) suggested that travel agencies take advantage of photos and other visual aids to enhance the attractiveness of destinations and add to users’ pre-visit experiences (Kar & Dwivedi, 2020).
City photos and images help viewers form opinions of the city and affect their travel decisions. Photos are thus considered key to the success of travel and tourism imagery and messaging. Given that travel is a unique visual experience, photos can highlight destination features, convey travel messages, and help promote city image. City marketers have become accustomed to using photos to visually represent their cities and elicit desired responses. Visual imagery not only attracts potential audiences but also facilitates the promotion of tourism cities.
Post-Pandemic Recommendations
Data-driven research based on big data uses large datasets containing structured and unstructured data from different platforms, which presents challenges in the Information Systems (IS) field. Computational methods such as sentiment mining, text mining, web science, and graphical analysis are useful for gaining insights.
The COVID-19 pandemic has had a drastic impact on how people perceive cities globally (Graham-Harrison & Smith, 2020). Although the short- and long-term effects of the pandemic on city images have yet to be determined, Kravchenko (2020) predicted that the images of domestic cities would recover more quickly than those of international cities. TripAdvisor.com and other travel and tourism platforms reflect this assessment. A recent hotspot analysis revealed that traffic in lesser-known or less accessible destinations is increasing and that identifying destination topics can help strengthen destination image and status in a highly competitive market (Kravchenko, 2020).
Gössling (2020) mentioned that countries should not rush recovery. Instead, they should take the opportunity to transform their city images into sustainable ones (Gössling et al., 2020). City managers can focus on promoting the distinct features of lesser-known destinations to disperse traffic to more popular and crowded destinations. In this way, cities can capitalize on rising trends while maintaining social distance requirements. For example, the Tourism Authority of Thailand has been working hard to promote secondary destinations, diverting international and domestic travelers to 55 secondary provinces. These efforts help the Thai government identify and promote typical and desirable destination attributes (e.g., the ocean, structures, and cuisines) and divert traffic to secondary destinations.
The Taipei City Government has always focused on creating an inclusive and refined tourism environment that features friendly and high-quality hospitality professionals to attract local and international tourists. It has also designed itineraries that take advantage of local features and cultures to attract tourists. The launch of the worry-free travel initiative in response to the COVID-19 pandemic has greatly increased tourism activity in Taipei and fueled national domestic tourism. The unique situation created by the pandemic has allowed people to better understand local cultures, embrace local assets, and find value in local cities.
Limitations
Due to the limitations of the social media API, this study was only able to collect data within a specific timeframe. Subsequently, the data may have been dominated or affected by viral topics. To strengthen data integrity, it carried out cross-comparisons over an extended period to verify the universality of the proposed model. In this paper, data were only collected from social media sites, which did not include sites like Twitter, LinkedIn, or YouTube. Therefore, it was unable to carry out cross-platform comparisons. Future studies could explore different approaches to examining DIs, such as reviewing online reviews or other social media posts, to complement the results of this study. Alternatively, researchers can consider investigating the effects of user types (e.g., residency and nationality) on relevant themes. Improving the verification process will undoubtedly enhance the quality of the proposed model and model predictions.
Footnotes
Author Contributions
The author contributed to the design and implementation of the research, to the analysis of the results and to the writing of the manuscript.
Declaration of Conflicting Interests
The author declared no potential conflicts of interest with respect to the research, authorship, and/or publication of this article.
Funding
The author disclosed receipt of the following financial support for the research, authorship, and/or publication of this article: This study was funded by the Ministry of Science and Technology, Digital Humanities Program (MOST 110-2410-H-032-051).
Ethical Approval
This article does not contain any studies with human participants performed by any of the authors.
Data Availability Statement
All data generated or analyzed during this study are included in this published article.