
Abstract
Markets for technology have undergone remarkable changes and received considerable attention, but few studies focus on the markets of a developing country from an evolutionary perspective. Using a unique dataset of patent trades from the National Intellectual Property Administration, PRC (CNIPA), this study seeks to uncover the landscape of China’s markets for technology (CMFT) from an evolutionary view. The research findings show that (1) patent trades in the CMFT have experienced a notable increase, with an average growth rate of 22.3%; (2) the average age and geographical distance of traded patents are 6.3 years and 71.97 km; (3) spatial autocorrelation analysis shows that patent trades in the western region present increasingly stronger correlation; (4) social network analysis indicates that the patent trading network has gotten growing dense over time. We expect this descriptive study to present some basic evidence for theoretical development and consequent research about the markets for technology.
Introduction
Due to escalating product and service complexities, the shrinking technology lifecycle, increasing research and development (R&D) expenditures, and accelerating product update iterations, firms can no longer rely entirely on internal R&D to fulfill all innovation needs (Toma et al., 2018). In this context, external technology acquisitions have become increasingly vital for the development and operation of firms (Hu & Diao, 2021; Moretti & Biancardi, 2020). As such, markets for technology (MFT), as a special place for innovators to acquire external technology, rose accordingly and have shown a rapid growing trend in recent decades (Arora et al., 2020; De Marco et al., 2017; Figueroa & Serrano, 2019). Based on estimations from prior studies, the transaction values of the global markets for technology have increased from approximately $35 to $50 billion in the mid-1990s to $90 to $100 billion in 2000, and surpassed $100 billion in 2002, which represents a more than threefold increase over 10 years (Arora & Gambardella, 2010; Athreye & Cantwell, 2007; Kulatilaka & Lin, 2006). Additionally, Kim and Lee (2019) noted that the volume of patent licensing deals in the MFT expanded from $135 billion in 2005 to $300 billion in 2014, edgewise illustrating the rapid development. Thus, the MFT has become a crucial place for innovation actors to acquire technology.
The expansion of MFT has garnered a great deal of scholarly interest and resulted in a rich body of research outcomes, which can be divided into descriptive and empirical categories. The descriptive literature, on the one hand, depicts the MFT in different countries. Amongst, the majority discussed the topic concerning developed countries, such as the United States (Marco et al., 2015), Japan (Kani & Motohashi, 2012), and European countries (Hyz, 2010). On the other hand, the empirical literature is to quantitatively investigate issues—like motivations, determinants, and impacts—existing in the MFT, mainly based on patent licensing data to analyze. For example, research by Arora et al. (2013); Diez-Vial and Fernandez-Olmos (2015) showcased how numerous firms globally are aggressively licensing their technologies, thereby generating millions of dollars in revenue. In terms of studies on patent licensing determinants, Gambardella et al. (2007) used the PatVal-EU dataset to demonstrate that firm size is the most crucial determinant. Kani and Motohashi (2012) reveals that licensors’ difficulty in finding licensing partners is the major factor that hinders the development of MFT. Additionally, the technology breadth, R&D stage, and characteristics of patent licensors and licensees have been investigated and found to be significant factors (Arora & Ceccagnoli, 2006; Fosfuri, 2006; Gans & Stern, 2003; Kinukawa & Motohashi, 2016). As for the influences of patent licenses, such as promoting technology diffusion, minimizing R&D duplication, and enhancing competitive advantages (Gallini, 1984; Rockett, 1990; Shepard, 1987), have been widely discussed in industries like computers, pharmaceuticals, semiconductors, and chemicals (Cohen et al., 2002; Fosfuri, 2006; Grindley & Nickerson, 1996; Grindley & Teece, 1997; Hall & Ziedonis, 2001; Kollmer & Dowling, 2004).
Although the existing literature has yielded fruitful results, some issues still have not been fully explored. First, there is a data selection bias in prior literature. The previous studies predominantly centered on patent licensing activities, while patent trades, another significant and arguably more representative type of technology transactions, have gotten less attention. Second, the existing literature mainly focused on developed countries/regions, such as the United States, the European Union, Japan, etc., while ignoring developing countries, especially China. Third, the existing studies have not exhaustively and carefully depicted the CMFT from an evolutionary perspective, opting instead for a static perspective (e.g., Duan, Zhang, et al., 2019; Shen & Feng, 2010), thus not unveiling the veil of the CMFT.
Therefore, to make up for the above shortcomings, this study leverages a unique dataset of patent trades between 1996 and 2019 from the National Intellectual Property Administration of the People’s Republic of China (CNIPA) to depict a full picture of CMFT from an evolutionary perspective by dividing studying periods into four stages: 1996 to 2001, 2002 to 2007, 2008 to 2013, and 2014 to 2019. The core research question is—What is the dynamic landscape of CMFT? In pursuit of the answer, this paper analyzes CMFT from three aspects: its general development, spatial autocorrelation, and social network analysis.
By doing so, this study would make the following three contributions. First, it can broaden the research scope of external technology acquisitions and establish a research base for academics to conduct subsequent MFT-related research. Most of the previous literature is a static study of developed countries based on patent licensing data, while this paper uses patent trading data to portray the dynamic landscape of CMFT, which not only allows researchers to have an in-depth understanding of markets for technology but also enriches the practice of external technology acquisitions in China. It may also lay the foundation for peers’ subsequent related empirical research. Second, it can present the innovation actors, especially firms, with a viable decision direction to acquire external technologies. The results in this paper show technology transactions within province and across provinces are significantly increasing, but the difference between the two is gradually decreasing, demonstrating that adequately expanding the technology search scope is practical. This can provide realistic recommendations for innovators to access external technologies across regions. Third, this study could also provide a favorable reference for policymakers to formulate relevant measures to improve the MFT. The general development analysis vividly illustrates that patent trades in the CMFT have achieved astonishing results in terms of scale and growth speed from 1996 to 2019. Additionally, the social network analysis has revealed the imbalanced development of technology transactions in the CMFT, as well as the significant disparities in technology inflow and outflow among regions. Based on the results presented in this paper, policymakers can obtain practical evidence to make regulations for developing the MFT in a coordinated way.
The remaining sections are organized as follows. The second section briefly reviews the related studies concerning the MFT. Section “Data and Methods” describes the data sources and methods utilized in this study. The fourth section presents detailed results and related discussions. In the final section of this research, conclusions, and implications are offered.
Literature Review
Markets for technology (MFT), also called technology markets, were initially defined by Arora (2001) as the aggregation of technology commodity exchanges. It encompasses the entire process from R&D to commercialization of technology commodities. Since technology commodities have an intangible asset nature, technology transactions rely on the protection of intellectual property rights, making patent data valuable datasets for portraying the MFT (Arora & Fosfuri, 2003). The key feature of the MFT lies in why and how technology transactions facilitate the division of innovative labor, allowing for the optimization of technology supply and demand through market mechanisms, thereby achieving an efficient allocation of innovation resources. Existing studies confirmed that inventors can earn economic benefits from technology transactions, while recipients can imitate, modify, and innovate on the basis of these technologies, thus reducing R&D costs and shortening the time for subsequent innovation (Caviggioli & Ughetto, 2016; Liao & Yu, 2012). As a specialized place for innovation actors to acquire technologies externally, the prosperity of MFT has garnered considerable interest from scholars, thus generating fruitful results. The following subsections provide a brief overview of the relevant literature.
Common types of technology transactions include patent licenses and patent trades, yet the majority of studies on the MFT focused on developed countries using patent licensing data. Arora et al. (2013) discussed how licensing activities in the MFT should be organized within large enterprises. Jeong et al. (2013) studied the determinants of the types of technology transactions in the Korean technology market. Using Spanish firms’ patent licensing data, Mendi et al. (2020) found that firms with a history of patent licenses are more likely to engage in the next round of transactions in the MFT. Henkel (2022) explored how licensing levels influence the efficiency of the MFT. Using patent licensing data from Japanese firms, Dang et al. (2022) discovered that the more competitors a licensor has in the MFT, the more technology transactions they will engage in. Moreira et al. (2023) explained how the emergence of innovation intermediaries can profoundly affect MFT. With the rapid technological alternations, the continuous expansion of competition pressures, and the increasing market entry difficulty due to patent barriers, practitioners increasingly realize that the demand for external technology acquisitions cannot be fully met by relying solely on patent licenses, making firms recently attach importance to patent trades in the MFT (Arora et al., 2022; Dang et al., 2022). For example, Orsatti and Sterzi (2024) found that participants specializing in technology acquisitions in the MFT have contributed significantly to patent trades and infringement actions in the United States. H. Zhang et al. (2023) employed patent trading data from USPTO pharmaceutical firms and concluded that in the context of improved information disclosure, sellers with lower credibility are more likely to engage in technology transactions, while those with higher credibility tend to avoid patent trades. Ciaramella (2023) studied European MFT on how taxes affect patent trades.
With the expansion of technology transaction scales in developing countries, MFT in these nations has garnered increasing attention in academia. Some scholars explored how developing countries can realize technological catch-up and acquire external technology. For example, Bala Subrahmanya (2014) examined what led Indian SMEs to accelerate external technology acquisition. As the largest developing country, China has been investigated substantially on these topics. For instance, Qiu et al. (2013) studied factors influencing Chinese wind turbine manufacturers’ technology upgrading and catch-up. Wang et al. (2013) investigated whether external technology acquisitions determine Chinese firms’ export performance and technological developments. With China’s explosive growth in the number of patents and the continuous expansion of technology transaction volumes, scholars have undertaken a series of studies on issues in the CMFT, most of which have utilized patent licensing data. Such study is like Wang et al. (2015), they used patent licensing data to study technology transactions patterns. He et al. (2019) identified the factors influencing technology transactions in the CMFT. Han and Seo (2023) explored the mutual uncertainties of licensors and licensees, reflecting the CMFT’s market-oriented nature. Y. Jiang et al. (2024) investigated the characteristics of green technology licensing and regional differences in the CMFT.
By reviewing the above literature, this paper finds that although abundant research about the MFT has been formed, certain limitations still exist, that is, bias of research data, research objects, and research perspectives. As for research data bias, it could be seen that prior studies have primarily focused on patent licensing, yet the equally important and perhaps more indicative patent trades have received comparatively scant consideration. Theoretically, both patent licenses and trades belong to technology transactions, which can be used to depict the MFT. However, they are fundamentally distinct in terms of whether or not the patent rights are transferred (Chiesa et al., 2008). Patent trades represent the transactions of whole patent rights from sellers to buyers (De Marco et al., 2017), whereas patent licenses denote licensees using licensors’ patent rights for a specific period (Wang et al., 2014). Due to this basic contrast, patent trades, as opposed to licenses, should be more viewed as technology transactions since they completed the transactions. Despite its importance, this topic received scant attention for a substantial duration of time until a few studies emerged recently (see, for example, Caviggioli & Ughetto, 2016; De Marco et al., 2017; Odasso et al., 2014). With regard to research object bias, the prevailing body of literature has predominantly concentrated on developed nations and regions, often overlooking developing countries, especially China. China is facing a rapid technological catch-up, with an increasing number of innovators participating in technology transactions (F. Zheng et al., 2017). According to World Intellectual Property Indicators 2015 statistics, the number of patent applications in China surpassed all other countries (R. Jiang et al., 2019), demonstrating the potential significance of China’s markets for technology (CMFT). The emergence of CMFT has been relatively late, but its speedy expansion is quite remarkable (Godinho & Simões, 2023; Zhai et al., 2023). However, scholars’ attention given to CMFT remains relatively limited. In terms of research perspective bias, the current body of research has yet to comprehensively and meticulously illustrate the CMFT through an evolutionary lens, predominantly adopting a static viewpoint, thereby failing to lift the shroud of mystery surrounding the CMFT. The lack of dynamic exploration of CMFT is not conducive for practitioners to understand the current state of external technology acquisitions in China, nor is it beneficial for policymakers to take appropriate measures to enhance the CMFT. Thus, to gain an in-depth understanding of the place to acquire external technology in China, it is necessary to explore its achievements and existing issues from an evolutionary perspective.
Therefore, in an attempt to present a comprehensive portrait of CMFT, this paper will utilize patent trading data from the CNIPA covering the period from 1996 to 2019 to conduct a dynamic analysis. The specific analyses include the general development, spatial autocorrelation, and social network analysis, aiming to provide valuable insights and practical recommendations to the peer academia, policymakers, and practitioners.
Data and Methods
This section presents detailed information concerning data sources and methods employed in the paper.
Data Sources
This study utilizes patent trading data sourced from CNIPA (http://www.cnipa.gov.cn), covering the period between 1996 and 2019, to uncover the dynamic landscape of CMFT. To do so, patent rights transfers are considered as patent trades in the study (De Marco et al., 2017). According to the Patent Law of the People’s Republic of China, patent holders are obliged to sign a transferring contract when transferring patent rights, which includes a series of information such as the patent’s name, number, application date, and type, as well as the names and addresses of the assignor and assignee, the transfer date, etc. Meanwhile, the contract will be registered with the CNIPA and routinely made public, making it an effective data source for comprehensively exploring CMFT because of its public availability. For example, by analyzing the information mentioned above, we can identify who transferred which patents to whom, dig out the time and address when patent trades occurred, track the source, destination, and new patent owners, etc. Notably, this study focuses exclusively on invention patents for the following reasons. First, invention patents have a higher technical content than utility model patents and design patents (Gu, 2022). Second, the quality, novelty, and practicality of invention patents will be more rigorously reviewed by the CNIPA examiners (Dang & Motohashi, 2015; Motohashi & Yun, 2007).
In this study, several data cleaning processes were performed before getting the final data for analysis. First, we use the following search criteria on the CNIPA: the legal status is specified as “patent rights transfer” (Yang, Yu, et al., 2021); the period is set as “1985 to 2019.” This resulted in acquiring the original patent trading dataset, containing 1,152,797 patents. Second, we exclude patents with duplicate or missing values and patents with merely changes to the sellers’ or buyers’ names or addresses, as these changes do not affect the patent ownership rights, resulting in the deletion of 61,694 patents. Third, as previously said, we intend to concentrate on invention patents due to their more excellent technical content, and hence have removed 648,922 patents. Finally, missing values in other fields, such as international patent classification, address, etc., are removed, yielding an analytical dataset of 437,809 trading patents from 1996 to 2019 (cleaning process as Figure 1 shows).
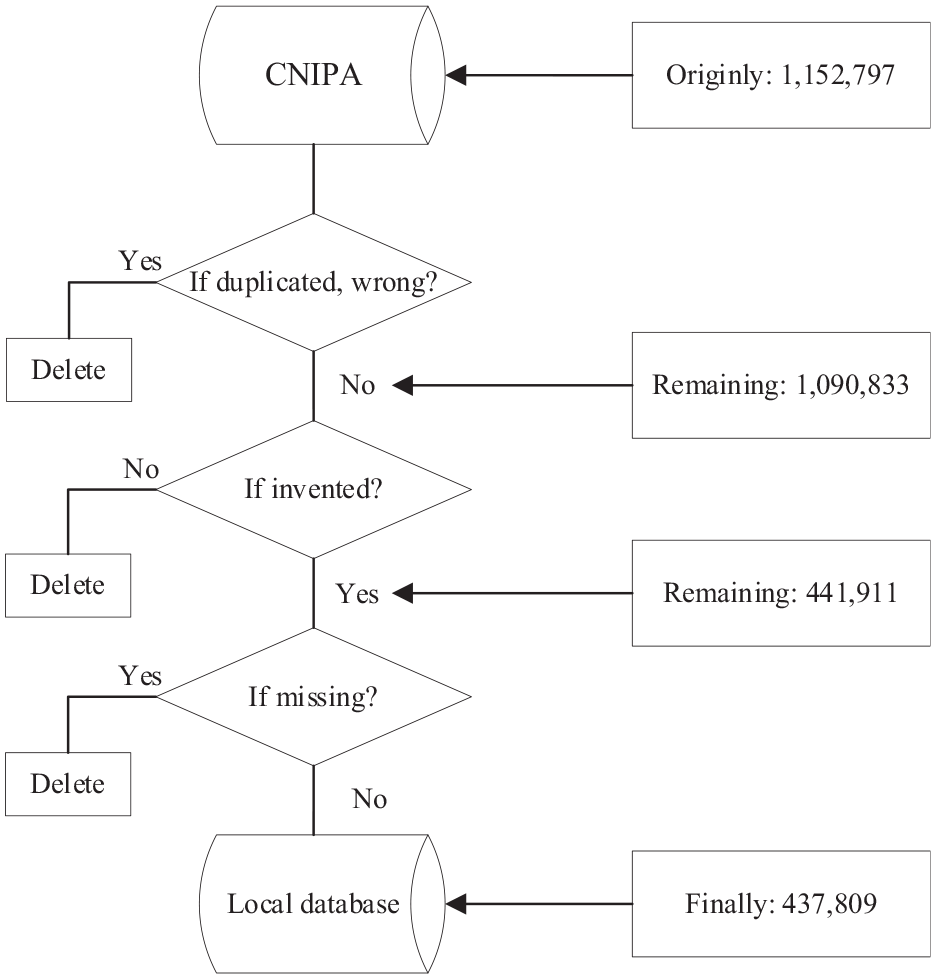
Data cleaning process.
Generally, there are 437,809 patents in the dataset, with 98,275 patent sellers, including 60,810 firms, 3,063 universities and research institutes, 32,568 individuals, and other holders. During this period, trading activities were conducted by 80,193 domestic sellers and 18,082 foreign sellers. Meanwhile, there are 122,889 buyers, comprising 105,067 firms, 2,092 universities and research institutes, 14,642 individuals, and others, with most buyers being domestic (almost 90%).
Methodology
In this paper, we intend to explore the evolutionary landscape of CMFT based on patent trading activities. Therefore, the descriptive method is mainly used for analysis. Specific indicators used for analysis are calculated based on final dataset. In accordance with Mabe (2003), Hu et al. (2023), and Hu et al. (2024), the average growth rate of trading patents was calculated using the following formula:

where
Additionally, patent age is measured by the difference between the applicant year and the transferred year of a patent. As for geographical distance, it is calculated according to studies by Fifarek and Veloso (2010), Hong and Su (2013), and Li-Ying et al. (2014), which formula is presented as follows:
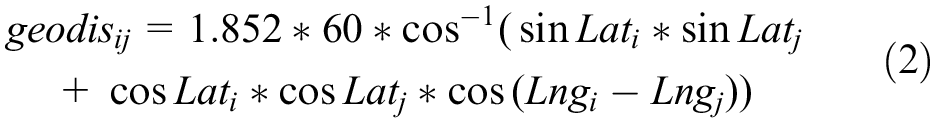
where i denotes sellers; j means buyers. Lat is the latitude of the city where firms are located. Lng is the longitude of the city where firms are located.
Moreover, spatial autocorrelation methods are used to explain the process of spatial evolution (Legendre, 1993). This paper first investigates whether there is a spatial correlation among all regions within China. This is based on whether the Global Moran’s I index is greater than 0, less than 0, or equal to 0, which indicates whether the regions exhibit clustering, dispersion, or a random distribution respectively. The calculation for the Global Moran’s I index is as follows:

where
Local Moran’s I index, on the other hand, identifies statistically significant spatial clusters and outliers. A significantly positive value of Local Moran’s I indicates that a feature and its neighboring spatial features have similar high (High-High Cluster) or low values (Low-Low Cluster), indicating spatial clustering. A negative value suggests dissimilar attributes (High-Low Outlier or Low-High Outlier), indicating an outlier. The variables in this formula have the same meanings as those in formula (3).

Lastly, for the network evolution analysis, social network analysis method is used (J. Zheng et al., 2023).
Results and Discussion
The General Development Analysis of CMFT
As per statistical data, the information and communication technology (ICT) market is projected to exceed a value of five trillion dollars by 2021, solidifying its position as one of the world’s largest industries. This growth serves as a reminder of the ever-expanding presence and significance of technology in contemporary society. In the realm of commodity markets, advancements in communication technology have notably stimulated consumer purchasing behavior (Jie et al., 2022). Similarly, the development of communication technology has also fostered knowledge flow within the technology markets (W. Liu et al., 2022). Figure 2 illustrates the respective shares of each country in the ICT industry, with China consistently increasing its share and securing the second position. These data substantiate the gradual expansion of technology markets, with China playing an increasingly influential role. These findings provide substantial evidence for further analysis of the CMFT.

Global market share of the ICT market from 2013 to 2021.
First, we explore the general growth of patent transaction values in the CMFT (see Figure 3). According to the Annual Report of China Science and Technology (1996 to 2019), the total transaction values have risen dramatically over the years, from 30 billion in 1996 to over 2,000 billion in 2019, an increase of almost sevenfold, with an average growth of 19%. This is not only possibly due to the explosive growth in the proficiency of Chinese patents but also reflects the increasingly growing demand for technology in China’s markets (Chen & Zhang, 2019). In addition, intellectual property has become a crucial tool for maintaining market leadership, accessing external resources, and impeding competitors’ market entry (M. Zhang et al., 2024). Consequently, the scale of patent trades is likely to witness even more significant growth in the coming years.
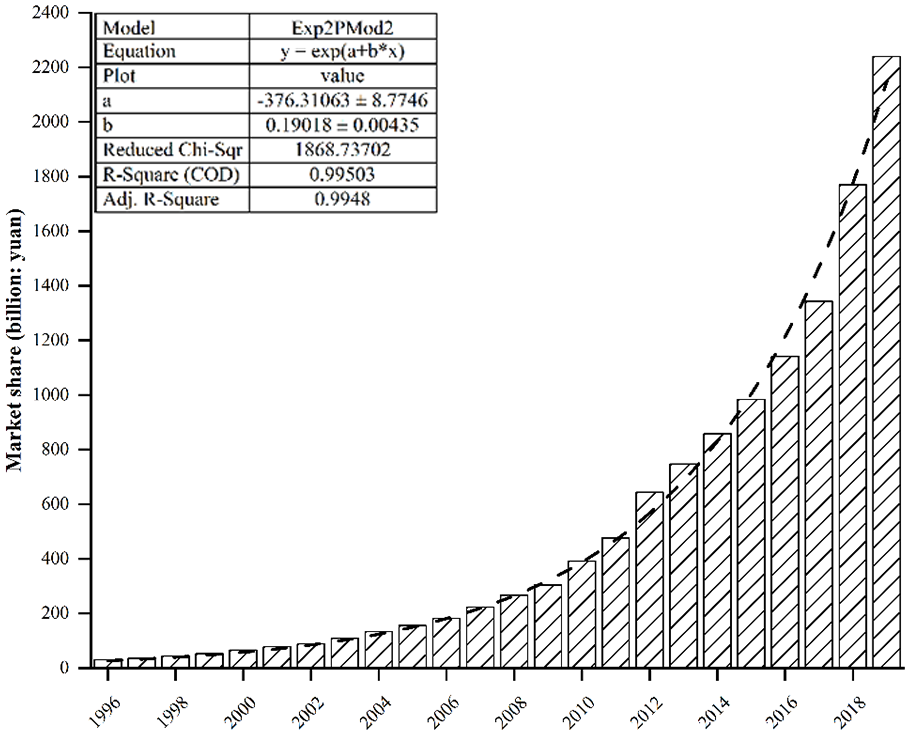
The growth of market share in CMFT from 1996 to 2019.
Figure 4 showcases the progression of granted and traded invention patents from 1996 to 2019. Both categories have shown substantial growth, with traded patents demonstrating a significantly higher average growth rate of 22.3% compared to the 14.5% growth rate of granted patents. Specifically, in 1996, the CMFT recorded 2,976 granted patents, which surged to 67,948 by 2007, quadrupled to 172,113 within 4 years, and increased to 452,804 in 2019. On the other hand, traded patents started with a mere 4 in 1996, constituting only 0.13% of the total markets. However, the following year demonstrated an extraordinary growth rate of 1,725%, with 73 traded patents. The number of traded patents steadily increased from 1,830 in 2005 to 44,835 in 2016. Although a slight decline occurred in 2018, traded patents reached 86,509 by 2019, accounting for 19.11% of the total granted patents. Related scholars attribute this increasing trend in technology transactions to the implement of a series of innovation industry policies by the government, which have elevated the level of technological innovation and expanded the scale of the technology markets (Yan et al., 2022). Findings of Datta and Srivastava (2023) suggest that technological breakthrough innovation are likely to emerge from novel combinations of existing inventions. In an effort to quickly gain technical advantages, reduce costs, and capture market share, firms may increasingly opt for acquiring external technologies for recombination, rather than starting from scratch with research and development. Based on this, this paper posits that the dual factors of government policy initiatives and active participation from firms have led to the explosive development of the CMFT.

The increase of granted and traded patents from 1996 to 2019.
Table 1 reveals that over time, the proportion of domestic trades has gradually surpassed that of foreign ones. From 1996 to 2001, the domestic trades accounted for 20.73%, while foreign trades constituted 77.96%. However, between 2014 and 2019, the proportions shifted to 72.44% for domestic trades and 25.26% for foreign trades. Compared to foreign entities, domestic ones may have a better understanding of local market demands, and products produced from their technologies are more likely to be accepted in the domestic market (McCausland, 2022). Conroy et al. (2023) showed that in the innovation process of multinational firms’ subsidiaries, there is a need for local intermediary organizations to assist in researching market preferences and product demand directions. This reason could lead to buyers having a preference for technology from domestic sellers over foreign ones.
The Proportion of Traded Patents from 1996 to 2019.

Table 2 presents the distribution of patent trades based on the type of market participants. Trades between firms dominate the market, accounting for 77.81% during the period of 1996 to 2001 and gradually decreasing to 67.66% between 2014 and 2019. The second-largest trading group consists of individuals selling patents to firms, representing a range of 5.40% to 13.52% throughout the analyzed periods. Notably, the proportion of patents sold by universities/ research institutes to firms has experienced a rapid increase, expanding from 3.94% to 8.28%. These findings highlight that firms are the primary trading entities, while trading activities involving universities and research institutes remain relatively less active. Existing studies have also pointed out that universities and research institutes are not sufficiently involved in technology transactions in the CMFT (Figueroa & Serrano, 2019; He et al., 2019), and this may be a direction that peer scholars can explore.
The Distribution of Patent Trading by Market Actors’ Types.

Note. URI means universities and research institutes; Individ. denotes individuals; numbers in the table are in percentage.
Figure 5 illustrates the trends in patent trades based on the location of market participants, specifically within province, across province, and international trades. It can be observed that patent trades within and across provinces have shown significant growth, while the proportion of international trades has declined after 2017. This finding not only aligns with the research conducted by Yang, Yu, et al. (2021) and Jimenez-Moro et al. (2023), which highlighted the dominance of within provinces technology transactions, but also innovatively points out that the gap between across province patent trades and within province ones is gradually narrowing in the CMFT. Cross province transactions can not only help to narrow the technological gap between regions but also facilitate knowledge flow and promote collaborative innovations (Yang, Yu, et al., 2021). Given its numerous benefits, if governments advocate for the development of online patent trading platforms, it is conceivable that in the future, cross province transactions may surpass those within province. Table 3 presents the average geographical distance for each category of patent trades. On average, the distance between patent sellers and buyers in the CMFT is 71.97 km, and it has fluctuated over time, experiencing both decreases and increases. Notably, the average geographical distance has increased compared to the initial stage, regardless of whether the patent trades occur within provinces, across provinces, or internationally. This can be attributed to the rapid development of information technology, particularly the internet and digital infrastructure, which has diminished the physical distance between individuals (Tian & Lu, 2023; Torre, 2014). Thus, improving these infrastructures to promote cross-regional transactions may be feasible for policymakers (J. Liu et al., 2023) due to long-distance patent trades are becoming more feasible and prevalent.

Geographic distribution of patent sources (by percentage) from 1996 to 2019.
The Geographic Distance of Patent Sources from 1996 to 2019.

The time gap between the year of application and the year of sale determines the age of a traded patent. If the gap is short, the patent is considered new, whereas a longer gap indicates an older patent. The data reveals that the average age of traded patents is 6.3 years, although this varies over time. Figure 6 illustrates that the average age of traded patents reached its highest point in 1999 and its lowest point in 2017. Overall, there is a downward trend in the average age of patents, indicating that participants in the CMFT are increasingly interested in acquiring and trading new technologies. In the rapidly changing business environment, the speed of technology alternation and acquisition is crucial for firms to create and maintain a competitive advantage (Duan, Du, et al., 2019). Specifically, the average age of domestic patents demonstrates a consistent decrease, while the age of foreign patents shows an upward trend. This suggests that market participants place greater emphasis on novelty when it comes to domestic patents compared to foreign patents. Generally, the trading age for domestic patents is consistently lower than that of foreign patents. This difference could be attributed to significant variations in regulations, tax incentives, and legal procedures among different countries, which influence the timing of foreign patent trades (De Marco et al., 2017).

The average trading patent age between 1996 and 2019.
As for the top 10 active technology fields (see Figure 7), it could be seen that Communication traded the most patents in 1996 to 2001, followed by Polymer Chemistry and Fine Organic Chemistry. In the second period, Communication still accounted for the largest proportion, followed by Audio-visual Technology, Pharmaceuticals, and Cosmetics. In 2009 to 2014, the top three technology fields of patent trades were Communication, Semiconductor, and Audio-visual Technology. In the last period, Communication traded the largest share of patents, followed by Control and Instrumentation Technology and Electrical Devices and Engineering. It could be found the proportion of high-tech technologies gradually exceeds that of traditional ones, denoting that trading activities are more effective in high-tech technologies (i.e., communication, electrical devices, and information) than traditional ones, such as material, metallurgy, or polymer chemistry. Existing research also highlights that industries with a high dependence on technology actively participate in technology transactions (Asna Ashari et al., 2023; Jin et al., 2024). This indicates that for practitioners, especially for firms, acquiring external technology may become one of the critical components of future innovation strategies (Guerrero et al., 2023).

Top 10 technology fields in different periods.
The Evolutionary Spatial Autocorrelation Analysis of CMFT
In this paper, the cumulative number of trading patents for different periods was used as a variable, the spatial weight matrix based on geographical adjacency was chosen, and the global Moran’s I index, p test value, and Z statistical score were applied to determine whether the activities of patents trades are spatially correlated in different Chinese regions for different periods. Patent data were obtained from 31 provinces, municipalities, and autonomous areas, omitting Hong Kong, Macao, and Taiwan. Moreover, Hainan province’s patent data are restricted to Hainan Island.
Table 4 shows that except for 1996 to 2001, the global spatial autocorrelations for three periods are significant (p < .05, Z > 1.96), indicating that the activities of patent trading showed a very substantial spatial dependence. The global Moran’s I have an appreciable increase, which means the degree of clustering is higher over time, and trading patents tend to develop in a centralized manner.
Global Spatial Autocorrelation Test.

In addition, a local spatial autocorrelation analysis method was employed to deal with heterogeneous regions. The total number of patent trades in 31 provinces, municipalities, and autonomous regions from 1996 to 2019 was subjected to clustering and outlier analysis. Figure 9 demonstrates the results. High-High is depicted in the cross-line region and represents the high-value aggregation class; High-Low is described in the right slash area and is surrounded by low-value components, signifying high-value elements. Low-High is displayed in the left slash region, meaning low-value elements surrounded by high-value components. In contrast, Low-Low is displayed in the dot plot area, representing low-value cluster classes.
According to Figure 8, all provinces were not significant in 1996 to 2001. This paper believes the reason for the result is that the number of trading patents is relatively low in this period. As for the second period, High-Low clustering areas appeared in Guangdong. Low-High clustering region appeared in Hebei. High-High clustering region appeared in Shandong. Few western provinces belong to the Low-Low cluster (i.e., Sichuan and Tibet). In 2008 to 2013, there was a continuous distribution trend in Low-Low clustering regions, mainly located in Xinjiang, Gansu, Ningxia, Shaanxi, and Xinjiang, while other clusters disappeared completely. In the last period, nearly all provinces in Western regions belonged to Low-Low clustering regions except Guangxi, Yunnan, and Guizhou. Shandong, Jiangsu, Shanghai, Zhejiang, and Anhui, which are mainly in the eastern areas, showed High-High clusters. Jiangxi and Fujian became Low-High outliers. From the evolutionary results, we find the number of units in Low-Low cluster and High-High cluster has increased. This suggests that patent trading activities in western regions show more robust correlation in spatial, though still at a low level. The high level of patent trades in Shandong has spread to many provinces in Eastern regions such as Jiangsu, Shanghai, and Zhejiang. Therefore, the spatial autocorrelation characteristics of CMFT are significantly constrained by regional development and geographical position (Yang, Che, et al., 2021; Zhou & Li, 2024). This necessitates policymakers to implement regional policies such as subsidies and tax incentives to extend the advantages of the eastern regions to the central and western areas (Y. Zheng et al., 2021).

The evolution of local spatial autocorrelation characteristics.
The Evolutionary Network Analysis of CMFT
Figure 9 depicts the direct links between sellers and buyers in various Chinese regions over time. The relationships have altered considerably over time. Specifically, between 1996 and 2001, only a few provinces (Beijing, Shanghai, and Guangdong) participated in patent trading activities; other areas did not. Over time, the patent trading network has gotten increasingly dense. During the period of 2014 to 2019, we have observed a decentralization of the network. This indicates that an increasing number of nodes are participating in the network, and the trading routes have become more diverse. During this period, province-to-province patent trades have expanded considerably, with technology hubs such as Beijing, Guangdong, Shanghai, and Jiangsu growing (indicated by the circle size). There are two possible explanations for this. First, the Chinese government executed an indigenous innovation strategy in 2006 (Wang et al., 2015), thus accelerating and stimulating the diffusion of technology among provinces. Second, the development of an open innovation paradigm, acquiring external technologies and integrating them with internal technology sources, has resulted in an innovation-driven force and strategy (Chen & Guan, 2010; Chesbrough, 2003; Wagner & Leydesdorff, 2005; Wang et al., 2012).

Patent trading network evolution in different periods.
Additionally, the paper calculates the amount of technical outflow and inflow degree for each province and divides the Chinese regions into eastern, central, and western according to the level of economic development. As shown in Table 5, provinces with high inflow also have high outflow. Generally, the eastern regions (i.e., Jiangsu, Guangdong, Shanghai, etc.) gather many active sellers and buyers. However, western regions primarily buy patents from other provinces such as Gansu, Qinghai, and Tibet. Furthermore, there is a higher growth rate in both patent outflow and inflow in the eastern regions of China. This indicates that the technology markets in the eastern regions of China are more vibrant and active. A reasonable explanation for this result is that the Chinese regions have reinforced S&T collaborations since 2006; many relative policies have also been implemented to stimulate and accelerate the growth of patents per province (Huang, 2017; Yeung, 2009).
The Inflow and Outflow of Trading Patents by Regions.

Conclusions
This study utilizes a unique patent trading dataset from the CNIPA spanning 1996 to 2019 to examine the dynamic development of CMFT. First, the study divides the period into four phases (1996–2001, 2002–2007, 2008–2013, and 2014–2019) to discuss the statistical characteristics of technology transactions. It explores fundamental features such as market size, growth rate, trading regions, market participants, patent age, average geographic distance, and the top 10 popular technology fields in patent trades. Second, spatial autocorrelation methods are employed to investigate whether the activities of patent trading are spatially correlated in different Chinese regions for different periods. Finally, the study utilizes social network analysis to examine the technological flow and CMFT’s dynamic evolution. It aims to identify direct connections between different regions in China and identify cities that serve as important hubs within their respective regions (eastern, central, and western). The main findings of this study are the following:
First, the overall trading volume of the technology markets has continuously grown, with a substantial increase in transaction value from 1996 to 2019. The average growth rates for granted and traded invention patents are 22.3% and 14.5% respectively. The average age of traded patents has been decreasing over time, with an overall average age of 6.3 years. Interestingly, the average geographic distance in technology transactions has been increasing, with an overall average of 71.97 km. Second, spatial autocorrelation analysis of patent trading activities indicates that the western region has been increasing but still relatively low levels of spatial autocorrelation. While the levels of spatial autocorrelation in the eastern region, such as Shandong and Shanghai, has been increasing over time. Third, network analysis demonstrates that Beijing, Shanghai, Jiangsu, and Guangdong are prominent nodes in the network, exhibiting high outdegree and indegree. Additionally, the patent trading network has become increasingly dense over time.
Theoretical and Practical Implications
Our results have some theoretical implications. First, this paper adds new insights to the extant literature on MFT. By conducting a detailed and comprehensive evolutionary analysis of the CMFT, this paper aids scholars in enhancing their understanding of MFT and assists them in identifying the development characteristics that distinguish developed countries, thus providing directions for subsequent research. Second, we provide solid facts and evidence for the practical application of external technology acquisitions in China. By analyzing the evolution of growth trends, the proportion of market participants, trading networks, etc., the results of this paper detail the explosive growth of the CMFT, laying a solid foundation for future studies in this area. Third, it also helps scholars focus their attention on patent trades. This paper utilizes patent trading data, a frequently overlooked yet crucial component of technology transactions, to depict the markets for technology, which would potentially lead to more abundant outcomes in MFT-related topics.
The practical implications of this paper are primarily focused on the following two aspects. First, this paper contributes to providing a foundation for policy formulation. Despite the growing scale and average distance of technology transactions and the narrowing gap between across provinces and within provinces, several areas in the western region still exhibit low levels of technology transaction activities, predominantly in a state of net outflow. Additionally, the developmental advantages of the eastern regions, such as Shandong, have not yet radiated to the central and western areas during transactions. This indicates the necessity for the government to enhance the development of the national MFT, which could be achieved by implementing policies that promote technology transactions across eastern, central, and western regions, such as subsidies and tax incentives. Furthermore, the government could also establish online trading platforms to further reduce barriers to across province patent trades. Second, this paper helps provide direction for practitioners to develop external technology acquisition strategies. The participation of universities and research institutions in the technology markets is not active enough. We suggest that universities and firms should strengthen their communications. Universities have more basic knowledge, which firms and markets lack. Firms can provide universities with potential commercialization directions for innovative activities. In addition, practitioners should strictly control the quality rather than the quantity of patent trades. This is due to the fact that the prerequisite for acquiring external technology is that it is valuable. Meanwhile, practitioners can spread the scope of transactions further, as the share of across province technology transactions is also increasing yearly.
Limitations and Future Directions
Although we provide an evolutionary landscape of CMFT through patent trading data. However, certain limitations still exist in our study. For example, due to the temporary unavailability of relevant supplementary data, an issue of renaming individual inventors and firms cannot be effectively identified in this paper, which would possibly result in a certain bias of the number of participants in the CMFT in each period and each region. This paper will continuously focus on this topic and try to solve the issue in subsequent studies.
Footnotes
Declaration of Conflicting Interests
The author(s) declared no potential conflicts of interest with respect to the research, authorship, and/or publication of this article.
Funding
The author(s) disclosed receipt of the following financial support for the research, authorship, and/or publication of this article: This work was supported by the Key Laboratory of Statistical Information Technology and Data Mining of National Bureau of Statistics of China under Grant SDL202302, the Research Center for China Social Governance Innovation under Grant SHZLYX2305, and the Sichuan Provincial Key Laboratory of Philosophy and Social Sciences Key Laboratory of Liquor Digital Intelligence Management and Ecological Decision Optimization in the upper reaches of the Yangtze River under Grant zdsys24-09.
Ethical Approval
Ethical approval is not applicable for this article.
Statement of Informed Consent
There are no human subjects in this article and informed consent is not applicable.
Statement of Human and Animal Rights
This article does not contain any studies with human or animal subjects.
Data Availability Statement
The datasets generated during and/or analyzed during the current study are available from the corresponding author on reasonable request.