
Abstract
When could it be safe to report ordinal scores instead of linear measures? In this study, preschool gains measured with ordinal scores were compared with residualized gain scores, as well as Rasch model measures of linear change (logits) to clarify respective implications for objectivity, precision, validity, and meaningfulness. Results showed that ordinal scores and linear gains were highly correlated (~.90), and specific conditions were identified such as pre-test score distributions, pre-test variability, and overall test targeting that determine complementarity of ordinal scores and linear scale values for reporting achievement gains. Several properties of ordinal score gains were discussed, including negative correlation between gain and pre-test, unreliability of gains, and usefulness of residualized gains. This report concludes by supporting interchangeability of ordinal scores and objective, linear measures when appraisal of complementarity is supervised by principles of mathematical logic.
Keywords
A perplexing question that has accompanied the rise of 20th-century social sciences is how to report gains after instruction or an intervention. Despite breath-taking advances in high-speed computing, an enormous proliferation of statistical models, and integration of probability and measurement theory, this simple question continues to confound social science researchers of every stripe. In general, gain scores or measurement of change present challenges, and not surprisingly,
there are few topics in social science methodology that have elicited as much confusion, misunderstanding, and anxiety as . . . gain scores. (Collins, 1996, p. 289)
The unspeakable source of this confusion is lack of an explicit, uniform interval measuring unit. Conventional social science researchers insist on measuring change with ordinal methods, hence without equal interval (linear) numerical units. Unfortunately, mathematical logic imposes explicit requirements on manipulation of numbers, which has direct implications for measuring psychometric change. Social science researchers would be wise to increase their understanding of the mathematical foundations for measuring change.
Much confusion surrounding measurement of change results directly from the rapid rise of social science methodology during past 100 years or so. In fact, confused nomenclature abounds throughout the literature. Measurement precision, for example, is commonly confused with psychometric reliability, just as ordinal scores are conflated with linear measures. Even more confusing are linear models, linear regression, and general linear models, which compute correlations with ordinal scores to estimate a regression line. Regression lines, of course, do not have number properties or a measuring unit but are central to contemporary psychometric ideas about scientific knowledge. Now, oddly, these statistical models are not carefully distinguished from generalized linear models (GLMs; Nelder & Wedderburn, 1972) or generalized additive models (GAMs; Hastie & Tibshirani, 1990), which, in fact, implement a mathematical transformation function and measure with a linear unit.
Purpose
This research asks the question: Can communication with educational and psychological testing consumers be improved with ordinal scores? Likewise, would description about patient-reported outcomes (PROs) benefit from ordinal scores? It is an unusual question, because scientific measurement, in principle, is directed at eliminating ordinal score distortions such as nonuniform units, unstable scale properties, and sample dependent parameter values (Hambleton, 1991). So how can ordinal scores improve communication?
The reality is testing consumers such as parents, teachers, and patients typically prefer ordinal scores rather than objective linear units. Linear units are generally opaque to laypersons, especially when they are expressed on log scales or as probabilistic measures. Even conventional standardized scores are more meaningful to laypersons than linear measures. Linear change, of course, requires mathematical transformation of ordinal scores to equal interval units, which eliminates score distortion in distribution tails—upper tail units are larger hence harder for students and patients than lower tail units which are smaller and easier. In general, reporting growth, learning, or patient status with ordinal scores forces social science researchers to confront an unresolved issue fundamental to science—measurement of “change,” which in psychometrics is frequently referred to as gain scores.
In addition to traditional educational and psychological testing, ordinal scores and qualitative assessment are implemented during psychometric patient assessment in health care (see Uniform Data System for Medical Rehabilitation, 2014). Physical rehabilitation clinicians, for example, may describe patients concretely such as “walking with and without assistance” or “assisted” versus “unassisted transfers” rather than refer to probabilistic, log-odds (logit) units of linear gain (Granger, Hamilton, Keith, Zielezny, & Sherwin, 1986). Therefore, a useful goal here too would be to document correspondence of linear change with passing a specific number of items for a particular assessment with some degree of generality.
Educational, psychological, and health care researchers are deeply divided over practical differences between ordinal and linearized scores. Following sections present a brief overview of these differences measuring change that might otherwise seem enigmatic. This report then presents an empirical comparison of three methods of measuring change: simple raw score gains, residualized gains, and linear gains, and the intention here is to clarify their comparability for reporting objective change between pre- and post-assessments. Finally, a discussion follows about conditions that tend to support their qualified agreement and complementary use.
Background
To add confusion to this already difficult topic, some researchers claim ordinal and linearized score differences are irrelevant to practical applications such as measuring change (Xu & Stone, 2012). Gaito (1980) claimed “there is no relationship between scale type and statistical techniques” (p. 564; see also Lord, 1953), while others suggest ordinal scores can be used as if they are linear (Spector, 1976). Some commentators assert ordinal scores already have interval properties and scoff at any suggestion of empirical justification (Borgatta & Bohrnstedt, 1980). Likewise, Carifio and Perla (2007, 2008) attributed questions and concerns about Likert-type units to “myths and urban legends” (Carifio & Perla, 2007, p. 106). These attitudes over several decades have led to a generally capricious approach to statistical analysis and, not surprisingly, scientifically unsound quantitative practices surround ordinal analyses. Contemporary studies into Likert-type ratings are finally providing much-needed insight about their unstable properties (Lantz, 2013). In general, ordinal scores and ratings remain treacherous and require caution.
Separate Branches
Ironically, psychometric gain scores have been studied so intensely that a reconciliation with a perspective emphasizing linear units is unlikely. In fact, this report points toward two sciences, one where gain measurement now defines a fundamental bifurcation of social science methods into ordinal and linear epistemologies. Indeed, practical divisions are now so deep that certain empirical problems are only addressed with objective, linear methods, while others rely on ordinal score methods. For example, professional licensure and certification are exclusively conducted with linear measurement models, while survey and opinion research typically relies on ordinal methods. Large-scale educational testing is unusual because international comparisons such as Programme for International Student Assessment (PISA) is conducted with a linear measurement model, while large-scale American testing is conducted with item response theory (IRT), which transforms scores to linear units, then changes them back to an ordinal scale with additional procedures (2 and 3 parameters). Conventional psychological or behavioral research continues to implement untransformed ordinal scores.
Rather than alarm, this differentiation and specialization represents a long waited maturity of social science research. Historically, similar branching has occurred in physical sciences such as differentiation of high energy physics from statics, quantum from classical physics, and analytical from plane geometry. Empirical psychology has long recognized two disciplines, namely, experimental and correlational perspectives (Cronbach, 1957), and Andrich (2004) first discussed philosophical differences between IRT and Rasch models. Present research, however, goes much further and asserts that differences between ordinal and linear measures now constitute independent branches of social scientific research. Logically, this branching reflects the robust health of social science methodology in 21st century after adaptations to newer and more complex measurement problems. Understanding these differences should diminish the mystery of measuring gain.
Historical Antecedents
Although statistical record keeping has ancient origins, contemporary social science research methods did not appear until well into 19th and early 20th centuries when several key forces converged. Laplace’s 19th-century contribution of central limit theorem together with Gauss’s theory of errors established modern inferential statistical foundations (Stigler, 1986). Then, Fechner (1860) invented psychophysical methods that modeled human judgments with an error distribution. Later, Thurstone (1928) was inspired by Fechner’s advances and developed statistical methods, also based on Gauss’s mean error, for measuring opinions and attitudes. While these innovations offered objective foundations for measuring psychological change, a nagging question would echo among traditional, physical scientists. Do these methods for measuring social observations actually constitute objective scientific measurement?
Social science in the late 19th century was also significant for monumental conceptual leaps. Simon and Binet’s development of IQ finally moved scientific thinking beyond only physical constructs. IQ was the first nonphysical quality parameterized with numerical operations and validated with human behavior predictions (Binet & Simon, 1904, 1916). IQ differs fundamentally from Fechner’s perceptual judgments and Galton’s cognitive measures by representing a hypothetical qualitative hierarchy in a numerical framework. In 1920, in collaboration with Simon, Jean Piaget proposed a qualitative intellectual stage theory based on IQ, which would become the foundations for 20th-century developmental theory. Around this time, Spearman (1904) also contributed unidimensional factor theory to social scientific conceptualizations, which would dominate statistical and conceptual insights for several decades.
In addition to psychophysics and attitude measurement, social survey and mental testing methods would emerge in the 19th century from Galton’s fascination with eugenics. Together with his student Cattell, Galton advanced mental testing to identify hereditary cognitive differences (Cattell & Galton, 1890), and Galton would invent statistical correlation and regression to demonstrate generational transmission of his mental measures (Bulmer, 2003).
These early methods and constructs paved the way for virtually the entire 20th-century elaboration of social science research methods. Yet, despite their monumental significance, these early advances lacked a traditional measuring unit. Instead, their numerical values were not “real” numbers but only rank orders described by mathematicians as counting numbers, natural numbers, and positive integers. Spatial distance between ranks is not uniform nor do they have uniform material quality; hence, their addition and subtraction are not logically meaningful. Pearson (1894) introduced standard deviation, a generalization of Gauss’s mean error to describe ordinal score distributions, which arguably succeeded in obscuring this fundamental anomaly of mental scores.
A further stigma of mental test scores is rank orders are confounded with specific samples, because a person’s mental test score rank arbitrarily changes from sample to sample. Successive sampling, of course, contributes to “true” parameter values in the long run, but practical measurement is commonly based on isolated observations. Substitution of concrete population parameters for isolated samples has stabilized measures but sacrificed objectivity. By comparison, scientific units, which define abstract, universal constructs such as length and weight, are independent of specific samples or populations. It would be another 50 years before confounded items and persons and their sample dependency would benefit from Rasch’s (1968) separability theorem and measures with specific objectivity (Rasch, 1960/1980). Despite these limitations, early 19th-century mental testing applications quickly led to population norms and standard scores (Thorndike, 1904; Thorndike, Bregman, Cobb, & Woodyard, 1926), and those methods were generalized to personality constructs (Shields, 2007). Thurstone (1925) parameterized Binet–Simon’s IQ items with a statistical unit of measure.
Social Undercurrents and Institutionalization
While 19th- and 20th-century social science research is deeply indebted to European intellectual traditions mainly in England, Germany, and France, phenomenal growth of mental testing and eventual institutionalization was uniquely American (Carson, 2014). As early as 1911, IQ testing was imported into American public schools, then adapted during World War I to select officer candidates (Army Alpha and Beta Tests). Further adaptations such as Knox Cube Test in 1920s would examine newly arrived immigrants (Boake, 2002; Rachofsky, 1918; Zenderland, 2001). In 1921, The Psychological Corporation was established to promote commercial IQ testing interests, and by the 1930s widespread school achievement testing was being conducted with Iowa Tests of Basic Skills (ITBS). Nowhere else did mental testing rise so quickly or widely as in the United States. This early emphasis on testing for selection rather than growth or learning overshadowed most concerns about measurement of change.
Historical accounts point to at least three powerful sociopolitical and economic forces that facilitated American institutionalization of mental testing and the ordinal methods that supported it. First, many Americans shared a common belief in “progress,” and scientific ideas to solve problems. Then, between mid-19th century and the Great Depression, massive demographic migrations, literally millions of Europeans immigrated to America, and mental testing was seen as instrumental to addressing cultural effects and social problems such as poverty, crime, and unemployment. Consequently, Americans listened closely to Galton’s ideas about mental testing and his active promotion of eugenics. The following quote describes convergence of these forces:
[American] culture . . . worries about the so-called “menace of the feebleminded” and infatuation with eugenics was widespread . . . in which the turn to science as an important means of addressing social and industrial problems was embraced by many. . . . United States may have been one of few in which a sufficient number of cultural, material, and institutional factors could come together to make mental testing appear to be a technology worth pursuing on a large scale. (Carson, 2014, p. 254)
American ability and intelligence testing was institutionalized in the College Board in 1899 (College Board, 2015) followed by Scholastic Aptitude Test (SAT) in 1926. An emphasis on selection also appeared in cognitive aptitude testing at General Electric conducted by Johnson O’Connor in 1922. In 1947, Educational Testing Service (ETS) began selecting students for college admission based on verbal and quantitative aptitude test scores. Throughout this rapid expansion, a central motivation underlying mental testing was ability selection. Practical mental testing was largely obsessed with efficiency and accuracy of discriminating between higher and lower ability, and the reproducibility of obtained rank order (reliability). In contrast, increased understanding of psychometric properties to support measurement of cognitive development and learning were not on the social research agenda.
Rejection of Scientific Foundations
The rapid 20th-century American assimilation of mental testing brought attention to test scores, which were unusual by scientific standards. For example, measures in Fechner’s psychophysics experiments, as well as Galton’s studies of individual differences, lacked the property of unit additivity, which is instrumental for demonstrating consistency between empirical quantities and mathematical logic. Additive units legitimize arithmetic operations, which has extraordinary importance for adding and subtracting units on a number line—a chief purpose of scientific measurement. In general, objective measurement is critically dependent on valid numerical operations.
Perplexity of gain measurement without a measuring unit was frequently noted during this early period of the American testing movement. By 1920s, commentaries began appearing (Henmon, 1920; Young, 1928) and by 1930s, meaningfulness of measuring change without an explicit unit became an issue of scientific concern (Thurstone, 1931). Watson (1933) commented on measurement of change as follows:
Numerous perplexing studies on the relation of [initial] status to change in test scores . . . show greater gains for those subjects originally making the [highest] scores. The more common result, due . . . to unequal units or too low a ceiling . . . is a low negative correlation. . . . It is usually assumed that pupils tested at the beginning . . . then later in the year . . . have shown a change [that] have much the same meaning as scores on the original test . . . This assumption is certainly not true. (p. 187)
A consequence of this fundamental discrepancy between test scores and numerical properties is early 20th-century physical scientists began raising questions about commensurability of social measures and logical number systems, as well as meaningfulness of mental measures in mathematical equations. These concerns about test scores and psychological measurement finally came to a peak in 1932 when the British Association for Advancement of Science organized a special committee to investigate logical foundations of psychophysical measurement (Ferguson et al., 1940; see summary in Michell, 1999). These meetings were conducted at Cambridge University attended by eminent contemporary authorities in physics and philosophy. Their conclusion after 8 years of discussion and rigorous debate was to reject logical foundations of psychological measurement. Central issues leading to this rejection were unit additivity and concatenation criteria, which are required for validating physical measuring units. An excerpt from that report follows below:
Any law purporting to express a quantitative relation between sensation intensity and stimulus intensity is not merely false but is in fact meaningless unless and until a meaning can be given to the concept of addition. (Ferguson et al., 1940, p. 245)
Obviously, Ferguson Committee results were a shocking setback for social science research. In philosophical terms, the social sciences faced a hopeless measurability crisis (Michell, 1986, 1999, 2000, 2008).
Qualitative meaningfulness of physical units has been defined for over 2,000 years by an explicit concatenation procedure that demonstrates spatial extension or Euclidean structure between perception and number. Mathematical uniformity of this relation defines the logical foundations of scientific measurement. The simple empirical transformation of ice to steam, for example, is a qualitative validation of temperature parameterization within a fairly restricted phenomenological range. It provides legitimacy for measuring temperature of observations outside human perceptual range. A more dramatic example would be qualitative high energy transformations that occur across microscopic and celestial levels of scale. In contrast, test score addition and subtraction do not present sensory or qualitative change; hence, their numerical operations lack meaningfulness. This issue is exacerbated by mental testing constructs that do not assert ontological entities or objective reality, hence lack philosophical integrity. In other words, the dynamical cosmological narrative that underlies physical science and its measures is absent from mental test scores.
Legitimation
Consequences of the Ferguson Committee for social science researchers were disastrous. Leading scientific authorities seemed to have settled a long-standing question, which largely eliminated mathematical social sciences from more than 2,000 years of scientific advancement; a judgment that seemed without appeal. Then S. S. Stevens, a psychologist who had attended Ferguson committee meetings, offered the social sciences a solution that would have tectonic consequences.
Stevens, in a creative act that is still not widely appreciated, proposed extending the standard scientific model by accommodating social observations with a hierarchy of scale types. Instead of expecting social observations to conform to a narrow, monolithic ideal established by physical measurement, he proposed a broader conceptualization that included ordinal representations commonly obtained during psychological observations and mental testing. Stevens was not proposing an approximation to physical measurement idealizations but instead a conceptual leap to “new” data structures. Stevens proposed extending the boundaries of mathematical logic to include ordinary nonphysical experience, which he organized in a quantitative hierarchy of nominal, ordinal, interval, and ratio data types. Moreover, he provided an empirical “key” for validating new data types by invoking the principle of scale invariance. In his system, data-type validity depended on preserving empirical order after completing simple arithmetic operations. In one creative sweep, Stevens demonstrated that a broader conception of science could easily accommodate the uniqueness of social observations without sacrificing traditional scientific rigor. Highest levels of his scale hierarchy, namely interval or ratio data types, demonstrated axiomatic operations logically consistent with the real number system, which, in fact, emulated foundational physical measurement. Lower levels such as ordinal scores were less comprehensive but still logically consistent with computing medians and percentiles.
Stevens’s hierarchy of scale types was immediately absorbed by authoritative professional literature and textbooks, which offered discipline to social researchers by imposing a simple comprehensive logic on both physical and nonphysical measurements. Over the decades, Stevens’s system stimulated challenges and rebukes, which has led to discoveries of additional levels (Cicchetti, 2014; Mosteller & Tukey, 1977; Wright, 1999). Several nontraditional data types are now in fact understood to provide a logical basis for measuring change.
Discontent Among Social Science Researchers
Although Stevens’s (1946) model was supported by physical scientists, many social science researchers expressed derision and disdain for his proposed trade-off between scale levels and statistical operations (Gaito, 1960; Lord, 1953), and others simply dismissed it (Binder, 1984; Gaito, 1980, 1984). While Stevens seemed to have found the magic key to legitimize psychological measurement, the cost to social science researchers was unacceptable. Those rejections are periodically reasserted in contemporary literature, and now, more than 60 years since Stevens’s introduction of scale types, dissension and bitterness continue to ferment, which has ultimately forged the separate branches that now predominate.
Supporters of data types and their restrictive statistical implications questioned validity of computing means and standard deviations with only ordinal, Likert-type ratings (Jamieson, 2004; Knapp, 1990). Townsend and Ashby (1984) demonstrated that population mean differences based on ordinal scores can lead to incorrect results. Other commentators raised concerns about untransformed Likert-type ratings (Harwell & Gatti, 2001), while Mosteller and Tukey (1977) proposed alternative scale taxonomies and recommended rescaling ordinal scores. Thomas (2014) warned that numbers may have properties that influence statistical analyses, and Stine (1989) objected to statistics dissociated from scale type. Other researchers were disparaging of parameter estimation based on only vague interval assumptions (Kuzon, Urbanchek, & McCabe, 1996).
In contrast, those who objected to restrictions conducted empirical studies that suggested parameter estimation under certain conditions was robust to data-type violations (Norman, 2010). Glass, Peckham, and Sanders (1972) demonstrated robustness of F test to data-type violations (see also Davison & Sharma, 1988). Empirical investigation also found Pearson’s product–moment correlations robust to data violations (Havlicek & Peterson, 1976), and others emphasized that arbitrary scale-type restrictions inevitably lead to misleading conclusions (Velleman & Wilkinson, 1993). However, other efforts at demonstrating robustness of ordinal scores were confounded by complexities (Brennan, Yin, & Kane, 2003).
While studies cited above have shown support for weaker ordinal scores, nowhere with exception of Davison and Sharma (1988) did they delineate the limits or clarify boundaries of valid ordinal inference. Consequently, qualified robustness revealed by some studies has gained “blind faith” allegiance among social science researchers, which has led to overzealous if not mindless implementation and wide abuse. In fact, robustness of significance testing with ordinal scores is important, but it does not automatically confer equal intervals on ordinal scores, a widely held misconception. Further clouding validity of much contemporary ordinal analyses is conflation of group and person parameters, which has consequences for interpreting effects of change on individuals.
Contemporary Status
Controversy over miss-inference and measuring change has not prevented social science researchers from adapting ordinal scores for (a) personality and cognitive abilities measurement, (b) survey research, (c) educational testing and accountability, and (d) program evaluation. In addition, a vast majority of psychological research remains committed to ordinal scores sometimes referred to as classical test theory (CTT; Crocker & Algina, 2006; McDonald, 2013; Nunnally & Bernstein, 1994). However, resistance to ordinal score restrictions has not been without costs, which are described in the following sections.
Limitations, Constraints, and Warnings
Amid decades of defiance, the literature now shows a growing chorus of warnings about hazards of ordinal scores. For example, Embretson (1996) warned of spurious ANOVA interactions (see also Kang & Waller, 2005; Romanoski & Douglas, 2002), while Morse, Johanson, and Griffeth (2012) described spurious interactions during multiple regression. Berk, Brown, Buja, and George (2013; see also Berk, 2011) pointed to distortions from computing ordinal means during regression, while Woody and Costanzo (1990) described statistical artifacts. Others described distortions computing effect sizes (Hobart, Cano, Zajicek, & Thompson, 2010), while Dimitrov and Rumrill (2003) found individual treatment effects distorted by ordinal group means. Townsend and Ashby (1984) described uniqueness theorem violations, while Prieler emphasized distorted measures of patient gain (Prieler, 2007; Prieler & Raven, 2008). Kahler, Rogausch, Brunner, and Himmel (2008) described inconsistent parametric estimation, and others (Merbitz, Morris, & Grip, 1989; Wright, 1999; Wright & Linacre, 1989) have long emphasized miss-inference implications of ordinal scores.
In addition to statistical operations described above, a general problem associated with ordinal scores is theoretical fragmentation and proliferation of redundant scales. For example, Streiner and Norman commented on depression measurement and the “daunting array of available scales. Whether one wishes to measure depression, pain, or patient satisfaction, it seems every article published in the field has used a different approach to the measurement problem. This proliferation impedes research” (Streiner & Norman, 2008, p. 5). Consequently, 20th-century social science research became increasingly fragmented and incoherent represented by “narrowly defined sub-disciplines, each pursuing objectives in relative isolation from others” (Richters, 1997, p. 197).
A consequence of decades of undisciplined ordinal score applications is an enormous range of intractable practical problems and limitations. A sample of those issues is represented below:
Construct fragmentation
Scale indeterminacy
Nonfunctional scale magnitudes
Restriction to population parameters
Gain reliability
Conflation of person measures and population parameters
Measuring objective, meaningful change
While each of these issues deserves discussion, the following sections review strategies to mitigate concerns about measuring change with ordinal scores.
Ordinal Strategies for Measuring Change
A central theme of this report is ordinal and linear branches now rationalize separate approaches to measuring gain. Understanding these alternative approaches may increase effective communication with laypersons, as well as provide insight into special measurement issues that might otherwise seem illogical. For example, many contemporary social science researchers show a remarkable insistence on preserving simple ordinal score methods (Thomas & Zumbo, 2012). Some researchers emphasize that ordinal scores have advantages for identifying persons with unusually high or low item response patterns (Cicchetti, 2014; Weiss, 1986), while others suggest improving scores by shifting to ranks (Lloyd & Zumbo, 2007; Lloyd, Zumbo, & Siegel, 2009).
Residualized scores, which embellish ordinal gain with regression-mediated values, have also been proposed to improve ordinal score measurement (Cronbach & Furby, 1970; see also Lord, 1958). Zumbo (1999) emphasized usefulness of simple ordinal gain and residualized scores but rejected impractical multiwave designs (see also Zumbo & Zimmerman, 1993). A reoccurring strategy recommended data transformation (Harwell & Gatti, 2001; Horton & Tennant, 2011). Velleman and Wilkinson (1993) concurred that ordinal scores should be transformed to linear values to support statistical inference. While methods for transformation are available, social science researchers rarely implement them.
Social science researchers have struggled with incorrigible measurement of change problems for virtually the entire 20th century. A relatively recent reaction to these problems is to assert that gain scores and measurement of change are obsolete (Bryk & Raudenbush, 1987; Collins, 1996; Raykov, 1999; Williams & Zimmerman, 1996), and a multitude of statistical models now purport to analyze change rather than measure it. Their central strategy is to construct multivariate correlation models and more complex multilevel models to interpret “rate of change” instead of explicit unit magnitudes (Kissane, 1982). Hierarchical linear modeling (Bryk & Raudenbush, 1987), growth curve models (Willett, 1988, 1994), and multilevel models (Singer, 1998) are examples of this strategy. Other correlation-based procedures are covariance analysis (Cribbie & Jamieson, 2004; Jamieson, 2003; Maris, 1998; Willett & Sayer, 1994), structural equation models (Mun, von Eye, & White, 2009), and latent variable modeling (Raykov, 1999; Zimmerman & Williams, 1982b). Literature is replete with speculation about variance components that contribute to gain reliability (Rogosa, Brandt, & Zimowski, 1982; Rogosa & Willett, 1983; Williams & Zimmerman, 1996).
In general, strategies to analyze change described above should be viewed cautiously, as they tend to distract from fundamental measurement issues. For example, their authors express disdain for pre- and post-assessments and, instead, emphasize collection of multiple observation waves (Rogosa et al., 1982; Willett, 1988, 1994). In other words, these strategies typically require extensive longitudinal designs. Consequently, their usefulness for routine school evaluations is limited and largely impractical for clinical reporting cycles or psychological and health care outcome evaluations. In addition, their dependence on correlations requires distributional assumptions, sample size issues abound, and complications arise from collinearity and normality violations. Categorically, these methods lack an explicit measuring unit, hence they are fundamentally ordinal. Even under optimal conditions, concerns arise about their qualitative meaningfulness compared with objective, linear measures of change (Koskey & Stewart, 2014; Narens & Luce, 1990).
A less well-recognized limitation of multilevel, multivariate correlation models is conflation of persons with groups, which seriously affects accuracy and validity of patient and student evaluations. In addition, published comparisons of these methods are rare, which inhibit critical discussions about them. Investigations by health care researchers have found ordinal-based methods consistently associated with distortions, which discourage their clinical use (Hobart, Cano, Zajicek, & Thompson, 2007; Norquist, Fitzpatrick, Dawson, & Jenkinson, 2004; Stucki, Daltroy, Katz, Johannesson, & Liang, 1996). These reservations aside, correlation-based statistical methods to analyze change represent an important movement to reform social science methods to better accommodate developmental and performance measurement. Despite their limitations, statistical models now provide an alternative to simple gain scores and may be useful for identifying significant long-term change if not precise magnitude.
Important exceptions to above criticisms are hierarchical linear models, which explicitly implement a linear unit (Bryk & Raudenbush, 1987). “In our example we used item response theory (IRT) to construct a common metric for each test, in logits, specifically to facilitate measurement of change” (p. 150). Readers should note that their reference to IRT refers to one-parameter logistic because two-, three-, and four-parameter IRT models are ordinal (De Ayala, 2008). Other statistical strategies with an explicit measuring unit are GLM (Nelder & Wedderburn, 1972) and general additive models, which implement mathematical link functions (Poisson, gamma, Bernoulli, and binomial) to transform ordinal scores to linearized units.
Linear Measurement Models
Measuring change in the 20th and 21st century without a scientific unit of measure has been an ongoing catastrophe for social science researchers filled with denial and resistance, as well as creative adaptation and innovation. In fact, data-type and scale properties are no longer formally recognized in published professional measurement guides (American Educational Research Association, American Psychological Association, & National Council on Measurement in Education, 1999), which is not surprising because the central priority of mental testing has historically been rank order selection not measuring change. Only urgency from contemporary practical needs to measure learning and growth has forced recognition of limits and constraints of ordinal scores. For some, this legacy has led to frustration and resignation as well as visions of future developments, which is captured by the following quote:
Instead of relying on classical test theory ideas about reliability, it is time to develop . . . practical instrument(s) . . . designed for measurement of change . . . Development of these approaches will be a challenge. . . . They must find a way to distinguish real change over time from random fluctuations . . . masquerading as change. (Collins, 1996, p. 291)
By 1950s, a linear path to measuring change was finally opened with Rasch models (Rasch, 1960/1980; Wright & Stone, 1979). Around this time, mathematical philosophers finally clarified logical foundations for nonphysical scientific measurement with probabilistic simultaneous conjoint additivity theory (Luce & Tukey, 1964), which brings subjective measurement in line with classical criteria such as additive, concatenated units. Social measurement models under this theoretical framework now demonstrate additive units in a probabilistic framework and explicit empirical operations for corroborating qualitative sensory experiences with them. In other words, through an articulation between logic and empirical operations, both logical structure and meaningful qualitative relations can now be established between numerical scale magnitudes and perceived experience. Instead of frustration, educational and psychological measures are now commensurable with traditional scientific methods when empirical observations fit conjoint additive models.
Major linear model elaborations of Rasch models to measure change are now also provided by multidimensional random coefficients multinomial logit model (Adams, Wilson, & Wang, 1997), general multicomponent latent trait model (Embretson, 1984), linear logistic test model (Fischer, 1973), and linear logistic model for measuring change (Fischer, 1976; see also Cristante & Robusto, 2007). They represent a class of probabilistic measurement models distinguished by linear units that support axiomatic scale operations with modest sample requirements and few assumptions.
Present Research
Studies of Change
Studies comparing ordinal and linear units have found distortions in upper and lower tails of ordinal scores with implications for measuring change (Bezruczko, 2004; Wright, 1999; Wright & Masters, 1982). Their dependency on population parameters raises concerns about objectivity. In contrast, objective linear units transcend populations because their link functions are mathematical abstractions, which assert universal applications. Consequently, mathematical measurement models, in principle, offer measures that are not limited by available sample observations.
Despite mathematical differences between ordinal and linear units, prior studies seemed to support at least limited interchangeability for describing change (Bezruczko & Fatani, 2010. Several general principles from that research follow below:
Pre–post differences. When pre- and post-test ordinal differences were near test mid-range, simple gains typically corresponded well to linear gains.
Items on target. Test targeting strongly influenced ordinal and linear correspondence. Ordinal scores and linear measures were very consistent when item difficulties were aligned with sample ability, which tends to diminish scores in distribution tails.
Variability of gain. Uniform ordinal gains between pre- and post-assessments corresponded well to linear gains, while highly variable ordinal gains, in general, did not.
Predictable distortions. Ordinal gains in upper and lower score distribution tails were predictably inconsistent with linear gains. Ordinal scores in lower tail generally overestimated gain, while scores in upper tail underestimated gain. These results are consistent with published reports (Wright, 1999).
In general, key limiting conditions on correspondence between ordinal and linear were initial (pre-test) scores, amount of gain, and test difficulty. Very low and very high pre- and post-test scores presented major inconsistencies with linear gain. Otherwise, results cautiously supported interchangeable use of linear and ordinal scores to describe gains.
Purpose
Present research reexamined summary presented above by comparing three widely implemented methods of measuring gain, namely ordinal scores, residualized raw scores, and Rasch model linearization of ordinal scores. An intention was to demonstrate through graphical comparisons comparable patterns of ordinal and linear gains, which could support their complementary use for reporting change or gain.
First, results from these gain methods (ordinal scores, residualized gains, and linear Rasch logits) were compared for a locally developed, standardized preschool skills survey that had been parameterized, then supported by reliability and validity studies. Raw score summation then provided a total score for computing simple gain and residualized gain, which is also a sufficient statistic for estimating Rasch model parameters. These methods then were compared for a nationally normed, commercially produced preschool assessment. Present research addresses the following questions:
Ordinal scores versus linear gain: Are preschool gains between fall and spring based on ordinal scores, residualized scores, and linear measures generally comparable? Do their differences affect objective, numerical descriptions of student gain? In the broader context of health care evaluation, would these differences have implications for measuring patient status?
Situational determinants. Under what conditions might ordinal and linear gain measures be interchangeable? What practical rules might guide their complementary use for reporting purposes? Conversely, what violations or limitations restrict their validity?
Method
Sample
Assessments were collected from more than 1,500 randomly selected children attending urban neighborhood preschools in Chicago, United States (4-year-olds, n = 1,548; N ~ 25,000). Preschools were first randomly sampled across preschool programs (Head Start, Preschool for All, Community Partnerships, etc.) and stratified by race and income, then 4-year-old children were randomly selected from each preschool. In general, preschools were located in socioeconomically disadvantaged, multicultural neighborhoods. Ethnic composition was distributed almost equally across Whites, African Americans, Hispanics, and Asians. Approximately half of children were from non-English backgrounds. Only children enrolled both fall and spring were included in this research.
Data
District-based preschool learning assessment
Preschool Mini-Assessment (PMA; Caradine & Borger, 2010) was developed by the Office of Early Childhood Education, CPS, to improve alignment between preschool learning and assessment goals. PMA consists of 18 standard interview items organized around several preschool activities conducted with props and manipulates. This emphasis on an engaged interview format diminishes random responses, which is especially problematic with preschool children. PMA items are distributed equally across the following content: (a) sound and letter identification, (b) rhyming, (b) sorting, (c) comprehension, (d) print awareness, and (e) story retelling, which were systematically sampled from State of Illinois, Department of Education learning domains. In addition, children were requested to write their name; hence, name writing was also scored. Expert judges confirmed that skill sequences were representative of learning in CPS preschools.
Most PMA items were dichotomously scored (0/1) though two items required polytomous scoring (0, 1, 2, 3, and 4). Maximum PMA score was 24 points. Factor analysis during scale development yielded a single dominant dimension (eigenvalue = 4.7), and PMA score reliability (alpha) with this population is typically moderate (~.80). Concurrent and criterion validation correlations with Woodcock–Johnson and Peabody Picture Vocabulary Test (PPVT) are consistently positive, between .30 and .40, which supports unique structure.
Norm-referenced standardized achievement test
Woodcock–Johnson III (WJ III) is a commercially prepared assessment of preschool learning that was based on Rasch measurement principles of explicit, linear units (McGrew, Schrank, & Woodcock, 2007; Woodcock, Schrank, Mather, & McGrew, 2007). Children are individually presented table-top flip charts and directed “to point” at specific images. Word Letter Identification subtest (76 items) was selected from the achievement battery for this research. Item responses were scored dichotomously (0/1), and number correct was summed for total score. According to published documentation, WJ III validity was based on developmental predictions that were empirically examined in a national sample during test development. Its property of equal interval units defined by a hierarchy of items was the central purpose for including it in this research.
Procedure
Identical PMA observations were collected at fall and spring assessments. Trained PMA evaluators met with individual children and marked responses on a standard interview form. WJ III was also collected in fall and spring according to standard manual procedures.
Analysis
Measurement of change was calculated by three methods: (a) ordinal (spring–fall) gains, (b) residualized raw score gains, and (c) linear Rasch model measures. Both raw score deltas and residualized gain methods continue to be recommended for measuring change (Llabre, Spitzer, Saab, Ironson, & Schneiderman, 1991), and social science research literature is replete with contemporary applications (Salkind, 2010).
Missing values
High transiency in socioeconomically disadvantaged neighborhoods presented issues concerning missing values. After reducing data to children only present at both fall and spring assessments, remaining cases of PMA scores missing at random were less than 10%. They were addressed with mean substitution. PMA mean comparisons before and after imputation did not show significant differences.
Ordinal gain
In this research, simple difference scores were calculated, where X = pre-test score, Y = post-test score, and D = difference score (Zimmerman & Williams, 1982a):

and they show reliability of gain can be high for effective treatments that demonstrate incremental increase in true score variance of Y. Zimmerman and Williams (1982a) also provide the standard error of simple differences:

where λ = σx / σy, reliability of X = ρxx′, and reliability of Y = ρyy′.
Residualized gain
Residualized gain was described by Cronbach and Furby (1970) and others (Lord, 1967; Manning & Dubois, 1962; Webster & Bereiter, 1963; Williams & Zimmerman, 1982; Williams, Zimmerman, Rich, & Steed, 1984) to remove pre-test variation from post-test scores, so “true” gain remains:
Residualizing removes from the posttest score, and hence from the gain, the portion that could have been predicted linearly from pretest status. One cannot argue that the residualized score is a “corrected” measure of gain, since in most studies the portion discarded includes some genuine and important change in the person. The residualized score is primarily a way of singling out individuals who changed more (or less) than expected. (Cronbach & Furby, 1970, p. 74)
Residualized gains are more complicated than simple gain because an artificial linear construct, Y′, is defined by the regression of X on Y. Then, the residuals, Y – Y′, which are uncorrelated with X and presumably related to true gain, are commonly substituted for observed gains, Y − X. The residual gain model in this study was discussed by Zimmerman and Williams (1982b), where Y′ is the regression of X on Y:

where E denotes the expectation of post-test scores Y, Var is the variance of pre-test X, and Cov is their covariance (Zimmerman & Williams, 1982b). Rogosa et al. (1982) implemented this model to estimate Y′, and a residualized gain score was obtained from Y − Y′.
Rasch model foundations
Rasch models were originally developed for transforming ordinal scores to objective, linear measures (Rasch, 1960/1980). Rasch models require a Guttman data structure, which is already familiar to early childhood researchers (Puranik & Lonigan, 2011). Guttman scales, however, assume an unrealistic deterministic relation between scores and human behavior that is addressed by probabilistic Rasch models (Andrich, 1985, 1988; Wilson, 1989). Specifically, Rasch models implement an empirical concatenation procedure called simultaneous probabilistic conjoint additivity during Rasch model parameter estimation, which constructs a measurement dimension conforming to classical scientific traditions purportedly with “fundamental” properties (Michell, 1986, 1999). In addition, an important property of Rasch models is statistical separation of items and observations (responses) during estimation, which establishes a framework useful for monitoring item invariance, while allowing a separate child parameter sensitive to growth and learning to vary.
First, WJ III ordinal scores were transformed to linear probabilistic item and person parameters with a Rasch model for dichotomous items (Wright & Stone, 1979, see also Wright, 1997). Following expression presents probability of passing an item when WJ III responses are dichotomously scored (0/1):

where probability of person n responding 1 to item i is represented by the parameterized differences between person ability β n and item difficulty δ i divided by its inverse [1 + exp(β n – δ i )]. It can be shown from this formulation that students’ total test scores can be transformed to locations on a common, linear scale where log-odds (logits) represent uniform unit increments of child ability and item difficulty. Fall and spring assessments were not statistically equated but calibrated simultaneously in a stacked data file with Winsteps software (Linacre, 2015).
PMA scores were transformed with a Rasch model for rating scales, which, like the dichotomous model, is mathematically based on differences between β and δ (Wright & Masters, 1982). The rating scale model, however, also estimates τ j which is a rating scale step parameter. Tau is the ability needed to pass from one rating category to the next, and PMA rating steps j ranged from 0 to 5. PMA scores were linearized with the following expression:

where β = child ability, δ = item difficulties, and τ = rating scale thresholds for j categories. Πnix is the probability child n will be rated in category x on item i, where x takes a value from a fixed range (j = 0, 1, 2, 3, 4, 5, . . . m), m = number of response thresholds or steps for an item, and k = ith step. Model prediction (P) for each item and observed ratings (O) are statistically analyzed for significant departures from expectation (O-P) and their differences are standardized by the estimated binomial standard deviation and examined with an aproximated chi-square (see Wright and Stone, 1979).
Regression on linear gain
Following model was implemented to investigate statistical relations of ordinal gains and residualized gains with linear gains:

where Y′ = linear gain computed after transformation of ordinal gain to logits, X1 = ordinal gains, X2 = residualized gains, X3 = fall ordinal scores, X4 = spring ordinal scores.
Results
Rasch Model Calibration
Ordinal scores in this research were linearized with a Rasch model, which mathematically transforms ordinal scores to log-odds or logits with a one-parameter logistic function. Consequently, a high priority was confirming statistical fit of both items and children to the measurement model. Results here found virtually no evidence of misfitting children, which is not surprising given the highly controlled procedures for collecting child responses—both PMA and WJ III responses were collected by technicians with scripted instructions. However, item fit evaluation found four PMA items with significantly larger than expected standardized fit t values, and they were deleted from this study. Therefore, Figure 1 presents transformation of PMA, as well as WJ III, ordinal scores to linear measures after deleting PMA misfitting items. Otherwise, PMA here demonstrated typical ogive relations between scores and linearized values, while WJ III shows somewhat higher than expected correspondence, r = .99.
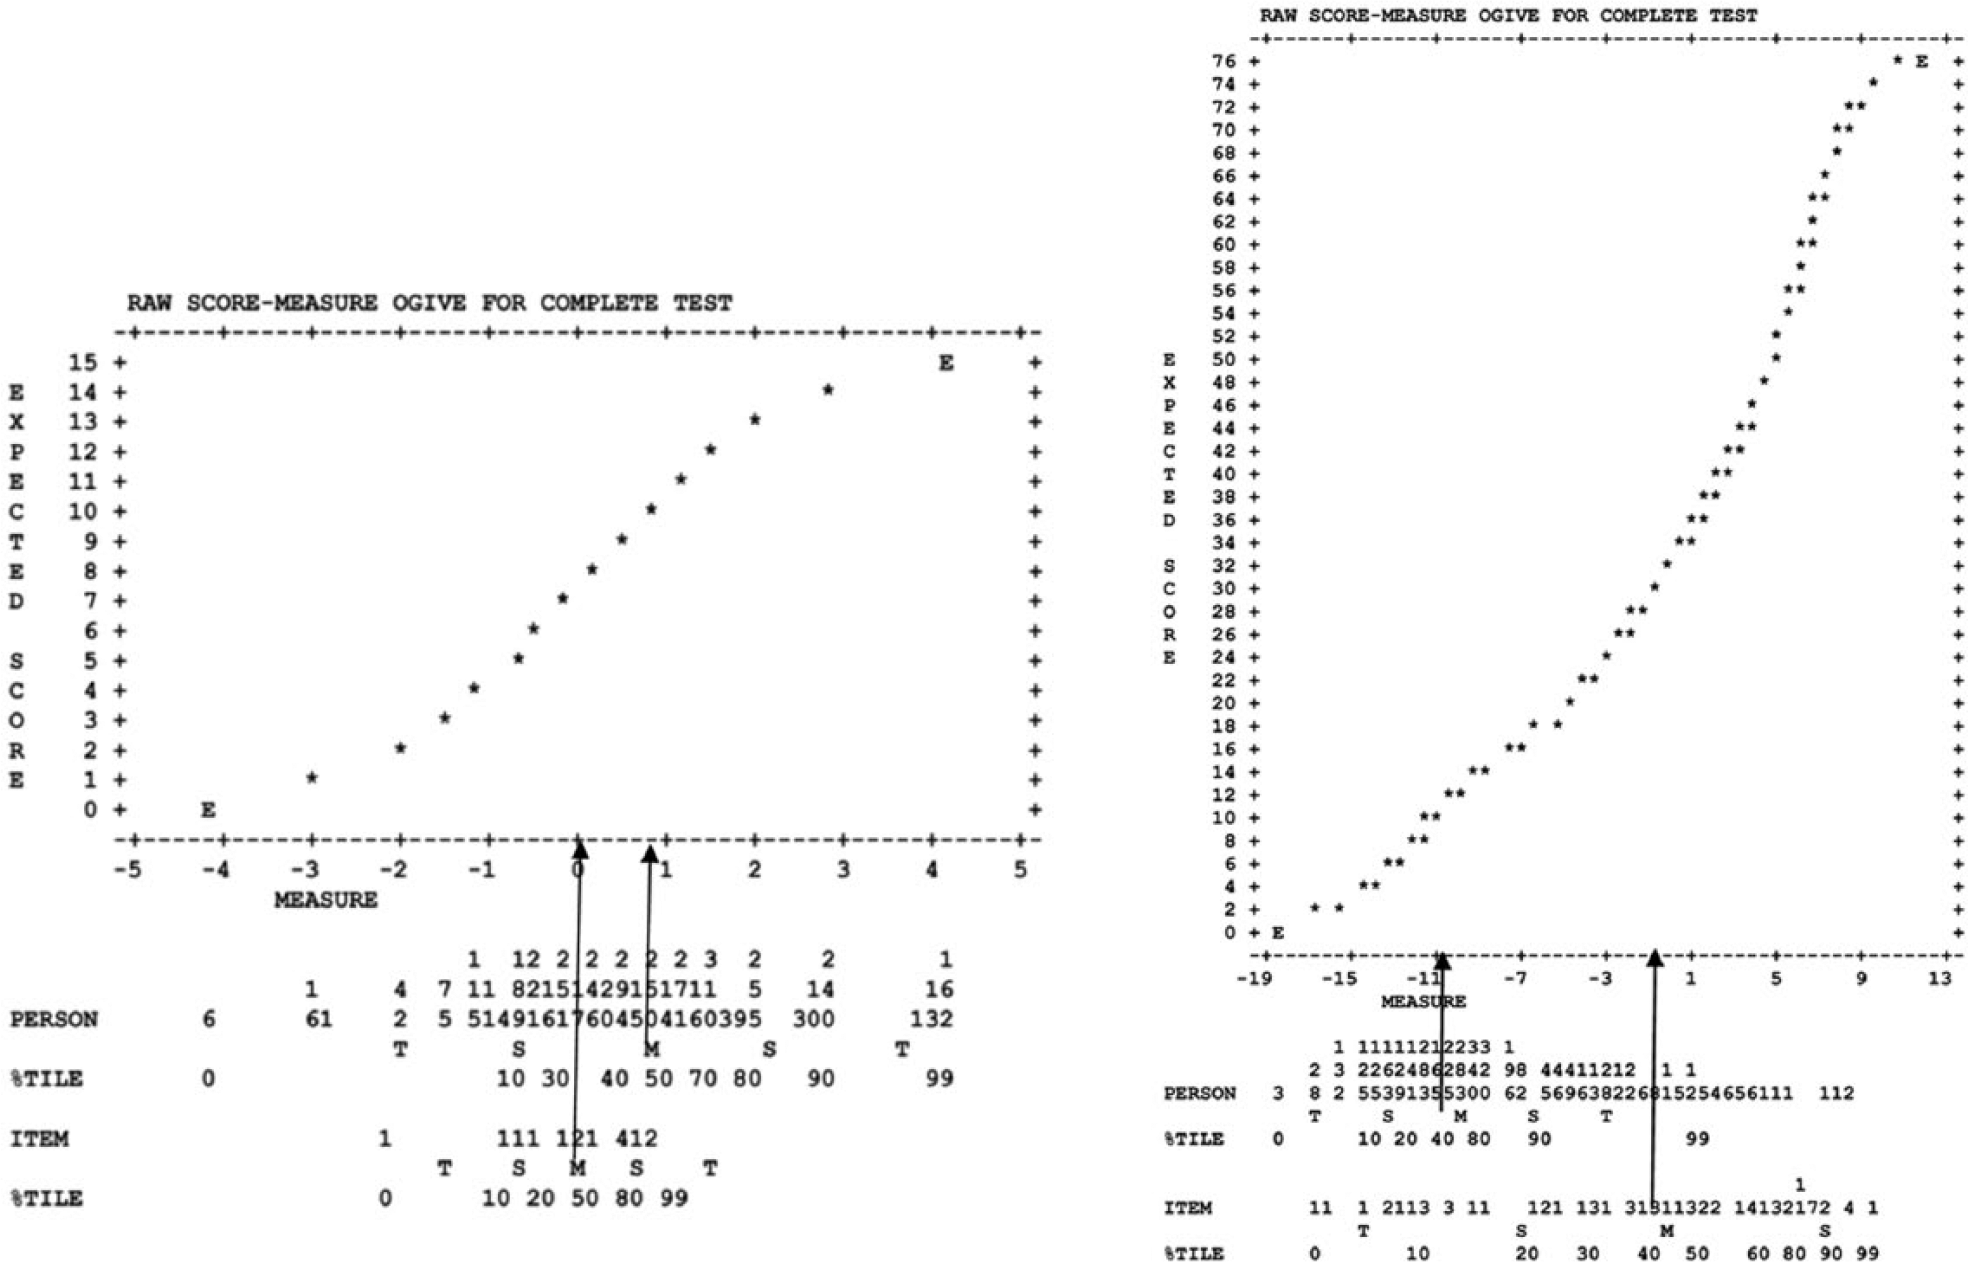
“Scores to measures” plot showing PMA and WJ III ordinal scores transformed to logits.
Another Rasch model concern was construct comparability between fall and spring assessments (see Engelhard, 2013). Figure 2 presents empirical corroboration of the measurement construct, which shows 12 of 15 PMA items statistically invariant with 95% confidence, and similar results were obtained for WJ III. These results demonstrate replication of the PMA item hierarchy between fall and spring, which is essential for valid measurement of learning and growth. Finally, another concern was clarification of dimensionality threats presented by item dependencies, which were investigated with principal components analysis of Rasch model residuals after item calibration. Those results revealed that only 7.8% of total item residual variance was associated with nonrandom structures, which support item independence. Residual analysis summary, as well as other results describing Rasch model parameterization, is elaborated in a supplement to this report.

Bi-calibration (logits) plot of fall and spring PMA items.
Summary of Scores and Measures
Table 1 presents fall and spring PMA and WJ III assessment results. In general, scores were normally distributed, but WJ III results were very low though without floor effects. As expected, average spring scores were significantly higher, and respective fall and spring total score correlations were positive. In general, PMA and WJ III standardized effect sizes were comparable between ordinal and linear methods. Alpha reliability was higher for WJ III (>.90) than for PMA (.76).
Summary of Scores and Measures.

Note. Sample sizes for PMA and WJ III were 1,548 and 1,522, respectively. Stand. ES = standardized effect size and was computed using (Y – X) / [(SDY + SDX) / 2; PMA = Preschool Mini-Assessment; WJ III = Woodcock–Johnson III, where X = fall and Y = spring scores. Gain = (Y – X) Maximum PMA total score is 15 points, and WJ III Word Letter Identification subtest total score is 76 points.
Missing values: Mean substitution was imputed for ordinal scores missing at random. Expectation Maximization (EM) algorithm was implemented in Winsteps software during Rasch model parameter estimation to impute missing values (Linacre, 2015).
Four misfitting items were deleted during Rasch calibration of PMA items. Therefore, PMA is represented by 15 items.
Correlations Between Fall and Spring
Table 2 elaborates correlations, and, as expected, PMA ordinal scores and logit measures between fall and spring were positively correlated at .62 and .62, respectively. In addition, PMA fall ordinal scores were correlated with fall logits, .98, and spring ordinal scores were highly correlated with spring logits, .96.
Correlations Among Simple Ordinal Scores, Residualized Scores, and Rasch Logit Measures.

Note. PMA (n = 1,548) and WJ III (n = 1,522), logits were estimated with a Rasch model. All gains represent Y – X, X = fall and Y = spring. Residualized gain was defined by (Y − Y′), where Y′ is predicted by regression of X on Y. PMA = Preschool Mini-Assessment; WJ III = Woodcock–Johnson III.
Fall WJ III ordinal score correlation with fall logits was very high, .99, while spring ordinal scores and spring logits were correlated at .97. As expected, residualized scores, which are deviations from predicted values when X (fall) was regressed on Y (spring), were uncorrelated with either fall ordinal scores or logits. Moreover, PMA and WJ III fall ordinal scores presented very high correlations with predicted values, Y′, .998 and 1.0, respectively.
Correlations With Gain
In general, fall scores and logits showed negative correlations with gains though WJ III correlations might arguably be considered random. Negative gain correlation with initial status appears in the literature (Rogosa & Willett, 1985), but systematic differences in magnitude between ordinal and linear values have not been reported. PMA and WJ III ordinal gains correlated with logit gains at .93 and .94, respectively.
Residualized score correlation with PMA ordinal gain was positive at .85. As expected, correlation of residualized scores with fall scores and logits was .0. Correlation of residualized scores with WJ III ordinal gain was also positive but unexpectedly high, r = 1.0. However, both PMA and WJ III ordinal gains presented negative correlations with Y′, though PMA was significantly stronger, r = −.53. In other words, while Y′ defined a positive linear relation between X and Y, differences between Y and X (Y − X) tended to decrease. In concrete terms, as the convergence of X and Y on the regression line defined a linear predictive construct, Y′, fall item difficulties increased; hence, magnitude of gain for this sample declined.
Regression on Linear Gain
Stepwise regression of ordinal gains and residualized scores on linear gain (logits) accounted for 86% of logit gain variance (R2 = .86). However, residualized scores and ordinal gains also demonstrated unique contributions (sr2 = .08 and .42, respectively), which were statistically significant (p < 001). Their unique contributions suggest gain fragmentation during PMA assessment. In contrast, unique variance could not be associated with either ordinal or residualized scores when regressed on WJ III linear gain though R2 was higher, 88%. These results, especially fragmentation of PMA linear gains, raise a question whether underlying unit structure influences agreement among methods of measuring gain. Table 3 presents regression results.
Regression of Ordinal and Residualized Gains on Linear Measures (Logits).
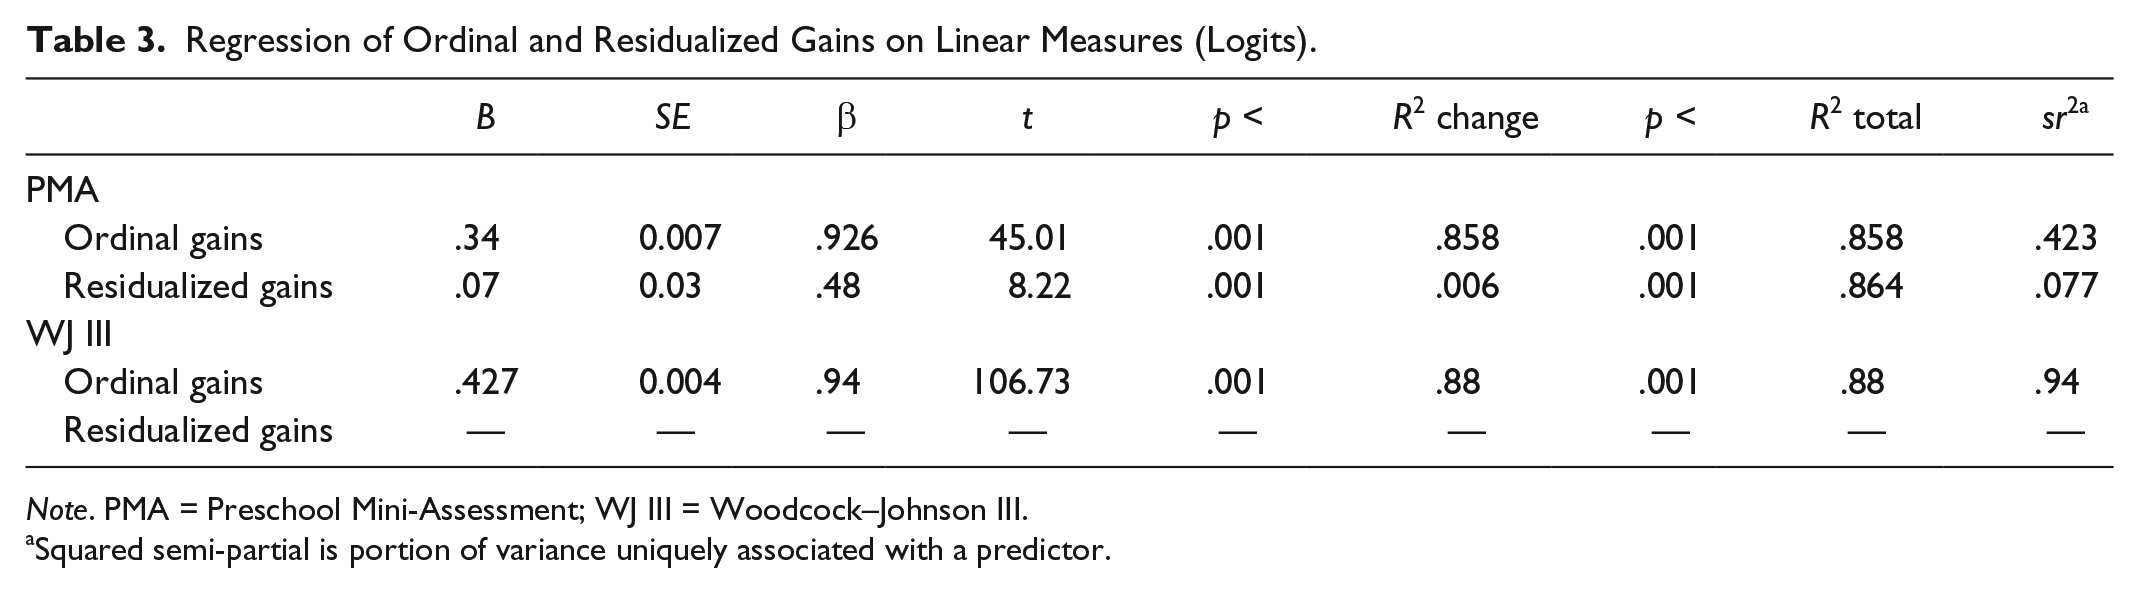
Note. PMA = Preschool Mini-Assessment; WJ III = Woodcock–Johnson III.
Squared semi-partial is portion of variance uniquely associated with a predictor.
Intra-Child Change
Figure 3 presents ordinal scores and logits between fall and spring assessments. In general, PMA logits were denser around the mean than ordinal scores, and higher and lower scoring children were systematically located further out from the mean, which would be consistent with intended score correction in upper and lower tails during ordinal score transformation. In general, WJ III results showed substantial negative skew of scores and measures, and relatively few children shifted from low to high between fall and spring assessments. Shape and form of WJ ordinal scores appear somewhat more consistent with linear measures than PMA.

PMA and WJ III intra-child change.
Ordinal Versus Linear Gain
Figure 4 offers additional insights into ordinal and linear gain measurement by plotting respective PMA gains for each child between fall and spring. In general, logit gains show a range of corresponding ordinal gain values. For example, children with exactly 0 logit gain show a range between 0 and 1 ordinal score gain, but surprisingly, several children with 0 ordinal gain demonstrated positive logit gain. Recall that ordinal scores uniformly assign 1 unit (point) to every item, while logit estimation is governed by a mathematical function, which assigns values based on item difficulty—more difficult items have higher item logit values. In other words, simple gain is “disembodied” from the context of total scores and marginal gain, which creates an entity independent of underlying scale magnitude. Consequently, ordinal gain gathered from across the ability range can be represented together for any measure of linear gain. Nonetheless, these results show surprising consistency between ordinal score gain and cumulative logit gain. Approximately, three items were needed to demonstrate continuous positive PMA gain across the parameterized construct.

PMA ordinal gains plotted with logit gains.
Figure 5 presents WJ III results, which show that 0 ordinal score gain here corresponded exactly to 0 logit gain and, in general, positive ordinal score gain corresponded to positive logit gain. Moreover, 10 points of ordinal score gain corresponded to a range of linear gains between 3 and 7 logits. Exact relationship for any particular child again depended on initial fall status and specific item difficulties. Children with lower initial ordinal scores corresponded to lower logit gains, while those with higher initial scores corresponded to higher gains because those children probably passed items of much higher difficulty. These results indicate reasonable gain correspondence between WJ III ordinal and linear values of almost 15 ordinal score points. This relation between ordinal scores and linear units, however, “breaks up” around ordinal gains of 25 points, which is probably an artifact of this less able sample.

WJ III ordinal score gains plotted with logit gains.
Residualized Scores
Figure 6 presents residualized scores with ordinal and logit gains, respectively. As expected, residualized scores presented generally positive relations with ordinal and logit gains. There is some question here whether the obtained high positive correlation between residualized and ordinal gains may be mediated by the higher positive correlation between fall ordinal and Y′. Predicted Y′ here was identical to fall ordinal scores (r = 1.00); hence, residualized gains (Y − Y′) would be identical to ordinal gains (Y − X).

Residualized gains plotted with ordinal and logit gains, respectively.
Discussion
Measuring change is central to scientific investigations, and prominent in growth and learning studies, psychological appraisal, and PROs. In the 1950s, Cronbach brought attention to individual change and seriously questioned whether it should be measured. That period of doubt has passed, and Western societies have shifted to a post-industrial economy where measuring change is fundamental to efficiency across education, psychology, and health care. Measurement of human capital, its formation, infrastructure, and return are dependent on accurate measures of change. Tension between technologies that address those needs and reasonable layperson expectations to understand methods of measuring gain in common sense terms has motivated this research. A central goal here is to clarify correspondence between ordinal and linear gains during early childhood and preschool assessments.
Social science research methodology for most of the past century has tended to dismiss underlying irregularities of ordinal scores, specifically distortions in upper and lower distribution tails, by emphasizing robustness of group parameters in statistical analysis. For empirical applications that emphasize static performance relative to norm groups, this strategy may be surprisingly adequate. In general, results here suggest that ordinal score status associated with dichotomously scored items can be meaningfully described to laypersons if appropriate verification has been conducted with a mathematically defined linear model. Present research, in fact, endorses ordinal score reports when they demonstrate convergence with linear measures. In this research, ordinal scores were found to be virtually indistinguishable from linear measures, which offers convenient opportunities for simple measurement of growth and learning.
Study Questions
Learning in fact did not occur across the entire PMA ordinal gain score range. For example, children showing less than three items of PMA ordinal gain between fall and spring probably did not demonstrate learning though ordinal score differences were positive. However, once three PMA items were reached, relations between PMA ordinal and linear gains were surprisingly uniform. Likewise, WJ III ordinal score and linear gains showed even broader agreement. WJ III gain between 0 and 25 ordinal items demonstrated a monotonic correspondence to linear gain between 0 and 18 logits. This correspondence did not degrade until gains reached upper WJ III levels, which probably reflects ability influence of this sample on statistical range. In general, this research found useful correspondence between ordinal and linear gains across major portions of the PMA and WJ III achievement dimensions.
Negative correlation with gain
A negative correlation between fall PMA and gain, both scores and measures, indicated that some students with low fall scores demonstrated proportionately more gain than higher ability students. PMA negative correlation here was exacerbated by many children scoring low at both fall and spring assessments where ordinal and linear values present their greatest discrepancy. While counterintuitive, this relation between ability and gain frequently occurs in education because difficult items require more ability than easier items, but socioeconomically disadvantaged samples have fewer higher ability children to pass them. As the response distribution shifts between fall and spring, challenge of more difficult items for lower ability children becomes apparent and gain declines. In addition, less able children frequently show “surges” on easier items at initial assessment, which give an illusion of large, immediate ordinal score gains because ordinal score units are smaller. A similar problem occurs with PROs in health care when lower functioning patients are targeted for intervention. Distortion in lower ordinal score tail would give an illusion of effective patient treatment.
In contrast, WJ III alleviated negative gain correlation by providing children ample opportunities to pass items within their ability zone. Although this sample was very low, WJ III consists of many items directly targeting lower ability, which virtually eliminated the negative correlation of initial status with gain.
Residualized gains
A rationale for residualized scores is to shift the measurement framework from differences between post (spring) and initial (fall) status assessment to post-assessment and the regression line, which conveniently eliminates negative correlation between initial status and gain described above. The regression line imposes uniformity on initial status without destroying the underlying order necessary to represent valid change. In this research, WJ III ordinal and linear units were so highly correlated that fall ordinal and Y′ were identical, which eliminated initial status, so ordinal gain was equal to residual gain. In other words, results here suggest that under conditions of high initial correlation and uniform units, ordinal and residual scores converge on linear units. These results point to dramatic coherence among these three perspectives on measuring change, opening the possibility of theoretical integration of mathematical measurement with GLM, which currently lacks a measurement theory.
Ordinal and linear disagreement
Results here suggest the question of comparability between ordinal and linear measures should be considered cautiously. Disagreement between ordinal gain, residualized scores, and linear gain was roughly 10% to 15% when items are scored dichotomously, and practical implications of these differences have not yet been explored. A consequence is general principles to guide an articulation between scores and measures are still weak. Although correspondence between ordinal and linear gains was remarkably high, that correspondence depended on several conditions that may vary unpredictably sample to sample and are profoundly influenced by instrument properties. This research proposes several rules to improve correspondence between ordinal scores and linear measures for describing gain:
Minimize off-target assessments. Off-target assessments especially with low-performing samples tend to inflate raw score gains between fall and winter, while underestimating gain for higher performing cases. Unless units are highly regular, off-target assessment does not support complementary ordinal and linear gain interpretations. Much of what currently is considered ordinal score gain in educational studies and program evaluation may be simply off-target samples confounded by unequated assessments. This issue is especially pernicious for lower scoring populations where this combination leads to an illusion of growth and learning when there may be none and makes virtually any intervention look marginally effective.
Evaluate correspondence. Assessments that rely predominantly on ordinal score descriptions should conduct empirical studies that establish minimum number of score points corresponding to linear gain in context of item standard errors. These results then can provide logical foundations for communicating gains and learning in ordinal score units.
Standards for ordinal score assessments. The simplicity and intuitive appeal of ordinal gains understandably support their use throughout the social sciences. Consequently, some development of standards could improve consistency if not transparency of measuring change with ordinal scores, as well as establish greater sensitivity to sample characteristics and instrument properties.
In conclusion, ordinal scores and linear units fundamentally differ, yet results reported here were surprisingly coherent about the possibilities and opportunities to articulate gains between them. The separate sciences that rationalize these methods, in principle, need not create irresolvable conflicts. These results, in fact, suggest the inherent order of scores and ratings and rigorous precision of exact linear units can articulate simple gains in a meaningful and transparent manner. Further empirical investigations are encouraged to better understand the conditions that optimize their correspondence, and clarify their agreement, which should alleviate the cloud of confusion that has shrouded social science research for many decades. This shift to understanding should make their correspondence explicit hence clarify their respective contributions to the growth of scientific knowledge.
Future Research
Future studies are needed to clarify contextual characteristics that mediate ordinal gain scores. Replication of present research with child samples of higher ability and broader socioeconomic background would clarify generality of correspondence between ordinal scores and linear measures found here. Likewise, agreement of gain methods and implications should be investigated further with rating scales and Likert-type responses, which are widely assumed to have linear properties but without objective empirical foundations.
While general importance of these results for health care was emphasized in this report, future studies are needed with dedicated patient populations. Chronically ill samples and highly skewed symptom populations present substantial challenges to simple gain measurement. In general, additional studies of gain measurement are needed for insights they may provide into the current reproducibility crisis reported in behavioral research (Open Science Collaboration, 2015).
Footnotes
Acknowledgements
The authors are deeply thankful to the Office of Early Childhood Education, Chicago Public Schools, for these data. They gratefully acknowledge assistance provided by Richard M. Smith analyzing Preschool Mini-Assessment score linearization in this research.
Authors’ Note
Portions of this article were presented at the 75th annual meeting of National Council on Measurement in Education in San Francisco.
Declaration of Conflicting Interests
The author(s) declared no potential conflicts of interest with respect to the research, authorship, and/or publication of this article.
Funding
The author(s) received no financial support for the research and/or authorship of this article.