
Abstract
This study analyzes the effect of the pay gap in salary-per-contribution on employee work efficiency, where salary-per-contribution is the ratio between an employee’s annual salary and his or her contribution to the organization. We find that the efficiency of employees with above-average salary-per-contribution decreases as the difference from the average increases. However, the efficiency of employees with below-average salary-per-contribution increases as the difference from the average increases. Furthermore, the degree of team cooperation mediates the relationship between the pay gap and work efficiency, which is more prominent among low-salary or non-starting players. These conclusions are generally consistent with comparisons of the effects of salary variations in organizations and by industry.
Plain language summary
The purpose of our article is to analyze the effect of pay gap on employee work efficiency. Pay gap is calculated by salary-per-contribution, which is the ratio between an employee’s annual salary and contribution to the organization. This study used NBA player salary data and efficiency value data from the ESPN website and player characteristics and technical statistical data from the Basketball Reference website. We employed ordinary least squares regression method to test the relationship between pay gap and employee work efficiency. We find that the efficiency of employees whose salary-per-contribution is higher than the average level decreases as the difference from the average increases. However, the efficiency of employees whose salary-per-contribution is lower than the average level increases as the difference from the average increases. Furthermore, the degree of team cooperation mediates the relationship between pay gap and work efficiency, being more prominent among low-salary or non-starting employees. These conclusions are generally consistent with comparisons of the effects of salary variations in other organizations and industries. The implication is that every organization should consider the response of different types of employees to salary unfairness not only to balance the pay gap between employees according to contribution to the organization but also to raise the salary of those who have a stronger reaction to salary unfairness in order to pacify them. The limitation is that the differences between the findings of this study and those of prior research cannot be entirely attributed to the inappropriate measurements present in previous studies.
There is a saying that money can make the mare go. Is this true in real life? Pay is the most important tool by which organizations can incentivize employees. The incentive effect is determined by the pay of not only a single employee but also all other employees within the same organization and industry because employees often compare their pay with that of others. According to social equity theory, employees perceive unfairness when the ratio between their pay and labor input differs from that of others (Adams, 1965). This perception may affect employees’ feelings toward their work (Card et al., 2012; Ferrer-i-Carbonell, 2005; Lang et al., 2011; Pfeffer & Langton, 1993; Poggi, 2014; Zhang et al., 2022), causing changes in their attitude toward work and level of effort (Bartling & von Siemens, 2011; Brown et al., 2016; Charness & Kuhn, 2007; Pfeffer & Langton, 1993; Sila, 2012; Xu et al., 2017). These changes influence work efficiency, ultimately affecting organizational performance. The pay incentive effect is largely determined by the direction in and degree to which pay variations affect employees’ work efficiency and organizational performance. Thus, the economic effect of salary variations is an important issue that organizations must consider when signing salary contracts with employees.
Most studies on the economic outcomes of salary variations were conducted at the organizational level, primarily exploring the influence of organizational salary variation on organizational performance or output (Bartling & von Siemens, 2011; Dai et al., 2017; Hibbs & Locking, 2000; Luo et al., 2020; Mahy et al., 2011a, 2011b; Osiichuk, 2022; Przychodzen & Gómez-Bezares, 2021; Rouen, 2020; Shaw et al., 2002; Trevor et al., 2012), without investigating employees’ response to salary variations in depth. Thus, we lack an understanding of how salary variation influences organizational performance. Studies conducted at the employee level sought to overcome this type of insufficiency by investigating how salary variation influences employee sentiments, behavior (Brown et al., 2016; Card et al., 2012; Charness & Kuhn, 2007; Ferrer-i-Carbonell, 2005; Lang et al., 2011; Pfeffer & Langton, 1993; Poggi, 2014; Sila, 2012; Zhang et al., 2022), and work performance (Fabel et al., 2013; Harder, 1992; Pfeffer & Langton, 1993; Xu et al., 2017; Zhang et al., 2022). These prior investigations either used absolute salaries to calculate salary variation and did not consider employee effort, or assumed that all employees exert equal effort, leading to biased results (Scheer et al., 2003). Adams (1965) pointed out that when making social comparisons, the use of input–output ratios is more suitable than the use of a single output; however, because prior studies did not distinguish between employees’ contributions, they did not measure the fairness of salaries accurately. For US National Basketball Association (NBA) teams, it is possible to identify the contribution of each player to the team clearly and accurately, making it possible to measure variation in their salaries and solve the problem of measurement error in salary unfairness. Moreover, each player’s work efficiency can be measured using the statistics of player efficiency rating (PER). Therefore, we can explore the relationship between pay unfairness and work efficiency at an individual level.
This study adds to our understanding of the impact of salary unfairness on an individual’s work efficiency. Harder (1992), who examined salary variation between NBA players and major-league baseball players, was the first to explore the effect of salary unfairness on individual performance. We extend Harder’s (1992) study by investigating salary variation not only between players of different teams in the league but also among teammates, further exploring the moderating role of the skill levels of players in the relationship between salary unfairness and work performance. Therefore, this study contributes to the strand of literature on the consequences of salary unfairness at the employee level.
This study has social contributions and practical implications. Salary unfairness is an important issue. This study provides empirical evidence about different responses of work efficiency to salary unfairness within different salary level groups. Also, for firms, this study has implications for designing salary contracts. When a firm design a salary contract, it should decrease salary unfairness for employees with high salary-per-contribution and appropriately increase salary unfairness for employees with low salary-per-contribution.
This study utilizes real data on employee salaries and their contributions to organizations to calculate salary unfairness levels, correcting the erroneous measurements of salary unfairness in prior research in line with Adams’ (1965) definition of unfairness. Thus, this study considers the economic effects of salary variations more appropriately (Scheer et al., 2003). Because previous studies on how salary variations influence employees’ effort levels or performance did not consider employee contributions to organizations owing to sample limitations, their conclusions should be interpreted cautiously. This study uses player salary data and team contribution indexes for NBA players from the 1999–2000 to 2015–2016 seasons to calculate the salary-per-contribution of players or the ratio between player salary and contribution to the team. It then uses this ratio to calculate players’ salary unfairness levels. This study’s measurement method for salary unfairness levels increases the reliability of its research conclusions.
Literature Review
Influence of Salary Variation on Organizational Performance
Existing literature applies social equity theory or tournament theory to investigate the effect of salary variation on organizational performance. While some studies revealed that organizational salary dispersion levels negatively influence productivity/performance (Hibbs & Locking, 2000; Mondello & Maxcy, 2009), others revealed that appropriate levels of salary dispersion improve organizational efficiency (Mahy et al., 2011a, 2011b; Mondello & Maxcy, 2009; Mueller et al., 2017; Osiichuk, 2022; Pissaris et al., 2010; Schouten, 2012; Shaw et al., 2002). Furthermore, some studies revealed that salary variation within an organization has a non-linear relationship with organizational productivity (Dai et al., 2017; Franck & Nüesch, 2011; Luo et al., 2020; Mahy et al., 2011a, 2011b; Przychodzen & Gómez-Bezares, 2021); others found no such significant relationship (Katayama & Nuch, 2011; Rouen, 2020; Schouten, 2012). These inconsistent conclusions may be due to different research samples or the failure to consider varying employee contributions to organizations when establishing salary dispersion indexes. Adams (1965) contends that people’s perceptions of whether salaries are fair are determined according to the input–output ratio, which should be used to calculate degrees of salary dispersion to accurately reflect the degree of salary fairness within an organization.
Effect of Salary Unfairness on Employee Behavior and Performance
Existing studies used surveys or experimental data to analyze the effect of employees’ perceived salary unfairness on their satisfaction, happiness, effort, and turnover rates. Where the salary of the reference object is higher than that of an employee, employee satisfaction (Card et al., 2012), happiness (Ferrer-i-Carbonell, 2005), effort (Brown et al., 2016), and turnover rate (Card et al., 2012) are low. However, some authors reported that employee effort is not influenced by coworker wage levels (Charness & Kuhn, 2007), while others found that the degree of salary unfairness leads to decreasing satisfaction levels (Poggi, 2014) and reduced working hours (Sila, 2012). Bartling and von Siemens (2011) found that wage inequality in team production does not significantly affect the degree to which employees participate and their decisions on how much effort to expend.
Some studies revealed that high-salary players are more willing to cooperate with others, while low-salary players are less willing to cooperate with others. Pfeffer and Langton (1993) revealed that in departments with higher degrees of salary dispersion, teachers have lower satisfaction and research output rates and are less likely to cooperate with others. Fabel et al. (2013) used insurance company data to explore the effects of employees’ perceived pay unfairness on performance and earned commission, revealing that envy increased employees’ extraordinary performance and when overall compensation inequality and altruism acted as independent variables, the regression results were not robust.
For the relationship between salary unfairness and employee performance, Harder (1992) studied the effect of salary unfairness in professional baseball and basketball on player performance and found weak evidence that the performance of high-salary players increases, while that of low-salary players decreases as unfairness increases.
These studies based their investigations on absolute salaries, without considering employee contribution. This is incompatible with Adams’ (1965) definition of inequality. Most employees consider not only their own salaries but also the effort that they expend in relation to salary unfairness. Thus, in theory and practice, the ratio of salaries and contributions to the organization should be determined to calculate salary fairness and, consequently, employee behavior and performance.
This study’s postulations are similar to Harder’s (1992) study. Harder utilized data from the 1987–1988 NBA season. It was the first in-depth empirical analysis of the effect of players’ salary unfairness on player performance. However, Harder (1992) could not consider the contributions of team members. Our study uses player salary data and contribution indexes to calculate their degree of perceived salary unfairness, reaching somewhat different conclusions from those of Harder (1992). As such, our study expands its research content based on Harder’s (1992) foundation, further analyzing the moderating role of the skill levels of players on the relationship between salary unfairness and work performance.
Hypotheses
The hierarchy of needs ranked in descending order are: physiological, safety, social, esteem, and self-actualization needs. Salaries guarantee fundamental living needs and can satisfy employees’ social needs, esteem needs, and self-actualization needs. Employees are motivated to expend effort to earn better salaries, reflecting an incentive effect.
This incentive effect is determined not only by employees’ salaries but also by the relative salaries of other employees in the same organization or industry. According to the expected utility theory, people’s behavior is driven by utility-maximization objectives. For employees whose salary-per-contribution is higher than that of a reference object (for example, the average salary-per-contribution of a firm or industry), when the difference increases, they will feel their excessive work and then reduce labor supply (fewer working hours or reduced efficiency) in favor of leisure, which provides higher marginal expected utility. For employees whose salary-per-contribution is lower than that of the reference object (for example, the average salary-per-contribution of a firm or industry), they will feel they are not working hard enough, and then labor supply is increased to get higher marginal expected utility.
Employees whose salary-per-contribution ratios are higher than those of others with the same input levels reduce their labor input and increase leisure. Contractual restrictions may prevent workers from reducing their working hours as they wish; hence, they reduce their work effort, resulting in lower work efficiency. Thus, the following hypotheses are proposed.
Hypothesis 1: For employees with higher salary-per-contribution ratios than those of other employees, as the gap from the average increases, work efficiency decreases.
According to the expected utility theory, when employees with lower salary-per-contribution ratios perceive a utility gap due to a salary difference, they work hard to increase their own salaries and reduce the utility gap by increasing their working hours or work efficiency (Poggi, 2014). Because it is difficult to increase work hours, working harder by increasing work efficiency becomes the most common way to increase salary. Thus, the following hypothesis is proposed:
Hypothesis 2: For employees with lower salary-per-contribution ratios than those of other employees, as the gap from the average increases, work efficiency increases.
Empirical Tests
Sample Selection
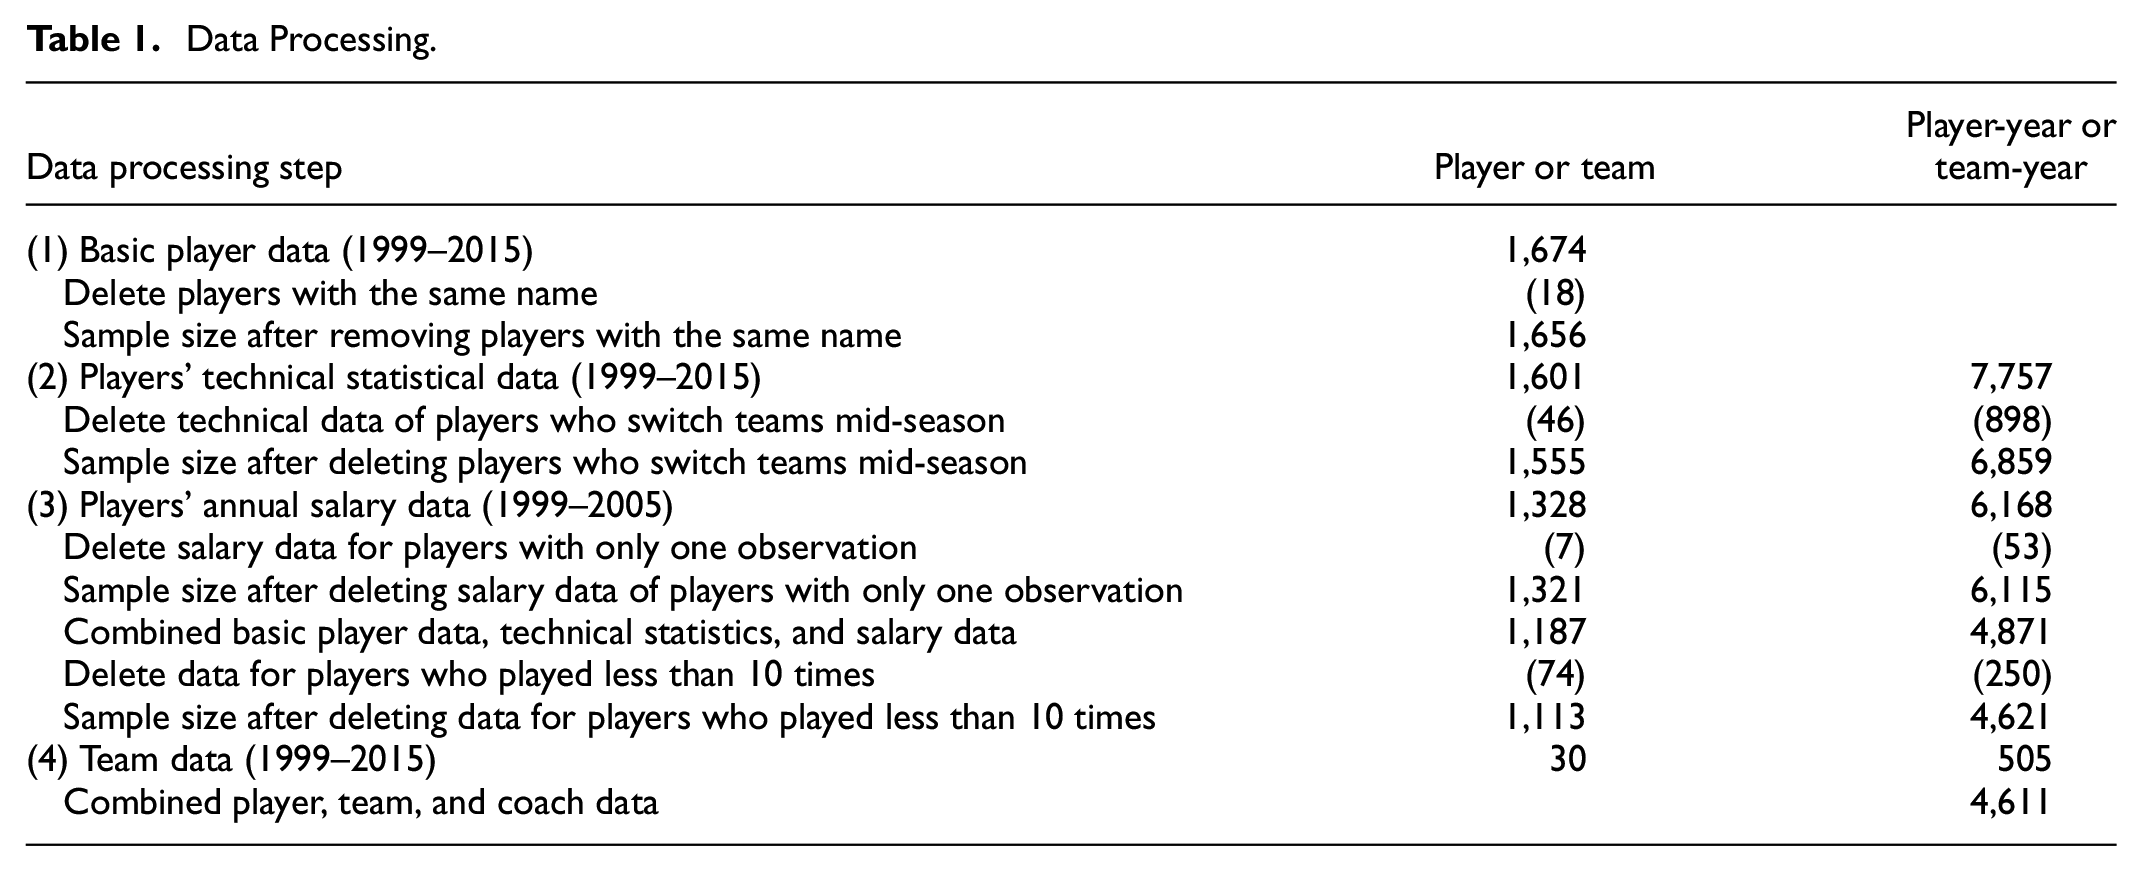
This study used NBA player salary data and efficiency value data from the ESPN website (http://www.espn.com/nba/salaries) and player characteristics and technical statistical data from the Basketball Reference website (http://www.basketball-reference.com). Table 1 shows the sample screening process. When calculating the salary per contribution unit, observation values for players (1) with the same name, (2) who changed teams mid-season, and (3) with only one observation value were eliminated. A player who played 10 or fewer games in a season was considered not active in the season, and such observations were omitted (the result does not change even when omitting observations for players who played 20 or fewer games). For this study, 4,611 annual salary observations for 1,113 players from 30 teams in 1999–2000 to 2015–2016 seasons were made. The annual distributions of the sample are shown in Table 2.
Data Processing.
Sample Distribution by Year.

Variables and Measurements
To test H1, we developed the following regression models:


where PER indicates the Hollinger efficiency value and measures the efficiency of players on the court. PER is calculated according to the algorithm in Appendix A. PGapTeam is the difference between one player’s and his team’s average salary-per-contribution (in millions of dollars) when the former is above the latter. PGapNBA is the difference between one player’s salary-per-contribution (in millions of dollars) and the NBA’s average salary-per-contribution (in millions of dollars) when the former is above the latter. Contribution in salary-per-contribution refers to the player-adjusted 48-minute win share rate.
This study used several control variables. As player salaries increase, their play efficiency increases. Thus, it is necessary to control for players’ annual salary. Because players’ physical characteristics also affect their play efficiency, this study controlled for height, weight, age, and experience. To control for variations in players’ efficiency with different identities, this study primarily controlled for such factors as international and black players. The position of the players on the court could affect efficiency. Thus, this study used guards as the reference group, establishing two control variables: center and forward. Players with higher levels of teamwork have higher play efficiency, meaning that we must control for teamwork. The player’s status on the team also reflects his efficiency; thus, this study controlled for the proportion of games in which the player starts. Coach characteristics may also affect player performance, and thus, this study controlled for the average coach age and the accumulated win rate of the coach. Because the varying degree of competition in different regional divisions could affect player efficiency, this study controlled for the region. See Table 3 for the definitions of all variables.
Variable Definitions.

To test Hypothesis 2, this study developed the following regression models:


In Models (3) and (4), NGapTeam is the difference between one player’s and his team’s average player’s salary-per-contribution (in millions of dollars) when the former is below the latter. NGapNBA is the difference between one player’s salary-per-contribution (in millions of dollars) and the NBA’s average salary-per-contribution (in millions of dollars) when the former is below the latter. Contribution in salary-per-contribution refers to the player-adjusted 48-minute win share rate. The control variables are the same as those in Models (1) and (2).
We used the ordinary least squares (OLS) method to perform the above regression models. Standard errors are clustered by team and year. The distribution of key variables meets the requirements of OLS; therefore, using OLS is appropriate.
Results
Univariate Tests
Table 4 reports the descriptive statistical results for variables. The average value of player efficiency (PER) is 13.878, with a median of 13.700, a 25th percentile of 11.000, and a 75th percentile of 16.600, indicating that PER follows a standard distribution. The average natural logarithm of salary is 15.653, about 628,000 dollars. The pay gap above team average and league average salary-per-contribution are 35.023 and 38.843, respectively. The pay gap below team average and league average salary-per-contribution are −22.019 and −21.848, respectively. The average player height is 6.507 feet and weight is 222.669 pounds. The average age is 26.677. The average years in the NBA is 4.993. The proportion of international and black players is 18.8% and 68.9%, respectively. The proportions of centers and forwards are 20% and 40%, respectively; this finding is consistent with the actual allocation of different player positions. The average ratio of teammate cooperation with players of the same position is 1, with a median of 0.899. The average rate of games started is 0.488. The average coach age is 51 years, while the average accumulated win rate is 0.515.
Descriptive Statistics.

Multivariate Tests
In the regressions reported in this subsection, robust standard errors are clustered by team and year. To facilitate comparisons with the work of Harder (1992), this study first estimates the effect of league salary unfairness levels on player performance based on annual salary. PGapH is the difference between one player’s salary (in millions of dollars) and the NBA’s average salary (in millions of dollars) when the former exceeds the latter. NGapH is the difference between one player’s salary (in millions of dollars) and the NBA’s average salary (in millions of dollars) when the former is below the latter. The regression results in Table 5 show that PGapH is positive and significant at the 1% level when not controlling for year, team, and player effect or when controlling for year and team effect. When controlling for year and player effect, it is negative and not significant, at least at the 10% level, indicating that there is only weak empirical evidence that the efficiency of players with higher salaries compared to league players increases as the difference in salary increases. NGapH is positive and not significant, at least at the 10% level when not controlling for year, team, and player effect. However, when controlling for year and team effect or control year and player effect, it is positive and significant at the 1% and 5% levels, indicating that the efficiency of players with lower salaries compared to other league players increases as the difference between salaries increases.
Effect of League Salary Unfairness Calculated Using Salary on Player Efficiency.

Note. Standard errors clustered by team and year are in brackets.
, **, and *** indicate significance at the 10%, 5%, and 1% levels (two-tailed), respectively.
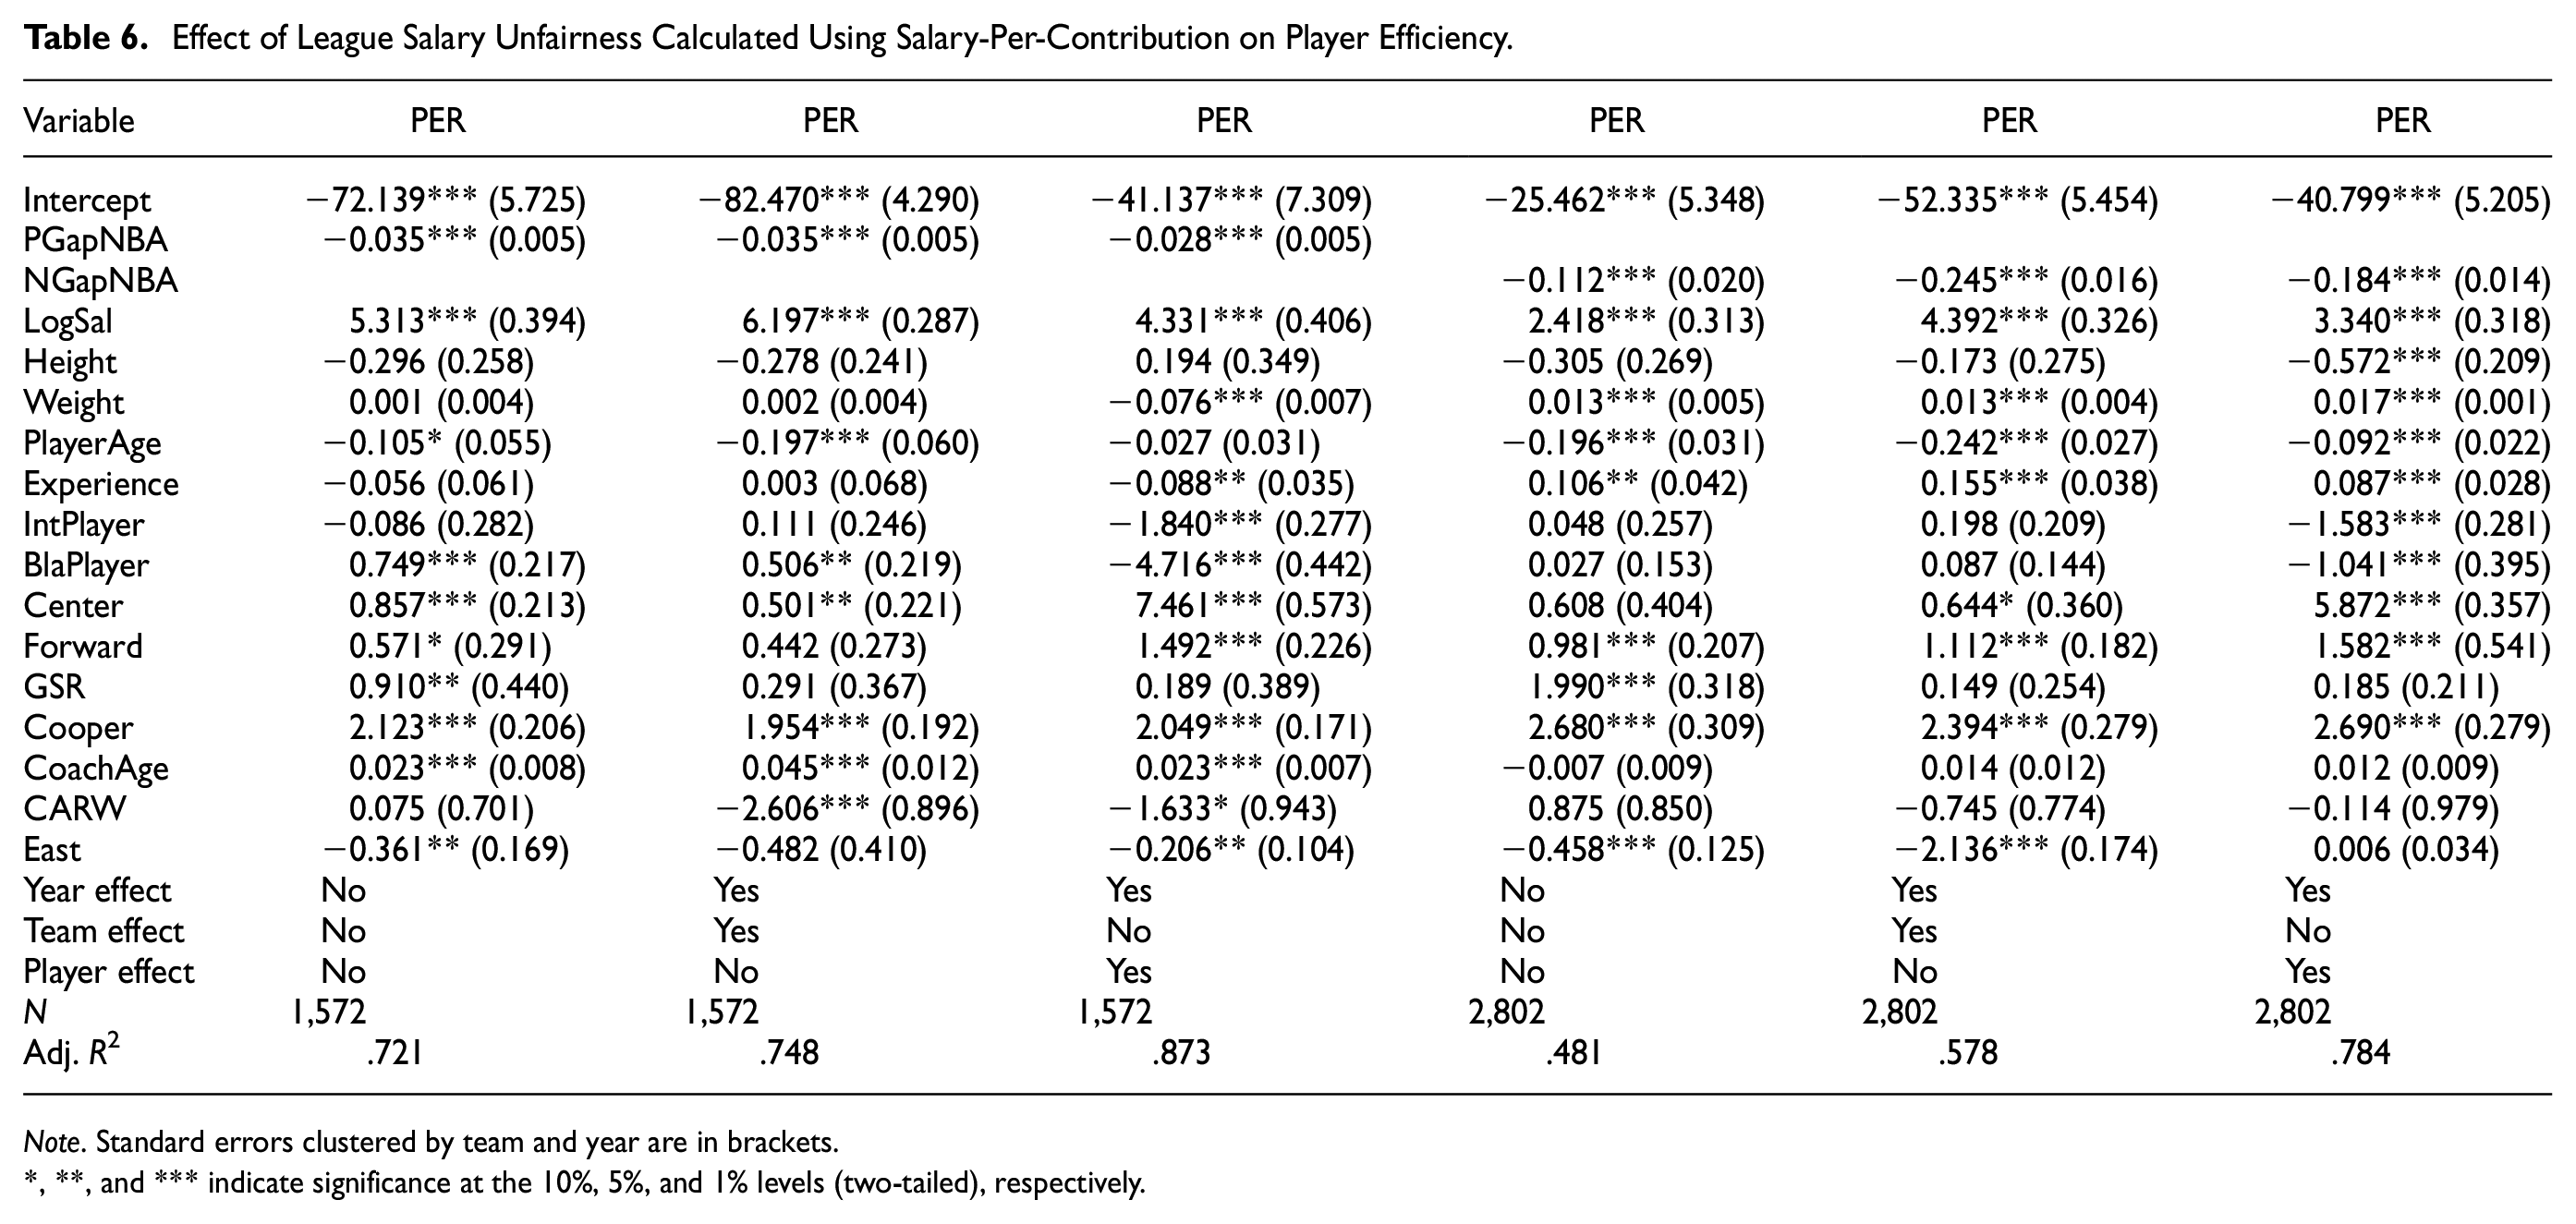
These analyses indicate that using salary-per-contribution to calculate salary unfairness is reasonable. Table 6 presents the calculations for the effect of league salary unfairness on player efficiency. The regression results show that PGapNBA is negative and significant at the 1% level, indicating that the efficiency of players with higher salary-per-contribution than the average level of the league decreases as the difference between salary-per-contribution increases. NGapNBA is also negative and significant at the 1% level, indicating that the efficiency of players with lower salary-per-contribution than the average level of the league increases as the difference in salary-per-contribution increases.
Effect of League Salary Unfairness Calculated Using Salary-Per-Contribution on Player Efficiency.
Note. Standard errors clustered by team and year are in brackets.
, **, and *** indicate significance at the 10%, 5%, and 1% levels (two-tailed), respectively.
When comparing the regression results of Tables 5 and 6, the calculations for salary unfairness based on salary-per-contribution and annual salary are contradictory. Thus, the conclusions on the economic effects of salary inequality are biased when the contributions of employees to their organizations are not considered.
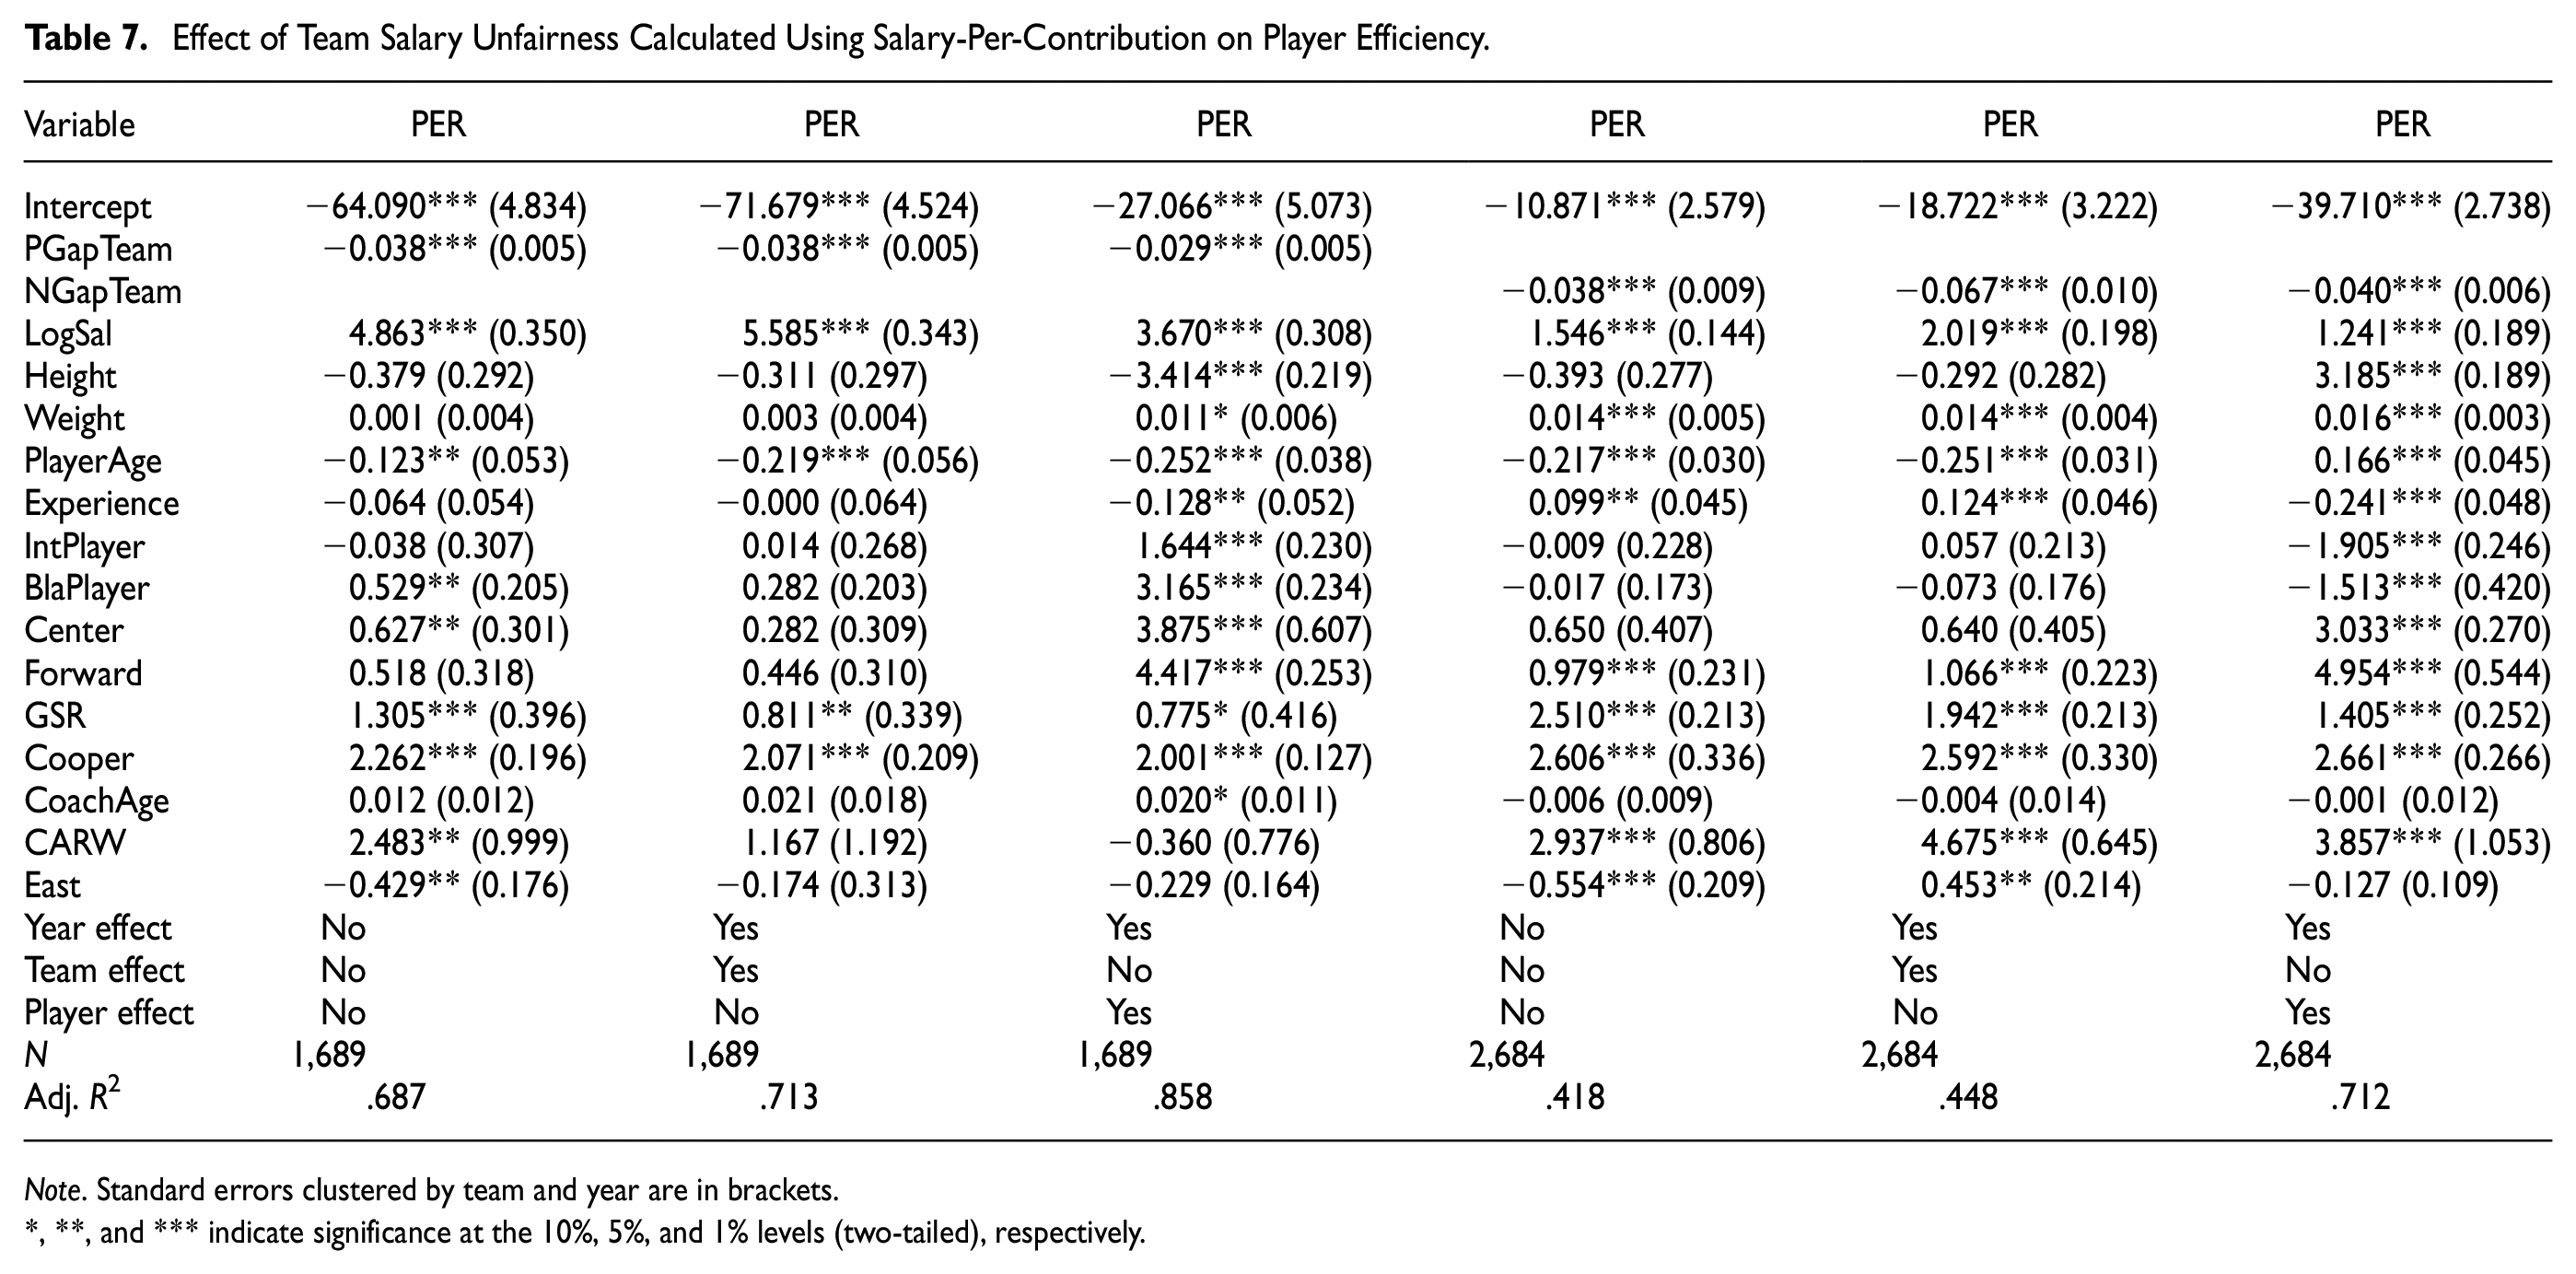
This study further analyzes the effect of players’ team salary unfairness on efficiency. Table 7 shows that PGapTeam is negative and significant at the 1% level, indicating that the efficiency of players with higher salary-per-contribution than the average level of their teammates decreases as the difference in salary-per-contribution increases. NGapTeam is also negative and significant at the 1% level, indicating that the efficiency of players with lower salary-per-contribution than the average level of their teammates increases as the difference in salary-per-contribution increases.
Effect of Team Salary Unfairness Calculated Using Salary-Per-Contribution on Player Efficiency.
Note. Standard errors clustered by team and year are in brackets.
, **, and *** indicate significance at the 10%, 5%, and 1% levels (two-tailed), respectively.
To summarize Tables 6 and 7, the efficiency of players with above-average salary-per-contribution decreases as the difference from the average increases. However, the efficiency of players with below-average salary-per-contribution increases as the difference from the average increases. These results are in line with the reality of NBA players. If a player obtains a high salary-per-contribution, he tends to relax himself and decreases his effort as the utility of leisure is more than that of effort. On the contrary, if a player is with low salary-per-contribution, he tends to improve his ability and increase his effort as the utility of effort is more than that of leisure.
Further Analysis
Mediating Role of Team Cooperation
Salary unfairness may influence the willingness and extent to which employees cooperate (Harder, 1992; Li et al., 2022). Players’ team cooperation is an important component of efficiency. Thus, team salary variations can affect player efficiency in terms of team cooperation. As salary variations increase, a player’s perceived unfairness also increases. Hence, the likelihood of cooperating with other players decreases, leading to lower efficiency. This study further verifies whether team cooperation plays a mediating role in the relationship between salary unfairness and player efficiency. Table 8 presents these regression results, revealing that PGapTeam and PGapNBA have negative coefficients and are significant at the 5% and 1% levels. This indicates that the team cooperation of players with salary-per-contribution that is higher than the average level declines as this difference increases. NGapTeam is negative but not significant, while NGapNBA is negative and significant at the 5% level. For the model using player efficiency as a dependent variable, team cooperation has a positive coefficient and is significant at the 1% level, indicating that player efficiency increases as the cooperation levels of teammates increase. Combining the results in Tables 6 and 7 reveals that when players perceive team salary inequality, their level of team cooperation is affected, which impacts their efficiency, suggesting that team cooperation plays a mediating role in the relationship between salary unfairness and player efficiency.
Mediating Effect of Team Cooperation on the Correlation Between Salary Variation and Player Efficiency.

Note. Standard errors clustered by team and year are in brackets.
, **, and *** indicate significance at the 10%, 5%, and 1% levels (two-tailed), respectively.
Moderating Role of Annual Salary
Employees with different salary levels have different hierarchies of needs. When salaries are unfair, low-salary employees feel stronger emotions than high-salary employees (Brown et al., 2016; Card et al., 2012; Pfeffer & Langton, 1993), causing lower productivity. This study further tests the different reflections of the relationship between players’ perceived salary unfairness and the efficiency of play for players with different salaries. The Pareto method indicates that 20% of society constitutes 80% of wealth in society. This study defines the top 20% of players in terms of salary as high-salary players and the lower 80% as low-salary players. Table 9 reports these regression results. The coefficients for PGapTeam, PGapNBA, NGapTeam, and NGapNBA are all higher for low-salary player samples than for high-salary player samples, which is significant at the 1% level using the Chow test. This reveals that the negative correlation between levels of salary unfairness and play efficiency is stronger among low-salary players.
Moderating Effect of Salary on the Relationship Between Salary Variation and Player Efficiency.

Note. Standard errors clustered by team and year are in brackets.
, **, and *** indicate significance at the 10%, 5%, and 1% levels (two-tailed), respectively.
Moderating Role of Starting Status
The status of core employees within organizations is higher than that of non-core employees. Non-core employees have stronger feelings about salary unfairness, which may affect their work efficiency. In the NBA, starting players have a core status and non-starting players have a lower status. This study further considers the varying relationship between players’ perceptions of salary unfairness and efficiency among starting and non-starting players. Because starting players can switch to non-starting players within a season, and non-starting players can become starting players, this study strictly defines starting players as those who start in every game of the season and non-starting players as non-starting players in every game of the season. Table 10 reports these regression results, revealing that the coefficients for PGapTeam, PGapNBA, NGapTeam, and NGapNBA are all higher for non-starting players than for starting players, which is significant at the 1% level using the Chow test. This indicates that the negative correlation between salary unfairness and efficiency is more distinct among non-starting players.
Moderating role of starting status on the relationship Between salary variation and player efficiency.

Note. Standard errors clustered by team and year are in brackets.
, **, and *** indicate significance at the 10%, 5%, and 1% levels (two-tailed), respectively.
Conclusions and Implications
The incentive effect of salary on employee work effort depends on not only the employee’s own salary but also on the pay gap between employees. This study explores the impact of employees’ salary fairness on employee work efficiency, revealing that the efficiency of employees with lower salary-per-contribution increases as the difference from the average salary-per-contribution increases, and the efficiency of employees with higher salary-per-contribution decreases as the difference from the average in salary-per-contribution increases. This conclusion is consistent with Harder’s (1992) study, which found weak evidence that the performance of high-salary players increases while that of low-salary players decreases as unfairness increases. It is also consistent with the employees’ responses to salary unfairness in reality. Employees with different salary level respond differently, which lead to different work efficiency.
Moreover, team cooperation declines when employee salaries are unfair and the extent of team cooperation is positively correlated with efficiency, indicating its mediating role in the relationship between salary unfairness and efficiency. For tasks completed through teamwork, cooperation is very important. Salary unfairness can influence the will and extent of cooperation in teamwork, and further influence work efficiency. Therefore, cooperation is a bridge between salary unfairness and work efficiency.
In addition, the negative correlation between employee salary-per-contribution unfairness and employee productivity is more pronounced among low-salary employees than among high-salary employees and more evident among non-core employees than among core employees. In reality, low-salary employees are more sensitive to salary-per-contribution unfairness than high-salary employees. Therefore, the impact of salary-per-contribution on work efficiency is more obvious in the sample of low-salary than in the high-salary sample. Similarly, core employees earn high salary, and their feeling of unfairness of salary-per-contribution is low. The conclusions of this study have several practical implications. First, designing salary contracts is one of the core issues in human resource management. When designing salary contracts and negotiating with employees, organizations must consider the pay gap between employees and ensure that wage inequality remains within a certain range. Otherwise, some employees may lower their work efficiency as a result of excessively unfair pay, while others may not be fully incentivized, causing a decline in organizational performance. Therefore, determining compensation based on performance is one of the solutions. Second, managing employee emotions is very important in human resource management. Every organization should consider the response of different types of employees to salary unfairness not only to balance the pay gap between employees according to their contribution to the organization but also to raise the salary of those who have a stronger reaction to salary unfairness to pacify them. These measures may reduce employees’ perception of unfairness, thereby slightly mitigating the negative impact of unfair salary on work efficiency. Thirdly, the conclusion of this study is particularly applicable to high-tech companies that prioritize technical personnel and require more teamwork, just like in NBA teams where players are at the core and teamwork is required.
This study employs a new theoretically suitable method to measure salary unfairness. However, owing to different samples and control variables, the differences between this study’s findings and those of prior studies cannot be entirely attributed to inappropriate measurements in previous studies. Future research should use this method in various contexts to test its validity.
Footnotes
Appendix A: Calculation of NBA Player Efficiency Rating
This section is from the Basketball Reference website (http://www.basketball-reference.com).
Player efficiency rating (PER) aims to measure a player’s per-minute performance while adjusting for pace. The league-average PER is always 15.00, permitting comparisons of player performance across seasons.
PER accounts for accomplishments, such as field goals, free throws, 3-pointers, assists, rebounds, blocks, and steals, and negative results such as missed shots, turnovers, and personal fouls. The formula adds positive and subtracts negative statistics through a statistical point value system. The rating for each player is then adjusted to a per-minute basis so that, for example, substitutes can be compared with starters in playing time debates. The rating is also adjusted for the team’s pace. In the end, one number sums up the player’s statistical accomplishments for that season.
All calculations begin with the unadjusted PER (uPER):
where
The prefixes tm and lg indicate the team and league, respectively, rather than the player; min is the number of minutes played; 3P is the number of three-point field goals; AST is the number of assists; FG is the number of field goals; FT is the number of free throws; A in FGA and FTA indicates shoot attempts; VOP is the value of possession (in reference to the league, in this instance); TO is player turnover; RB is the number of rebounds: ORB is offensive; DRB is defensive; TRB is (total) combined; RBP is the percentage of offensive or defensive rebounds; STL is the number of steals; and BLK is the number of blocks.
Once uPER is calculated, it must be adjusted for team pace and normalized to the league to become PER:
This final step removes the advantage held by players whose teams play a fast-break style (with more possessions and opportunities to go on the offense) and then sets the league average to 15.00.
Appendix B: Calculating NBA Player Win Shares Per 48 minutes
This section is from the Basketball Reference website (http://www.basketball-reference.com).
Win Shares (WS) is a player statistic that attempts to distribute credit for team success to the individuals on the team. It is calculated using player-, team-, and league-wide statistics, where the sum of player win shares on a given team is roughly equal to that team’s win total for the season. The formula is
where plMin indicates player minutes played, tmTime indicates team minutes played, tmDefPos indicates team defensive possessions, and DR is defensive rating.
Authors’ Contributions
The authors confirm contribution to the paper as follows: study conception and design: Riguang Wen; data collection: Haijing Cai; analysis and interpretation of results: Haijing Cai; draft manuscript preparation: Riguang Wen, Haijing Cai. All authors reviewed the results and approved the final version of the manuscript.
Declaration of Conflicting Interests
The author(s) declared no potential conflicts of interest with respect to the research, authorship, and/or publication of this article.
Funding
The author(s) disclosed receipt of the following financial support for the research, authorship, and/or publication of this article: This work was supported by the Humanities and Social Science Research Planning Fund from the Ministry of Education of China [24YJA630098]; Philosophy and Social Science Planning Project in Zhejiang Province [25NDJC017Z]; Guangdong Province University Characteristic Innovation Project [2019WTSCX029]; Philosophy and Social Science Foundation of Guangdong Planning Office [GD20XYJ39].
Data Availability Statement
Data sharing not applicable to this article as no datasets were generated or analyzed during the current study.