
Abstract
Individuals inevitably make inferences concerning size when they consider an object presented without cues to its actual size. Recent studies show that structural differences in background music can influence consumers’ perceptions of product attributes through cross-modal correspondence. We introduce a new structural element of music, the “music event rate.” To this end, we make a distinction between the absolute density (notes per time unit) and the relative density (notes per measure or music event rate) and propose an influence of the latter on consumers’ perceptions of product size. Our study employs a 2 (notes per measure: four vs. eight) × 2 (music tempo: slow vs. fast) × 2 (music mode: major vs. minor) between-subject experimental design. Dependent variables are participants’ size estimates of three different food items (pictures of burger, pizza, wine bottle) presented online. The results show that the number of notes per measure has an influence on consumers’ size perception of food items insofar as a higher event rate or number of notes per measure in a music stimulus leads consumers to infer a smaller product size, whereas a lower number of notes per measure leads consumers to perceive products as larger. This cross-modal effects of the music event rate on product size perception represent a previously unexplored influence on consumer behavior.
Introduction
Music and other sounds influence consumer behavior in many ways both obvious and unexpected (Lowe & Haws, 2017). Recent research in sensory marketing highlights the effects of sound (music) in marketing communication and reveals that sound influences consumers’ behaviors on both the conscious and non-conscious levels. Music mode and music tempo have evolved as particularly important determinants of listeners’ responses to music (e.g., Alpert & Alpert, 1990; Holbrook & Anand, 1990), especially in retail settings or purchase situations (Hevner, 1935, 1937; Liu et al., 2022; Pantoja & Borges, 2021), and more recently in online commerce (Anwar et al., 2020; Ding & Lin, 2012; Doucé et al., 2022; Hwang et al., 2020).
Consumers are constantly exposed to music as ambient cues, even when they are not actively listening. Music influences consumer behavior in shopping centers, individual stores and a wide range of other service settings (Areni & Kim, 1993; Chebat et al., 2001; Milliman, 1982, 1986; Roschk et al., 2017; Sherman et al., 1997; Trompeta et al., 2022; Uhm et al., 2022). Many retail stores complement their offerings through online-settings enriched with background music as a hedonic stimulus to investigate effects on consumer experience (Anwar et al., 2020; Bramley et al., 2016; Li et al., 2022; Lorenzo-Romero et al., 2016).
No matter whether the setting is offline or online, consumers are most commonly surrounded not only by one but by various sensory cues presented simultaneously (Alais & Burr, 2019; Spence & Driver, 1997). Consequently, they experience and process these cues not in isolation but in interaction with other stimuli (Krishna et al., 2010; Lowe & Haws, 2017; Spence, 2011). These so called cross-modal effects (Spence, 2018) have been researched in recent studies on smell and haptics (Invitto et al., 2019; Krishna et al., 2010), shapes and tastes (Motoki & Velasco, 2021; Ramachandran & Hubbard, 2003; Reinoso-Carvalho et al., 2019; Turoman et al., 2018; Velasco et al., 2016; Yudi Furukita Baptista et al., 2022), odors and visual stimuli (Hanson-Vaux et al., 2013; Ward et al., 2020), and physical textures and tastes (Biswas et al., 2014; Pistolas & Wagemans, 2023).
Auditory cues are particularly significant for retailers as they can positively affect consumers’ moods, preferences and behaviors (Alpert et al., 2005; Hultén, 2013; Yi & Kang, 2019) and are even more difficult to ignore by consumers than other stimuli (Spence & Shankar, 2010). Cross-modal associations with auditory stimuli (for an overview see Knoeferle & Spence, 2021) have been found, for instance, between sound and colors (Marks, 1975; Sun et al., 2018), sound and smell (Mattila & Wirtz, 2001; Spangenberg et al., 2005) and visual cues (Helmefalk & Berndt, 2018), sound and taste (Guedes et al., 2023; Peng-Li et al., 2020; Ziv, 2018), sound and temperature (Velasco et al., 2013; Wang & Spence, 2017), as well as sound and physical size (Evans & Treisman, 2010; Lowe & Haws, 2017; Parise & Spence, 2012) or sound and flooring (Imschloss & Kuehnl, 2017). Referring to auditory cues, research has focused on the effects of structural differences in background music, such as tempo, volume, modality, timbre, intonation, accent, genre, familiarity, liking, and pitch on consumers’ perceptions and behavior (Garlin & Owen, 2006).
In addition to the many facets according to which music can be differentiated and which have already been investigated, a further structural element of music can be identified which has not yet been empirically investigated with regard to cross-modal correspondence and which can be characterized by the number of notes in a measure or a piece of music. Thus, a piece of music can contain few or many notes per measure and the question is whether this affects the perception of another sensory modality, namely the perception of size, in the sense of cross-modal correspondence. Particularly interesting in this context is the practice of using product images on flyers, posters, or websites to inform and attract consumers. When looking at images of products, such as on advertising posters, billboards, screens or in online stores, it can be seen that they are often presented without any reference points or comparative scales (such as a human hand, face, a tape measure, etc.) to help infer their actual size, that is, they appear dimensionless. If people have no reference points or are not familiar with the exact size of a product, that is, if people do not have a corresponding rich real-world size knowledge we eagerly pick up as we experience the world (Chen et al., 2022), it is difficult to estimate the size. Research has also shown that size is perceived even less accurately in virtual reality than in reality (e.g., Rzepka et al., 2023).
Thus, the aim of this research project is to contribute to the research in cross-modal correspondence between auditory and visual cues and introduce a new structural element of music: the music event rate. The music event rate is a relative measure of music “density” expressed by the number of notes per measure. In our study, we show the influence of the music event rate on consumers’ perceptions of the physical size of objects, which can have downstream consequences on consumers’ perception of products and decision making (Wang et al., 2020).
This article presents a theoretical account of the cross-modal effects involving auditory cues on consumer behavior with an emphasis on consumers’ perceptions of size. We report the results of an online experiment, which the participants carried out in a laboratory setting, exploring the effect of tempo, mode, and the newly introduced music event rate as structural differences in background music on consumers’ perception of the physical size of products. We conclude by discussing the implications of our findings as well as future research directions.
Theoretical Background and Hypotheses Development
Effects of Music on Consumer Behavior in Retail Settings
Music is an important part of everyday life in both the public and the private spheres. In retail settings, music is used to influence various aspects of consumer behavior such as customer time spent at a table or the amount of bar purchases in gastronomy (Milliman, 1986; North et al., 1999), the duration of stay in retail settings (Andersson et al., 2012), restaurants (Caldwell & Hibbert, 2002) or exhibition spaces (Xu et al., 2023), impulse buying tendencies (Ayub & Zafar, 2018; Mattila & Wirtz, 2001), the relevance of product price or the willingness to pay in purchase decisions (Jacob et al., 2009; Reinoso-Carvalho et al., 2019).
Research in music cognition has investigated how different structural dimensions of music influence behavior, affect and cognition. Much research on the influence of music on consumer behavior concentrates on how music affects individual mood states and/or arousal (Anwar et al., 2020; Gagnon & Peretz, 2003; Husain et al., 2002; Pantoja & Borges, 2021; Uhm et al., 2022). Music mode and music tempo as basic structural elements are less context-dependent than more “subjective” dimensions frequently encountered in research, for instance, genre or country-specific music like German or French folk music (Areni & Kim, 1993; Damen et al., 2021; Jacob et al., 2009; North et al., 1999). To sum up, music mode and music tempo as prominent types or structural elements of music that can be considered as overarching categories across the different music genres have evolved as particularly important “higher-order” determinants of listeners’ responses to music in marketing research.
Music mode is the specific configuration of musical intervals used within a scale or a chord that provides the tonal substance of a song (see Knoferle et al., 2012 for a review). Prior research suggests an effect of music mode (major vs. minor harmonies) on consumers’ decision-making, such as purchase intention (Alpert & Alpert, 1990; Liu et al., 2022; Pantoja & Borges, 2021) and perception of waiting time (Kellaris & Kent, 1992).
Tempo is the speed, pace, or rate at which a rhythm of a musical piece progresses (Bruner, 1990; see London, 2012 for a review) and is measured in beats per minute (BPM; Strähle & Hohls, 2018). Tempo has been shown to influence consumers’ pleasure and arousal (e.g., Anwar et al., 2020; Mufeeth & Mubarak, 2020) as well as their response behaviors. For example, the tempo of in-store music has been shown to affect spending behavior under specific conditions (e.g., Andersson et al., 2012; Gomez & Danuser, 2007; Knoeferle et al., 2017), or the time spent in stores or restaurants (e.g., Andersson et al., 2012; Caldwell & Hibbert, 2002; Knoferle et al., 2012). Also, the speed of walking is influenced by the tempo of music. Thus, slower music tempo resulted in slower walking (Milliman, 1982). These effects of music tempo were not only found in real conditions, but also in online environments for hedonic products, where fast background music increases consumers’ purchase intention and trust (Ding & Lin, 2012).
Cross-Modal Effects of Music on Perceived Product Size
For many product decisions, product size plays an important role (Ketron, 2018). However, the relevancy of product size for purchase decisions differs between products and individuals. For food items, hungry consumers might follow a “bigger is better” logic, whereas nutrition-conscious consumers might prefer smaller portions. In both logics, size matters. Similar considerations might be applied for electronic equipment, cars, or many other products.
As part of their decision-making process, customers inevitably make inferences on size when they consider a product presented dimensionless, that is, without cues to their real size such as on online platforms, posters, leaflets, etc. Specific auditory cues can influence their size perception (Tonelli et al., 2017). A recent study by Lowe and Haws (2017) shows that structural differences in acoustic pitch of a person’s voice or in background music can influence consumers’ perceptions of product attributes, such as size, through cross-modal correspondence. Thus, participants rated a sandwich advertised in a radio spot significantly bigger in a “low-voice” condition than in the “high-voice” condition (Lowe & Haws, 2017). Likewise, Wang et al. (2020) investigated the effect of different frequencies on the perceived object size (e.g., a cake slice). They found an association between low frequency and larger object size.
Cross-modal correspondence is the perceptual compatibility of a stimulus experienced by one sense (e.g., hearing) with a sensory experience from another sensory modality (e.g., seeing). For instance, people consistently match high-pitched sounds with small objects, while lower pitches in music lead consumers to infer a larger product size (Evans & Treisman, 2010; Lowe et al., 2018; Lowe & Haws, 2017; Parise & Spence, 2012; Roque et al., 2020; Spence, 2011). This particular sensory association is likely rooted in the actual physics of sound. Sounds are vibrations of the air or some other medium. High pitch corresponds to a sound with high frequency and therefore low wavelength, while low pitch corresponds to a sound with low frequency and therefore high wavelength. Low pitch is created by slower vibrations as larger objects typically vibrate and compress air in a reactively slower frequency (Broze & Huron, 2013; Plack & Oxenham, 2005). In a similar vein, low-frequency (vs. high-frequency) music was found to increase the perceived distance between the sound source and the perceiver (Sunaga, 2018).
Analogously, we propose that high frequency of waves may resemble high-frequency of tones within a certain period of time. A higher number of notes per measure might be associated with size, indicating that more (less) tones correspond to small (large) size. Broze and Huron (2012) use the allegory of elephants and houseflies to illustrate this relationship. They argue that high-pitched sounds are associated with insects (houseflies) and low-pitched noises with elephants. The ponderous elephant needs fewer steps to cover a specific distance at a certain speed compared to the tiny housefly. Since large animals have more muscle mass than small animals, they also need more energy to accelerate. An elephant, for example, takes much longer to accelerate its five tons than a smaller wolf with only 50 kg (Hirt et al., 2017, 2020).
In the composition “Peter and the Wolf” by Sergej Prokofjew the size of animals is expressed in different pitches, different density of notes and different tempo. For example, the wolf is played with “Andante molto”, which is pacing at a medium tempo. Whereas a small bird should be played with “Allegro,” which is fast, lively, happy, at a fast tempo. “The Flight of the Bumblebee” by Nikolai Rimski-Korsakow is played in a fast tempo (“Vivace” = lively, vivid). Its 2/4 measure is characterized by a high density of semiquavers and is intended to emphasize the fast tempo and rapid movements of a small animal like the bumblebee. Similarly, Broze and Huron claim that the distinction between meter and rhythm cannot account for all types of musical speed: “statements such as ‘the violin is playing much faster than the cello in this piece’ must depend on factors apart from tempo, since both parts would be playing within the same meter. [In the Grandioso section of John Philip Sousa’s march ‘Stars and Stripes Forever’] the piccolo and tuba parts appear to be moving at different speeds, despite being played at the same tempo.” (Broze & Huron, 2013, p. 20). The small piccolo plays many more notes per measure than the large tuba, which leads to a high tone density being associated with a small instrument and a low tone density being associated with a large instrument.
Consequently, we extend the associations between small elements/animals, high-pitched sounds and high frequency with high frequency of tones (i.e., a high number of tones per time unit), and the associations between large elements/animals, low-pitched sounds and low frequency by low frequency of tones (i.e., a low number of tones per time unit).
Density and Music Event Rate
Stimuli from experiments often use “isochronous sequences of notes, whose speed is straightforward to measure as onset densities (i.e., notes per second)” (Broze & Huron, 2013, p. 19). Using notes per time unit (such as seconds) as an absolute measure of reference is what we call “absolute density.” Besides this “absolute density” we introduce the concept of “relative density,” defined as the number of notes per measure, which we also call “music event rate.”
These two kinds of density are differently affected by music tempo. The tempo of a piece of music is the speed or frequency of a measure constantly played by the rhythm group of an orchestra. For instance, a typical waltz, like The Blue Danube waltz, is written in
Differently, the melody of a piece of music is not tied to this strict rhythm rule. Consequently, a measure may consist of more or fewer notes, depending on the melody. This number of notes per measure is what we introduced as the music event rate or relative density. Absolute and relative density are differently affected by changes of music tempo: If we increase the tempo of a piece of music, for instance The Blue Danube waltz, by 50%, the absolute density (i.e., the number of notes per second) also increases by 50%, whereas the relative density (i.e., the number of notes per measure) remains the same. A change in relative density (music event rate) can, for example, be experienced when listening to jazz standards, where a chorus, consisting of a certain set of predetermined chords, is repeated several times. During the first chorus, also called the head, the original written (mostly relatively simple) melody is played which consists of certain numbers of notes per measure. In subsequent choruses, each musician improvises a solo, which, in the case of the pianist or the saxophonist, may consist of many more notes per measure compared to the first chorus. Even though the tempo of the jazz standard, set by the rhythm group, stays the same, the relative density, or music event rate, of the melody played by the pianist or saxophonist has increased.
According to our extended associations chain (small elements/animals => high-pitched sounds => high frequency => high frequency of notes), there should be a correspondence between the frequency of notes and the size of elements. As we equalize the frequency of notes with the density, there should be a correspondence between the density and the perception of size: the higher (lower) the density the smaller (larger) the perception of size.
Thus, we can distinguish between two kinds of density: absolute and relative density.
We define the relative density of a piece of music (the music event rate) as the number of notes per measure and propose that the music event rate has an influence on consumers’ estimation of product size. Therefore, we hypothesize:
As derived above, we can distinguish between relative and absolute density. We defined relative density (music event rate) as the number of notes per measure. In contrast, we defined absolute density as the number of notes per time unit (e.g., per second). If you change the melody of a piece of music at a certain tempo (e.g., half note = 55 beats per minute (BPM)) from four quarter notes per measure to eight eighth notes per measure, both the relative and the absolute density double, as twice as many notes are now played per measure as well as per time unit. However, if you double the tempo of a piece of music whose melody consists of four quarter notes per measure (e.g., from half note = 55 BPM to half note = 110 BPM), the absolute density doubles, while the relative density remains the same. In order to find out whether the absolute density or the relative density or both have an influence on the size perception of products, both variants should be examined and thus, in addition to the possible influence of the relative density, the influence of the absolute density should also be examined by varying the tempo of the music, which leads to our second hypothesis:
There is no direct association between music mode and size perception and therefore there is no immediate theoretical background. However, Hevner (1935) found a relationship between music mode and weight as minor music sounds heavier compared to major music. As there is a positive association between weight and size in many areas, we hypothesize that music in major mode, compared to music in minor mode, could lead to smaller estimates regarding the size of products. Therefore, our third hypothesis is:
Method
Participants and Design
Participants in the study were 114 university students (83 women and 31 men; mean age 25.41 years) who were not compensated financially but participated in exchange for course credit. The study employed a 2 (music mode: major vs. minor; between subjects) × 2 (music tempo: slow vs. fast; between subjects) × 2 (notes per measure: four vs. eight; between subjects) experimental design. Dependent variables were participants’ estimates regarding the size of products. Participants’ self-evaluation of their musicality and their preference toward the music they had been exposed to were included as covariates.
Materials and Procedure
One of the most critical and therefore particularly carefully designed issues in this study was the choice of the music stimuli. Most researchers investigating the effect of music used already existing song titles as stimulating factors within their experiments (Alpert & Alpert, 1990; Coutinho & Cangelosi, 2011; Gomez & Danuser, 2007; Knoferle et al., 2012; North et al., 1999; Roberts et al., 1998). However, an existing song can evoke different kinds of feelings and emotions depending on a person’s memories related to this song. Additionally, compositions may differ according to several types (e.g., instruments, sounds, genre, melody, voices) that cannot be controlled completely. Therefore, a professional composer created the music especially for this study, consisting of a melody part and a bass line. The same basic musical piece was used for all of the eight groups, differing only according to the independent variables, which were mode: major versus minor; tempo: slow (half note = 55 BPM) versus fast (half note = 110 BPM); notes per measure (concerning the melody part): four versus eight. The music pieces consisted of 16 measures each and were played in an infinite loop (see Appendix, Table A1 for an overview and Figures A1–A4 for the sheet music of the complete pieces of music). By creating a piece of music specifically for this study, which was unknown to the participants and therefore could not introduce any bias, and which differed only in terms of the characteristics of the independent variables, high internal validity should be ensured.
Participants took part in the experiment individually via identical computers with headphones. They were randomly assigned to one of the eight groups. First, participants were asked to rate their actual mood, using a 10-point scale (“What is your current mood?”) anchored on “1 = very bad” and “10 = very good.” Then, the music started and they were requested to adjust the volume to a comfortable level. After this, participants answered some demographic questions, including their musicality. Subsequently, they were shown individual pictures of a burger, a pizza, and a wine bottle and were asked to estimate the diameter (in centimeters) of the respective food item. Participants were told that object sizes on the screen did not equal their “original” product size. After the estimations, the music stopped and participants rated their actual mood a second time. Finally, they indicated how much they liked the music they had been exposed to (1 = not at all; 5 = very much) and how they experienced it (sad vs. happy; slow vs. fast) on 5-point bipolar rating scales as manipulation checks.
Results
A 2 × 2 × 2 analysis of covariance (ANCOVA) was conducted to evaluate the effects of the three between-participants factors—music mode (major vs. minor), tempo (slow vs. fast) and notes per measure (four vs. eight)—on the size perceptions of products. Participants’ self-evaluations of their musicality and their preference toward the music they had been exposed to were included as covariates. Two outliers (= values more than three standard deviations above or below the mean) were eliminated, one for estimating burger size and one for estimating the size of the wine bottle. One other participant did not answer the question about the size estimation of the burger.
The results for the ANCOVA showed no significant interaction effects and no main effects for the independent variables mode and tempo. The ANCOVA with the burger as the dependent variable yielded a significant main effect for the variable notes per measure, F(1, 102) = 6.82, p = .010, indicating that participants estimated the diameter of the burger as larger when exposed to the music consisting of four notes per measure (M = 11.39 cm, SE = 0.52), instead of music consisting of eight notes per measure (M = 9.48 cm, SE = 0.52; see Figure 1).

Significant main effect of the variable “notes per measure” for the size estimation of the burger.
The ANCOVA with the pizza as the dependent variable indicated a significant main effect for the variable notes per measure, F(1, 104) = 4.10, p = .046, indicating that participants estimated the diameter of the pizza as larger when exposed to the music consisting of four notes per measure (M = 26.56 cm, SE = 1.20), instead of music consisting of eight notes per measure (M = 23.11 cm, SE = 1.21; see Figure 2).

Significant main effect of the variable “notes per measure” for the size estimation of the pizza.
The ANCOVA with the wine bottle as the dependent variable revealed a significant main effect for the variable notes per measure, F(1, 103) = 6.31, p = .014, indicating that participants estimated the diameter of the wine bottle as larger when exposed to the music consisting of four notes per measure (M = 7.45 cm, SE = 0.42), instead of music consisting of eight notes per measure (M = 5.94 cm, SE = 0.42; see Figure 3).
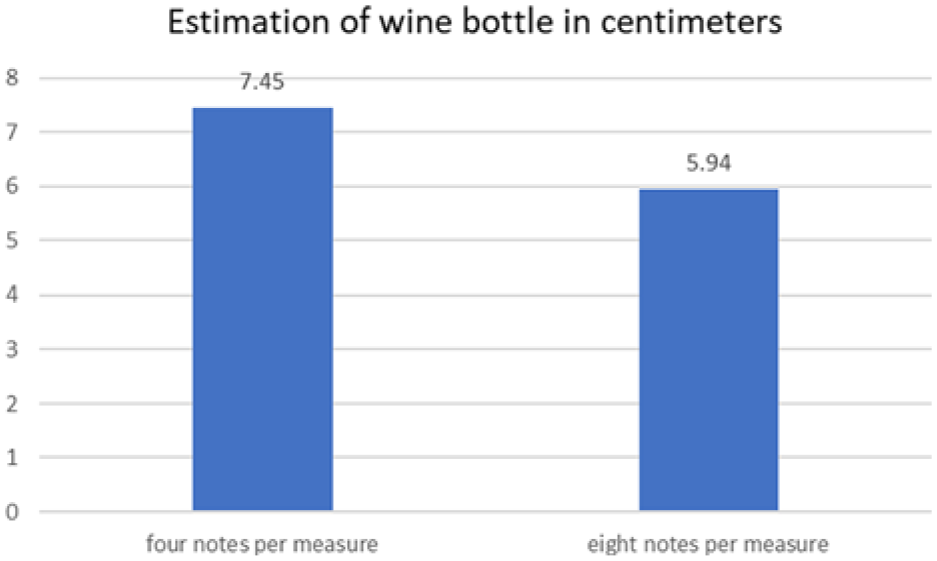
Significant main effect of the variable “notes per measure” for the size estimation of the wine bottle.
Detailed results of the ANCOVA can be seen in Tables 1 and 2.
Results of ANCOVA.

Note. M = estimated marginal means of the main effects regarding the estimated size (diameter in centimeters) of the products of the 2 × 2 × 2 ANCOVA with self-evaluations of participants’ musicality and preference toward the music they were exposed to as covariates.
p < .05.
F-values (F), Degrees of Freedom (DF), p-Values (p), and Effect Sizes (η2 p ) for Main Effects and Interaction Effects for the Dependent Variables “Estimation of Diameter” for Burger, Pizza, and Wine Bottle.
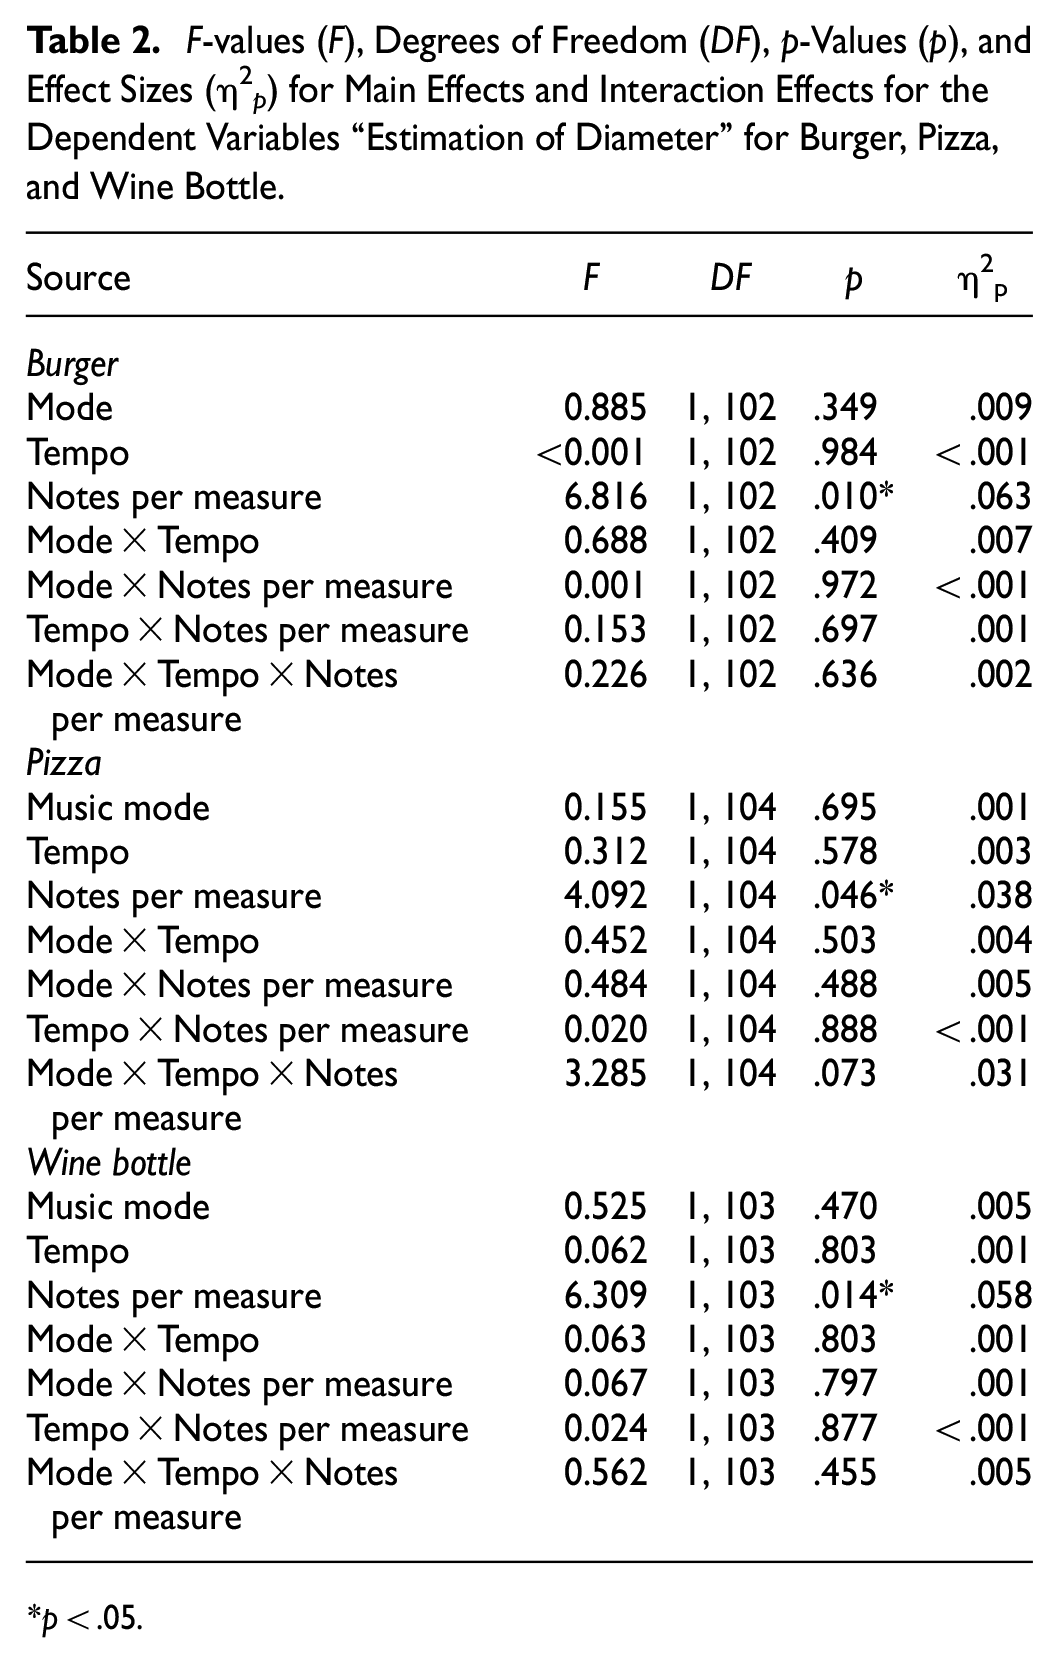
p < .05.
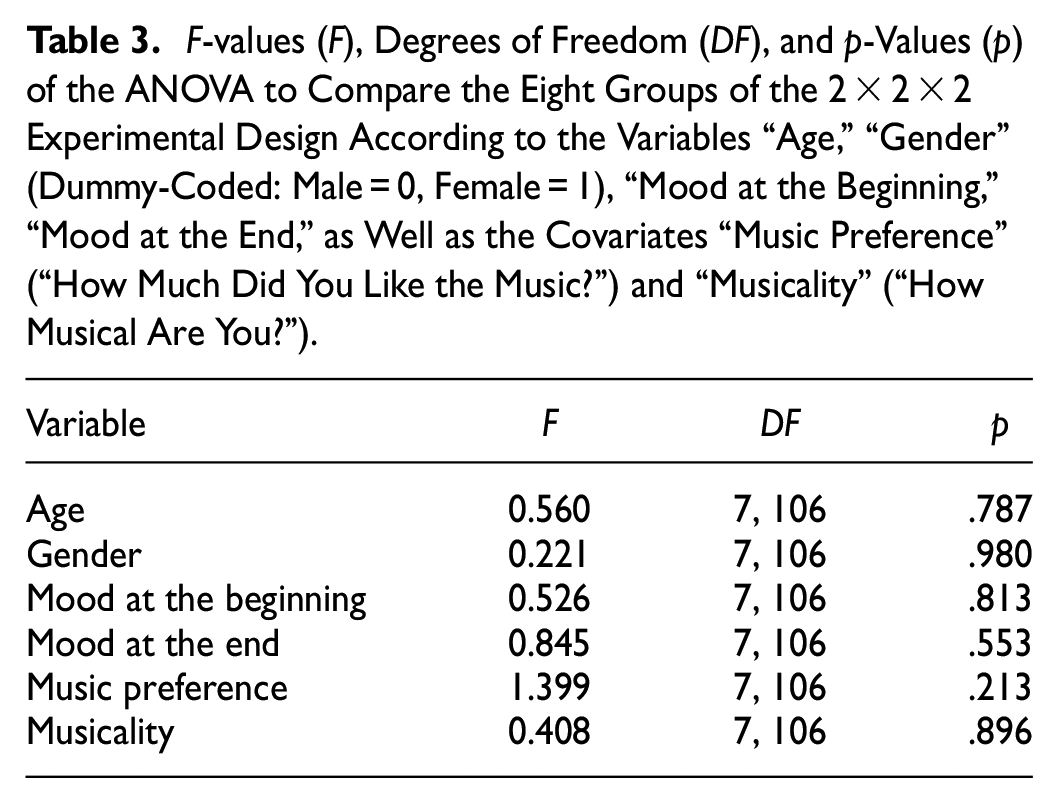
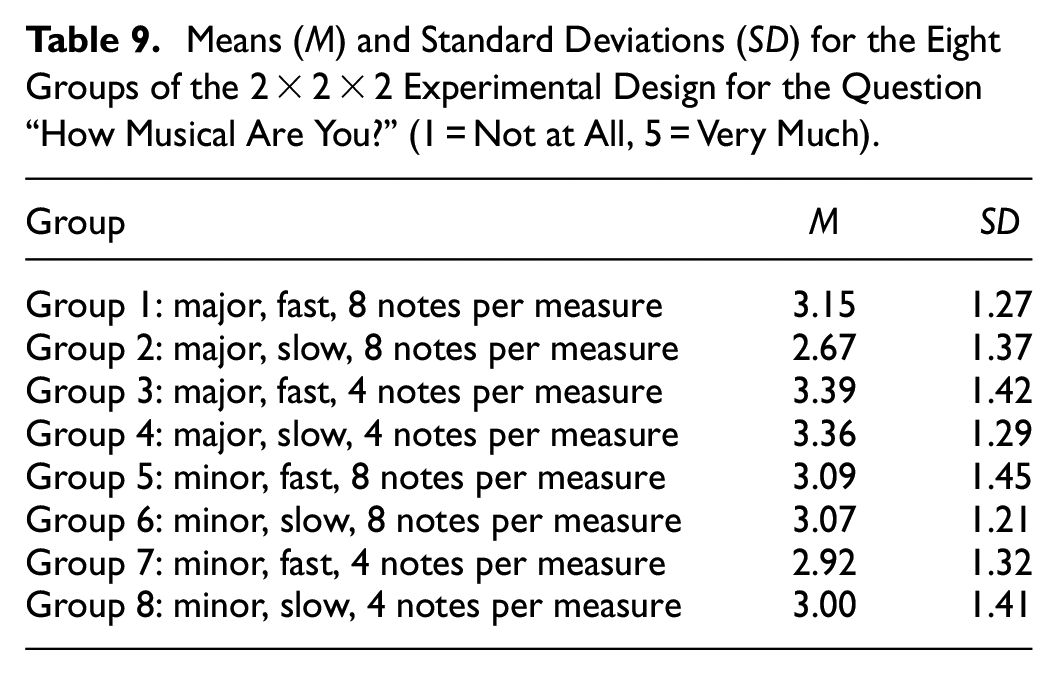
There were no significant differences between the eight groups of the 2 × 2 × 2 experimental design according to the variables “age,” “gender” (dummy coded: male = 0, female = 1), “mood at the beginning,” “mood at the end” as well es the covariates “music preference” (“How much did you like the music?”) and “musicality” (“How musical are you?”) (see Tables 3–9).
F-values (F), Degrees of Freedom (DF), and p-Values (p) of the ANOVA to Compare the Eight Groups of the 2 × 2 × 2 Experimental Design According to the Variables “Age,” “Gender” (Dummy-Coded: Male = 0, Female = 1), “Mood at the Beginning,” “Mood at the End,” as Well as the Covariates “Music Preference” (“How Much Did You Like the Music?”) and “Musicality” (“How Musical Are You?”).
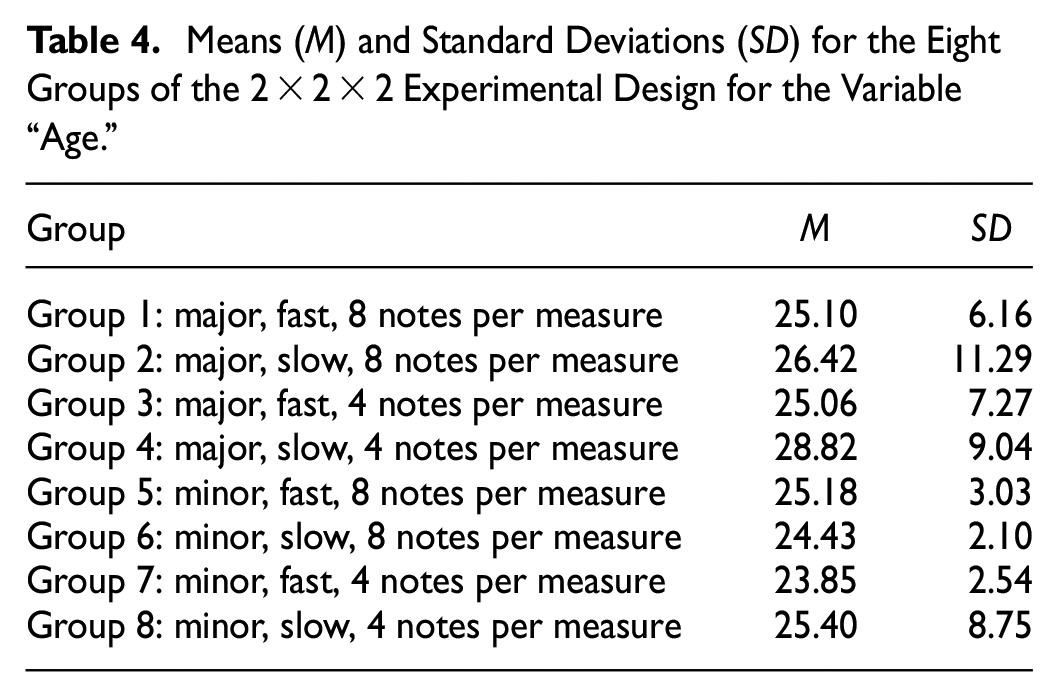
Means (M) and Standard Deviations (SD) for the Eight Groups of the 2 × 2 × 2 Experimental Design for the Variable “Age.”
Means (M) and Standard Deviations (SD) for the Eight Groups of the 2 × 2 × 2 Experimental Design for the Variable “Gender” (Dummy-Coded: Male = 0, Female = 1).

Means (M) and Standard Deviations (SD) for the Eight Groups of the 2 × 2 × 2 Experimental Design for the Variable “Mood at the Beginning” (1 = Very Negative, 10 = Very Positive).

Means (M) and Standard Deviations (SD) for the Eight Groups of the 2 × 2 × 2 Experimental Design for the Variable “Mood at the End” (1 = Very Negative, 10 = Very Positive).

Means (M) and Standard Deviations (SD) for the Eight Groups of the 2 × 2 × 2 Experimental Design for the Question “How Much Did You Like the Music?” (1 = Not at All, 5 = Very Much).

Means (M) and Standard Deviations (SD) for the Eight Groups of the 2 × 2 × 2 Experimental Design for the Question “How Musical Are You?” (1 = Not at All, 5 = Very Much).
2 × 2 × 2 ANOVAs were conducted for manipulation checks. As expected, participants who were exposed to minor-key music perceived the music as sadder compared to participants who were exposed to major-key music (Mminor = 2.55 vs. Mmajor = 3.52; F(1, 106) = 28.470, p < .001, η2 p = .212). A weaker main effect was also found for tempo, in that fast music was perceived as happier (Mslow = 2.80 vs. Mfast = 3.26; F(1, 106) = 6.546, p = .012, η2 p = .058). No other significant effects were found. Our second manipulation check showed that participants who were exposed to fast music perceived the music as faster (Mslow = 2.57 vs. Mfast = 3.25; F(1, 106) = 14.848, p < .001, η2 p = .123). A significant main effect was also found for the music event rate, in that music consisting of eight notes per measure was perceived as faster compared to music consisting of four notes per measure (Mfour notes = 2.59 vs. Meight notes = 3.23; F(1, 106) = 13.388, p < .001, η2 p = .112), and for music mode, inasmuch as participants who were exposed to minor-key music perceived the music as slower compared to participants who were exposed to major-key music (Mminor = 2.67 vs. Mmajor = 3.15; F(1, 106) = 7.277, p = .008, η2 p = .064). A two-way interaction effect was found between tempo and music event rate (Mfast + eight notes = 3.38 vs. Mfast + four notes = 3.12 vs. Mslow + eight notes = 3.08 vs. Mslow + four notes = 2.06; F(1, 106) = 4.709, p = .032, η2 p = .043). No other significant effects were found.
Discussion
Our research reveals a direct effect of an additional structural element, the music event rate or number of notes per measure, on consumers’ size perception of the food items hamburger, pizza, and bottle of wine. The cross-modal effects between notes per measure and the size perception of virtual depictions of physical products add to our knowledge on the influence of sound and music on consumer perception and behavior. A higher number of notes per measure in a music stimulus leads consumers to infer a smaller product size. By contrast, a lower number of notes per measure leads consumers to perceive products as larger. This shows that even subtle variations in music, which many people might not even consciously perceive as having an influence, can lead to measurable differences in the perception of products. There was no statistically significant support for an influence of music mode and tempo and no interaction effect.
Theoretical Implications
One of the theoretical implications of our results is that they contribute to the literature on cross-modal correspondence. Previous studies have shown that auditory stimuli such as pitch have an influence on the perception of product size (e.g., Lowe et al., 2018; Lowe & Haws, 2017). Our study extends the findings on cross-modal correspondence by adding the music event rate, that is, the number of notes per measure, as an influencing factor on the perception of product size. The significant difference in size perception can be explained by a physical effect. Physically, sounds are vibrations of the air or some other medium (Lerch et al., 2009). High pitch corresponds to a sound with high frequency and therefore low wavelength. Consequently, a higher number of notes per measure induces a perception of small size. Our animal allegory can make a substantial contribution (Broze & Huron, 2013; Plack & Oxenham, 2005). For example, we tend to associate small, fast movements (which correspond to a high density) with small animals such as a bird or an insect. Slow movements, on the other hand, are more likely to be associated with larger animals such as an elephant (Broze & Huron, 2013). To use another analogy, small animals, including frogs, use the so-called “dishonest signal of size.” They use their anatomical abilities, such as the lowering of the larynx, to imitate the sounds of a larger animal and thus reinforce the impression of physical size conveyed by the sound. Thus, the low frequency call conveys a larger size and may deter potential rivals (Bee et al., 2000; Fitch, 2000).
The present study makes a major contribution concerning the influence of music density on size estimation by contrasting relative and absolute density. Whereas relative density (i.e., the music event rate or the number of notes per measure) showed an influence on size estimation, absolute density (i.e., the music tempo or the number of notes per time unit) did not. In terms of a jazz standard, the tempo the piece is played in, does not have an influence on the listeners’ size perception of an object, but the number of notes per measure a soloist plays in improvisation does—the more notes per measure, the smaller the size estimation. An explanation could be that the rhythm of the music is used as a reference system upon which people orient, independent of the tempo of the piece of music. Music mode (major vs. minor) did not have an influence on size estimation. This could have been assumed as there is no strong theoretical underpinning. Though the literature shows a relationship between music mode and weight—as minor music sounds heavier compared to major music (Hevner, 1935)—there is no evidence for a direct relationship between music mode and size. Nonetheless, the results show that the effect of the number of notes per measure (the music event rate) on size estimation not only holds for different music tempos but also for the prominent kinds of music mode, major and minor.
As already mentioned in the methods section, most previous studies have used existing pieces of music to investigate the effect of music (Alpert & Alpert, 1990; Coutinho & Cangelosi, 2011; Gomez & Danuser, 2007; Knoferle et al., 2012; North et al., 1999; Roberts et al., 1998). Using existing pieces of music can lead to impairments and greatly reduce internal validity due to the participants’ different experiences with certain pieces of music as well as the diversity of other dimensions of music, like instruments, sounds, genre, melody, voices, etc., that cannot be fully controlled. By using pieces of music created specifically for this study, it was possible to ensure that the eight variants of music stimuli were identical except for the variation in the independent variables (music event rate: low vs. high; tempo: slow vs. fast; mode: minor vs. major). This and the fact that the online study took place in a laboratory setting should ensure that the internal validity of our experiment was high.
Managerial Implications
Our findings also offer some managerial implications. Size perceptions and possible consequent purchase intentions can be influenced by music, more specifically, the number of notes per measure employed. From an online retailer’s perspective, the perceptions and (consequently the behavior) of consumers can be influenced through the choice of background music. The outcomes of this experiment suggest that music with a lower music event rate creates a bigger mental image of the product and consequently creates a larger incentive in a “bigger is better” logic to purchase food items. An adverse effect may be true for products such as electronic devices, where a smaller item might be considered a better purchase (Cho & Lee, 2010). As the selection of atmospheric music is often dominated by managerial intuition (Areni, 2001, 2003), our results can provide managers with clues to select the appropriate background music for the desired size perception of their products.
Our study shows that the music effect rate has an influence on the size perception of products, while the tempo or modality of the music has none. This supports the findings of Tran and Getz (2023), which stated that the tempo and the timbre of music only had an influence on the product perception, when the attention of the participants was explicitly drawn to the music. This leads to further possible managerial implications. For example, music has been shown to have an influence on consumers’ speed with regard to walking (Milliman, 1982) dining (Milliman, 1986), or drinking (McElrea & Standing, 1992), perceived waiting time in a registration line (Oakes, 2003), purchase intention as well as trust (Ding & Lin, 2012). Thus, tempo can influence people in several ways, density in other (independent) ways, which provides the opportunity to influence people in several ways using one piece of music. The same applies to other modalities of music. This offers multiple opportunities and combinations.
Limitations and Indications for Future Research
The study entails several shortcomings. An influence on the perception of size was investigated. However, this was not examined with regard to the actual intention to buy a product. Furthermore, the melodic sequences used were specifically composed for the experiment to exclude biases from familiarity, preference or other dimensions of music in order to enhance internal validity. Still, a consecutive study could use familiar music examples and different music genres and pieces to further test the effect and increase external validity. Moreover, in order to increase the external validity, further studies could be conducted in real consumption environments and with different types of products. Another interesting variable could be the mood of the test participants, which could act as a moderator variable. Studies have already shown that mood can influence the perception of a products quality (Koetz et al., 2017). The liking of the product might also be another contributing factor to our results, as Klein et al. (2021) have shown, that the sole presence of music can influence the likeability of a product, which may have an effect on the size perception, as they found a link between music, likeability and the complexity of product visuals.
Another shortcoming of this study was the number of participants, which could be increased in further studies. Furthermore, the music event rate (number of notes per measure) could be further varied in future studies. In our experiment, the notes per measure were doubled, with each doubled note corresponding to the same pitch. On the one hand, the number of notes per measure could be varied further and, on the other hand, there could also be a variation in the pitch of the additional notes.
This study investigated the influence of the music event rage on people’s perception of product size. Further studies could examine the effect of the music event rate on an extended product concept (humans, animals, destinations, events etc.) as well as on product evaluation, purchase intention and purchase behavior in virtual (i.e., online) as well as real consumer environments. In addition to purchasing behavior with regard to product size, purchasing behavior could also be examined with regard to quantity.
In this study we tested three structural elements of music (music event rate, tempo, and modality) and found no interaction effects. Nevertheless, the combination with other structural elements (volume, pitch, timbre, etc.) or the variation of the characteristics or intensity of these structural elements could lead to interesting results with regard to perception, evaluation, purchase intention and purchase behavior of products in different shopping settings.
Current studies mostly use Western music (e.g., Broze & Huron, 2013), including classical music, jazz, pop and folk music. This restriction to Western music limits the explanatory power as consumer groups are accustomed to that kind of music. The music event rate is a universal structural element that can be applied to all music styles and could therefore be studied in all music genres worldwide.
Ethical Considerations
Research into effects of background music add to the growing evidence on nonconscious influences on consumer behavior, where “methods to thwart or bypass the consumer’s defenses against influence are becoming ever more powerful” (Bargh, 2002, p. 283). The effectiveness of our experiment shows that consumers can be manipulated by structural elements of music to change their perceptions and resulting behaviors. The aim of this article, however, is not to provide techniques to influence individuals who are not aware of the source of the influence. Rather, we consider it the responsibility of researchers to inform consumers about possible manipulations and thus avoid the misuse of influencing techniques.
Footnotes
Appendix
Table A1 shows the eight different variants of pieces of music according to the 2 × 2 × 2 experimental design.
Declaration of Conflicting Interests
The author(s) declared no potential conflicts of interest with respect to the research, authorship, and/or publication of this article.
Funding
The author(s) received no financial support for the research, authorship, and/or publication of this article.
Ethics Statement
Ethical approval was obtained from the Research Committee for Scientific Ethical Questions (RCSEQ No. 1541).
Data Availability Statement
Data sharing not applicable to this article.