
Abstract
The aim of the study is to investigate the relationship between the internal financial and capital structure of an organization in the travel and tourism sector. The study shows how financial constraints on tourism companies affect their ability to finance themselves. The study also shows a relationship between tax shielding and financial leverage. This study analyzes panel data collected over a 21 year period, from 1998 to 2019, from over 100 publicly traded tourism companies in three Asian countries. A panel data methodology and the generalized method of moments estimation (GMM) were used in this empirical study. To support our hypothesis, using a generic method to evaluate parameter estimation will be our most effective method to improve the literature. Overall, the results show that financially stressed tourism firms use their option of debt-free tax avoidance to increase leverage. There is also a positive correlation between tax haven and leverage for firms with limited resources. The correlations between financial leverage and corporate debt supported by the results theoretically support the pecking order. By providing useful insights into the tax shielding of non-debt, which is significantly correlated with leverage for firms operating in tourism, this study closes the gap in firms’ capital structure decisions regarding access to finance.
Keywords
Introduction
In the face of rapid globalization, no one can neglect the crucial role of tourism as an economic indicator for a country’s economy. Tourism businesses are at the heart of national economies as enterprises to promote financial activities and expand their rapid growth. There are several reasons that lead us to examine the hospitality industry. First of all, because the hotel industry occupies a special position and is considered one of the pillars of key economic variables. In addition, macroeconomic cycles have a significant impact on this industry. The financial decision-making process, which deals with the choice of a company’s capital structure in order to access funding, is one of the most important frameworks in the field of corporate finance. It is still a controversial issue with no definitive conclusion.
In the context of financing corporate strategy, many scholars have worked on the capital structure model, such as (Jensen & Meckling, 1976; Modigliani & Miller, 1958, 1963; Myers & Majluf, 1984). However, their research has shown that the financing structure of an industry is not significantly influenced by the characteristics of the industry as a whole (DeAngelo & Masulis, 1980; Myers, 1977, 1984). There are few theories about the combination of debt and equity that a firm uses for financing, such as hierarchical financing order and optimal capital structure theories, which have been thoroughly studied and empirically evaluated in academia, but the results are still inconclusive, especially when it comes to the hospitality industry. Although capital structure theory is a well-researched topic, not as much research has been done on how firms’ financial constraints affect their ability to raise finance in the tourism sector. Financial managers have to make many important financing decisions, one of which is capital structure, which refers to a mix of equity and debt (Sullivan et al., 1995).
Furthermore, a country’s tourism industry can help to reduce unemployment. Thus, by understanding the capital structure decisions of these firms, we can better appreciate the potential limitations that may exist within the same industry sector. There are many capital structure theories, and it is obvious that the value of a company is influenced by its debt-to-equity ratio. Some capital structure theories, such as signaling theory (Leland & Pyle, 1977; Ross, 1977), have been influenced by the financial structure of firms. Myers and Majluf (1984) developed the hierarchy finance theory and the optimal capital structure approach (static and dynamic). Despite the agency costs, costs associated with financial distress and information asymmetry. It is necessary to choose the appropriate financial structure for the firm because, as stated earlier, it has a significant impact on firms. Based on previous research methods, this study provides a new perspective on business leverage without considering the applicability of tax incentives to businesses in the tourism sector.
Empirical research and academic findings on tourism firms have examined capital structure by showing the importance of the relationships between the effective impact of capital structure on the selection of projects that add value to a firm and the cost of a firm’s financial resources, which can play a crucial role in determining firm value. According to Ozkan (2001), there is a significant inverse relationship between debt and tax shield without debt. In addition, there is a negative correlation between growth opportunities and the use of long-term debt, as shown in the study by Phillips and Sipahioglu (2004). The most recent study by Aggarwal and Padhan (2017) found a strong correlation between firm value and firm quality, leverage, liquidity, size, and economic growth. Their results indicate a favorable correlation between firm quality and firm characteristics, firm value, and economic growth.
In addition, Upneja and Dalbor (2001) found a negative correlation between leverage and the non-debt tax shield for listed US hospitality companies. Tang and Jang (2007) discovered a favorable correlation between lodging companies that use long-term tangible physical things that have a useful life of more than 1 year, have expansion opportunities, and the total amount of long-term debt they had. This relationship held true for the U.S. tourism industry. Their analysis also found that there was no correlation between the amount of debt and the volatility of earnings, firm size or profitability. With respect to the Turkish hotel industry, Karadeniz et al. (2009) show that there is an inverse direct relationship between the financial ratio of a firm’s after-tax profit divided by total assets and the proportion of the firm’s total debt to total assets.
This could be due to the difficulties in raising finance faced by companies in the accommodation sector. The tangible nature of assets, effective tax rates, and return on assets were found to be inversely correlated with the debt-equity ratio. The results of their study refute the idea of hierarchical financing approach even though there seems to be no correlation between leverage and non-debt tax shield, expansion opportunities, net credit position, and firm size. Despite the inverse correlation between tax shielding and debt, companies also employ other strategies that may directly affect the company’s industry and organizational structure. The study by Dalwai and Sewpersadh (2023) examines the effectiveness of institutional governance and intellectual capital (IC) to determine the drivers of capital structure in the tourism industry in the Middle East. The results indicate that short-term debt (STD) is more significant for tourism firms than long-term debt (LTD), which is associated with lower liquidity and higher financial risk.
Due to the relationship between debt and certain firm-specific indicators, this result is of crucial importance for the theory of hierarchical financing and for supporting the idea of an optimal capital structure. According to Andrew (1993), the capital mix (debt and equity) of tourism companies is susceptible to systematic risks. They also found that companies in the tourism industry are exposed to significant operational and financial risks. The geographical concentration of companies and the volatility of seasonal demand have a significant impact on the financial structure of the hospitality industry. A variety of factors influence the financial structure of tourism companies.
Tourism-related seasonality increases the share of long-term debt in the capital structure, as the empirical study by Sikveland et al. (2022) on companies in Norway from 2008 to 2018 shows. By examining the financial constraints affecting the internal finances of the tourism industry and considering three emerging Asian countries from our dataset, the main objective of this study is to fill a gap in the research literature. Despite the existence of financial constraints, non-debt tax fields increase firms’ financial leverage. This study draws on many theoretical foundations developed by the researchers in previous research. To discuss the function of leverage on investment, we begin with capital structure theory (see empirical study by Modigliani & Miller, 1958) and how it affects firms’ financing decisions (Jensen & Meckling, 1976; Stulz, 1990). Similarly, it is important to highlight the empirical data on the relationship between leverage and the factors that influence the financing structure of small and medium-sized enterprises (SMEs) in the hospitality industry when addressing the issue of capital structure (Pacheco & Tavares, 2017).
According to Frank et al. (2003), research on the idea of pecking order makes predictions about how large companies would finance themselves. Third, there was the tourism sector, which is important to a country’s economy (Ayalew, 2021; Salamzadeh et al., 2022). Further research examined how the capital structure affects the value of hospitality businesses. Aggarwal and Padhan (2017) and the study research by Hossain and Ahamed (2021) describe the impact of non-interest income on profit. In addition, previous studies focused on the finding that capital structure alone has an impact on bank profitability (Ayalew, 2021). However, relatively little attention has been paid to the combined effects of financing structure, tax incentives for non-leveraged firms and financial constraints in the context of Asian countries.
Therefore, the study is forced to focus on how capital structure-related financial constraints play out in the context of Asian countries. The relationship between tax havens and financial distress is an important determinant of the composition of capital (debt and equity) and the sources of corporate financing. This is reflected in our understanding of firms through the relationship between international financing and the financing structure in the hospitality industry. Due to the relationships between debt and certain firm-specific indicators, this insight is crucial for hierarchy finance theory and supporting the idea of optimal capital structure. According to Andrew and Schmidgall (1993), the capital mix (debt and equity) of tourism companies is susceptible to systematic risks. They also pointed out that companies in the tourism industry are exposed to considerable operational and financial risks. The geographical concentration of companies and fluctuations in seasonal demand have a significant impact on the financial structure of the hospitality sector. A variety of factors influence the financial structure of tourism companies. Foreign tourism-related seasonality increases the share of long-term debt in the capital structure, according to empirical research cited by Sikveland et al. (2022) in their study of companies in Norway from 2008 to 2018. By examining the financial limitations that affect the internal finances of the tourism industry and taking into account three emerging Asian nations from our dataset, this study’s primary goal is to close a gap in the research evidence. Despite the existence of financial limits, non-debt tax fields increase the financial leverage of the firms. This study is based on many theoretical foundations that the researchers have developed in previous studies. To discuss the function of leverage on investment, we begin with capital structure theory (see empirical study by Modigliani & Miller, 1958) and how it affects the financing decisions of firms (Jensen & Meckling, 1976; Stulz, 1990). Similarly, it is important to emphasize the empirical data on the correlation between leverage and the factors that influence the financing structure of small and medium-sized enterprises (SMEs) in the hospitality industry when it comes to the issue of capital structure (Pacheco & Tavares, 2017). According to Frank et al. (2003), research on pecking order makes predictions about how large firms would finance themselves.
Thirdly, there was the tourism sector, which is important for a country’s economy (Ayalew, 2021; Salamzadeh et al., 2022). Further research examined how capital structure affects the value of hospitality businesses. Aggarwal and Padhan (2017) and the study research by Hossain and Ahamed (2021) describe the impact of non-interest income on profit. In addition, previous studies focused on the finding that capital structure alone has an impact on bank profitability (Ayalew, 2021). However, relatively little attention has been paid to the combined effects of financing structure, tax incentives for non-leveraged firms and financial constraints in the context of Asian countries. Therefore, the study is compelled to focus on how capital structure-related financial constraints play out in the context of Asian countries. The relationship between tax havens and financial distress is an important determinant of the composition of capital (debt and equity) and the sources of financing of firms. This is reflected in our understanding of firms through the relationship between international financing and the financing structure in the hospitality industry.
This study is the first to examine how financial restrictions affect internal financing with regard to the capital structure of a company in the travel sector. Furthermore, this is one of the first studies to examine the relationship between financial constraints and firm’s source of financing over an extended period of time (21 years), covering more than 100 tourism companies in the three major Asian growth economies of China, Hong Kong and Taiwan. This research will enable a wide range of stakeholders, including investors, the government and firm the financing structure, profitability, and value of businesses in the hotel industry. By considering the function of internal financing in the link between financial leverage and financial constraints in tourism firms in emerging Asian economies and examining this role through a dynamic model that uses quantiles, this study adds a variety of new insights to the literature. It is paradoxical when the issue of debt is associated with the expectation of debt shielding, especially when it comes to financial constraints and leverage in tourism firms. In addition to the predictor of financial constraints, we also consider additional variables that have been shown to affect financial structure, such as profitability, sales, leverage, and tax shielding without debt.
In the existing literature on tourism firms, the financial constraints-capital structure relationship is quite understudied. Therefore, this study examines the financial constraints-capital structure relationship in tourism firms and finds that the relationship between capital structure and financial constraints of tourism firms is actually accompanied by a paradox contrary to popular belief. It is believed that this study can make an important contribution to the existing literature with these findings.
The remaining parts of this essay are organized as follows: The basic capital structure theories and applicable empirical data are used to address the sources of financial limits in Part 2. The conclusions of the study are presented in Part 4, and the data and methods are explained in Part 3.
Review of the Literature
Literature on Theory
In the economics literature, the rationale for financial structure decisions is based on three main theories: the theory of optimal capital structure, the theory of financing decisions (hierarchy), and the cash flow required to finance all projects with a positive net present value (free cash flow theory). The theory of Modigliani and Miller (1958), according to which the value of a company is unaffected by its capital structure, has been questioned in some studies. Several alternative theories of capital structure have been developed over time to identify the factors that influence capital structure decisions. Capital structure studies were revolutionized by the work of Modigliani and Miller. Due to its direct influence on the financial structure and its impact on profitability and growth, the decision on the capital structure is of fundamental importance for the continuity of a company. In line with Jensen and Meckling (1976) and Myers (1977), bankruptcy costs reduce firm value, while debt increases it due to the benefit of interest taxation (Modigliani & Miller, 1963). According to a study by Harris and Raviv (1991), large organizations with a high proportion of tangible assets have better access to credit than small financial institutions that have a higher proportion of intangible assets. In addition, borrowing appears to be more associated with ordinary financial organizations than with successful firms that offer significant investment potential. Researchers have also questioned whether the ideal capital structure even exists. In their experimental study, Faccio and Xu (2015) show that the idea of optimizing capital structure affects the taxation of firms and individuals, which in turn affects firm financial structure decision of firms. However, since interest is tax-deductible, Graham et al. (2001) claim that companies incur more debt. However, the trade-off method can be used to balance the tax benefits and the cost of the financial burden of debt. One of the most important capital structure choice theories, based on trade-off theory, states that there is an ideal capital structure that increases firm value when the potential cost of financial distress is comparable to the benefit of the minimum amount. Companies should strive for an optimal debt-to-income ratio, that is, the tax benefits of higher debt should be outweighed by the costs of financial difficulties.
Empirical Literature
In view of the high degree of information asymmetry, companies opt for the pecking order theory (Myers & Majluf, 1984) as an alternative to the trade-off theory when making decisions. In comparison, the hierarchical financing order theory refers to the use of a company’s stock or debt as a source of financing, depending on operational needs. To better understand this concept, studies Frank and Goyal (2009), Shyam-Sunder and Myers (1999) have examined the performance of companies that were dissatisfied with their financing strategy over a period of time. Therefore, adjustments to the capital structure need to be made both during the current period and in the following period. Furthermore, the pecking order theory states that companies prefer internal financing to external financing when choosing their source of financing. When companies opt for an external source of financing, they issue debt securities first, as these are the safest, followed by convertible securities and, lastly, shares. Only when internal resources are insufficient do they turn to external money.
The pecking order theory states that companies incur two costs when raising capital: Transaction costs and costs related to information asymmetries. In financially difficult times, they would rather sell part of the new investments. Finally, the assumption of hierarchical financing order explains the concept of financing decisions for the hierarchy, but not the components that define the best capital structure. In a broader sense, agency costs are crucial to the trade-off theory. The agency hypothesis states that managers and owners regularly trade off investment risks, with managers favoring high-risk options over low-risk options that increase shareholder value at the expense of bondholders (Jensen & Meckling, 1976). In other words, managers do not always act to maximize shareholder wealth. Moreover, managers always prioritize short-term projects over long-term investment projects in order to increase the company’s cash flow and strengthen its reputation (Masulis, 1988).
Numerous studies have looked at the factors that influence the capital structure of tourism companies. Dalbor and Upneja (2002) examined the factors that influence long-term credit decisions of US restaurant businesses. Research conducted by Dalbor and Upneja (2004) suggests that expansion prospects and debt are positively correlated over time in the US travel sector, including the application of capital structure theories (Upneja et al., 2010). In the hospitality industry, capital structure decisions are influenced by financial constraints, but this has not been extensively studied. Previous studies have shown the importance of financial leverage in determining capital structure, particularly in the tourism industry. Upneja and Dalbor (2001) also discovered that leverage and tax shielding without debt are negatively correlated in publicly traded US hotel companies. Furthermore, the study by Karadeniz et al. (2009) shows that return on assets and debt levels are negatively correlated in relation to the Turkish hotel sector. This could be due to the challenges that accommodation providers face in raising capital. Leverage has a negative correlation with effective tax rates, return on assets and asset realizability. Non-debt tax shields, growth potential, net credit position and firm size appear to have no correlation with the debt ratio, according to the researcher’s examination of the results, implying that evidence of hierarchical financial order is lacking. Since tourism companies require a lot of cash, they usually consist of fixed assets with a higher ratio of long-term debt to equity. To determine which factors influence the capital structure of the tourism industry in the Middle East, the study by Dalwai and Sewpersadh (2023) examines the effectiveness of institutional governance and intellectual capital (IC). The results show that time-limited debt is more important for tourism companies than financial liabilities with a maturity of more than 12 months, which reduces liquidity and increases the risk of financing.
The seasonality caused by foreign tourists increases the proportion of short-term debt in the capital structure, according to the study by Sikveland et al. (2022), which examines the systemic variables that influence the capital structure of the hotel industry. The travel sector also makes more frequent use of short-term financing. One could consider the study of factors affecting the financial structure of micro-enterprises (SMEs) firm an early precursor to the discussion on financial leverage. According to a study by Pacheco and Tavares (2017), SMEs in the hotel industry generally lack the necessary liquidity and short-term financing to meet their obligations. Kizildag and Ozdemir’s (2017) study on the hotel and tourism industry served as the basis for their analysis, which showed that growing companies tend to borrow excessively and more frequently, which increases their leverage. Ibhagui and Olokoyo (2018) found that the negative impact of debt on firm performance is greater for smaller firms and that there is a size threshold up to which the impact persists.
Furthermore, companies often have a low leverage-to-equity ratio and vice versa when their market-to-book ratio is high. This line of study is continued in the work of Crespí-Cladera et al. (2021) on the Spanish hospitality industry during COVID19. The results of the study show that the majority of companies that have experienced financial difficulties have solvency problems, that is, their total assets do not cover their debts. Compared to medium and large firms, González and González (2012) found a limited correlation between corporate leverage and profitability, with a greater impact in small firms. They also found that the availability of the tax advantage of debt is diminished by its utility. According to the results of the study, leveraged firms adjust to the optimal debt-to-income ratio. This study examined how the SOA of firms’ capital structures is influenced by debt practices. According to the study by Morais et al. (2022) on leveraged firms, the debt ratios of different types of such firms differ significantly. While the correlation between debt and capital structure is undeniable, the results of the study by Faturohman and Noviandy (2022) confirmed that capital influences financial decisions. Using predictor analysis, the authors came to their conclusions about leverage and discovered a strong positive relationship between the tax shield and earnings volatility and book leverage. There is a significant positive correlation between leverage and earnings volatility and tax shield. In terms of economic impact, a larger study has identified and assessed the impact of leverage on the financial performance of hotels, restaurants, and tourism companies.
According to Chairunisa et al. (2023), total asset turnover and cash ratio have an important and positive impact on financial performance, while debt ratio, cash ratio, and current ratio all have an impact on the financial performance of hotels, restaurants, and tourism. Furthermore, his findings have shown that the debt to assets ratio has a major negative impact on the financial health of companies in the hotel, restaurant, and tourism sub-sectors.
This research is also in line with previous research such as Meitriliani and Partina (2021), Putra et al. (2020), and Thoyyib et al. (2018) who found a favorable and important relationship between total asset turnover and firm financial performance (ROA). According to research on bankruptcy risk, it is crucial to consider the relationship between employee satisfaction, financial leverage, and bankruptcy risk. The research by Stamolampros and Symitsi (2022) shows a strong correlation between employee evaluation of companies and lower financial leverage and higher credit score. This result supports the hypothesis. Furthermore, based on the GMM analysis, Alnori and Alqahtani (2019) conclude that Shariah compliance is a crucial element in determining the financial structure of companies.
The effect of determinants of capital structure in the hotel industry in Kenya revealed a startling result: liquidity has a significant and positive effect on the financial performance of star rated hotels in Nairobi such that an increase in liquidity improved financial performance (Mugambi, et al., 2023). In relation to liquidity, Altin et al. (2018) investigated loan application decisions in food service firms and found that variables such as the owner’s financial position and adequate liquidity minimized the likelihood of seeking financing from external sources. However, this study shows that the pecking order theory does have implications for financially distressed tourism firms. As far as we are aware, no previous study has looked at financial constraints and internal financing in tourism firms. This study examines the impact of internal financing and adds a wealth of new material to the literature. It employs a dynamic model that uses quantiles and looks at this role in correlation with financial constraints and debt in tourism firms in emerging Asian economies. It is paradoxical when the issue of debt is linked to evidence of the expectation of debt shielding, especially when it comes to financial constraints and leverage in tourism firms.
The Variables That Used in the Econometric Model
Leverage
Empirical studies show that companies generally rely on debt financing to cover transaction costs. High expenses and low cash were the result of excessive cash investment in highly leveraged firms as reported by Ferreira and Vilela (2004) and J. Kim et al. (2011) come to the same conclusion. Empirical studies show that companies generally resort to external financing to cover transaction costs. High expenses and low cash are the result of excessive cash investment in highly leveraged firms, as reported by Ferreira and Vilela (2004) and J. Kim et al. (2011), come to the same conclusion. In contrast, the study by Al-Najjar and Hussainey (2011) showed that bankruptcy costs for leveraged firms are significantly and consistently associated with the benefits of debt. Since debt requires a fixed interest rate, it is often used by firms to leverage (increase) shareholders’ profits (ROE) as long as satisfactory returns (higher than interest rates) on assets are ensured (Singapurwoko and El-Wahid, 2011). However, inappropriate use of debt could have a negative impact on ROE. According to Vintila and Floriniþa (2012), a company’s return on equity could decrease if it does not generate high profits. Furthermore, according to the study by Grossman and Hart (1982), a higher debt-to-equity ratio decreases because the probability of bankruptcy increases. The results also suggest that the firm’s ability to obtain collateral for its debt helps to explain this incentive.
Non-Debt Tax Shield
The pecking order or trade-off theory states that internal financing or return on capital plays a crucial role when it comes to financial decision structure in the literature. Numerous studies in the literature have examined the relationship between leverage and profitability (Abdullah, 2021; Akinlo & Asaolu, 2012; Allozin & Obeidat, 2016; Chen & Chen, 2011). Profitability and leverage have a relationship that is generally considered unfavorable in emerging or developing countries, it is said, confirming this research that supports the idea of pecking order (Abadi et al., 2016; Fernandes et al., 2021; Nivorozhkin, 2002).
Profitability
The pecking order or trade-off theory states that internal financing or return on capital plays a crucial role when it comes to financial decision structure in the literature. Numerous studies in the literature have examined the relationship between leverage and profitability (Abdullah, 2021; Akinlo & Asaolu, 2012; Al-Lozin & Obeidat, 2016; Chen & Chen, 2011). Profitability and leverage have a relationship that is generally considered unfavorable in emerging or developing countries, it is said, confirming this research that supports the idea of pecking order (Abadi et al., 2016; Fernandes et al., 2021; Nivorozhkin, 2002).
Ratio of Sales to Assets
Based on the relationship between sales and assets, this study examines how demand conditions affect financial leverage. Thus, demand conditions are a critical control variable (Caglayan & Rashid, 2014; R. Huang & Ritter, 2009; Jensen, 1986; Myers & Majluf, 1984) that can influence financial leverage (Baum et al., 2009; Chow et al., 2018; Demirgüç-Kunt et al., 2020; Doruk, 2022; Liao et al., 2015).
Hypothesis Development
Not surprisingly, not much research has been done on how financing constraints directly affect the degree of liability in the firm’s financial decision-making structure, despite the importance of raising capital in this decision. Several studies have also mostly attempted to determine how corporate finance and capital structure are related. This has taken into account that circumstances influence the choice of capital structure in SME financing.
SMEs with insufficient access to debt financing may have different financing behavior, claim Abor and Biekpe (2009). Therefore, the choice of financing is the basis of firms’ ability to raise finance. The tax advantages of debt are a better option for firms to access finance as they combine the resource structure of firms, which is supported by the optimal capital structure theory. Therefore, one of the most important components of corporate finance is the selection of an optimal capital structure (Hitka et al., 2021). Corporate finance theory assumes that the presence of tax shelter increases profitability and firm value, although the evidence on the relationship between interest debt and profitability is inconclusive. In a study by Buus (2015), conducted in the Czech Republic, it was found that the tax shield fee varies. In the study, financial information was included in the dynamic model of free cash flow and tax shield. In addition, he illustrated how high-growth companies do not have leverage due to the high cost of the financial crisis and companies’ preference for the hierarchy financing theory over the optimal capital structure hypothesis.
One of the main concerns of these studies was also the attempt to establish a link between the capital structure of companies and financing. Compared to other continents such as Europe, America, Africa and Australia, Asia’s tourism industry contributes significantly to the continent’s foreign exchange generation, revenue generation and job creation. In 2017, the hospitality industry in China generated 11% of the country’s gross domestic production (China Tourism and Hotel Industry, 2018). In this context, especially in these difficult times, the study of the financing capital structure of the healthcare enterprise heralds a new era of corporate finance discovery.
In situations where there are financial constraints, internal and external financing have different costs (or when there are imperfect capital markets). Due to financial constraints, there is no flexibility between the choice of capital structure and investment decisions, which causes the cost-benefit equilibrium to diverge from the leverage ratio. Although research on the financial constraints hypothesis dates back to the work of Fazzari et al. (1988), relevant scholars have reviewed the literature and found that the level of knowledge on the topic of financial constraints for tourism firms is very low. The tourism sector is a key area of investigation for this sparse body of literature. As far as we know, there have been few discussions on the relationship between financial constraints and capital structure. However, Wei et al. (2014) find that the majority of companies, including publicly traded companies, face severe financing constraints due to a lack of debt capital. Munir et al. (2017) proved that the debt ratios of some large management companies are low or almost zero, although they assumed that the external financing of large management companies often faces limitations. From a dynamic perspective of corporate finance, Hadlock and Pierce (2010) show that the size of the firm is the most important factor influencing the financing constraints of small and micro firms. In addition, they found that the firm has higher financing costs in the start-up and expansion stages, suggesting that there are certain financing constraints. According to Shibata and Nishihara’s (2018) research, restrictions on business lending will reduce leverage and default risk without causing financial hardship or changing investment behavior. However, only one leverage ratio was used in this analysis, liquidity was not considered, and no distinction was made between the short-term and long-term debt components of capital structure.
Our main hypothesis is, therefore, defined as follows
H1: There is a negative link between internal finance and external finance (or financial leverage) under the financial frictions in the Asian emerging markets.
In the light of the existing literature, the sub-hypothesis for firms with financial constraints can be stated as follows:
H1a: Financial limitations’ impact on the capital structure pushes tourism businesses to use the internal finance channel. In other words, we expect that there is a pecking order theory effect for the financially constrained tourism firms.
Data and Methodology
The sample of tourism and accommodation companies used in this study comes from the Thomson Reuters Refinitiv Dataset. The study used data taken from financial statements for the years 1998 to 2019. The source of the data is the NAICS (North American Industrial Classification System). From the entire sample, we clean our dataset using the following criteria. Finally, to account for the potential impact of outliers on our model, we eliminate the points for each variable that are higher than 99% and lower than 1%.
More than 100 Asian tourism companies took part in the study. In the period covered by the study, the COVID-19 pandemic effect was removed, and the observations for 2020 and 2021 were also removed. The descriptive statistics for our dataset can be found in Supplemental Table A1. The results of the correlation analysis are also presented in Table A2. According to Table A2, there is no multicollinearity problem among the variables. Following previous research and more recent evaluations to examine the elements that influence capital structure, this study uses the GMM method of analysis (Arellano & Bond, 1991). When analyzing the relationship between different variables, the GMM method is particularly suitable when one has a broad cross-section (N) and a limited time horizon (T) (N > T scenarios). The GMM estimator allows us to remove the independent variables of the study as well as all unobservable individual influences. The GMM panel estimator solves the problem of endogeneity, autocorrelation, omitted variable bias and firm-level heterogeneity. Since we have more variables for our estimators, the GMM instrument matrix is constructed using only t-2 of all endogenous variables. A system GMM model is used. In addition, the application of the model leads us to several performances (see Table 1.) to evaluate the validity of the model regularly, assuming that there is no autocorrelation and heteroscedasticity directly related to the coefficients of the lagged variables and the residual.
Variable Descriptions.

Source. Authors’ own compilation based on Thomson Reuters Refinitiv dataset.
Econometric Model
The GMM model in this instance is described as follows:

This expression represents the panel data model that was used: i and t are indicators for the company and year, respectively. The leverage variable that is one period behind is LEVi,t-1. Based on Arellano and Bond (1991), the paper uses GMM model which accounts for possible endogeneity and heterogeneity issues related to the lagged leverage variable added as a regressor on the right-hand side. By utilizing the variables’ instruments, it additionally accounts for the bias caused by missing variables. Considering the variables as endogenous with the lagged variables, the firm dynamics can be suitably modeled by the instrument matrix. This can be justified by the heterogeneity of the firm’ and the numerous factors that affect firm values, which are difficult to measure or collect (Himmelberg et al., 1999). In Equation 1, µ denotes fixed effects of the firm, e is the error term of the regression. This study also uses time dummies to control for the extent to which the countries in the sample are affected by the Asian Crisis and its aftermath. However, it is foreseen that closures and lockdowns in this region during the COVID-19 period pose a significant threat to the continuity of tourism companies. Therefore, it is seen that this leverage has already increased abnormally during the pandemic period and financial reports are troubled. Therefore, the pandemic period is not included in the sample.
Firstly, to ascertain whether “there is a negative relationship between internal finance and external finance (or financial leverage) under the financial frictions in the Asian emerging markets,”Equation 1 is used to evaluate the study’s main hypothesis, H1.
Financing Constraints Classifications
We determine the quantiles of financing constraints level for a tourism firm is a firm according to the Hadlock and Pierce (2010) Financing Constraints Index (HP index, henceforth). We estimate the HP index as following:
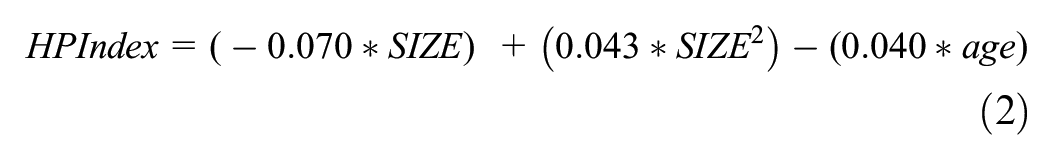
HP Index is very easy to estimate, and very convenient to all tourism firms since the HP index is only based on firm size, and firm age. Note that firm age and firm size are the most commonly utilized firm-level indicators in the financing constraints literature to determine the existence of financial constraints within an organization.
On the basis of numerous studies, academics have also reached a variety of findings regarding leverage’s correlation with corporate size. They contend that because size is the primary capital structure factor, large enterprises have a lower chance of default. In this context, Rajan and Zingales (1995) point out that if the firm is huge and diversifies its activities excessively, the likelihood of bankruptcy is very low. Nonetheless, Ang et al. (1982) discovered that when a firm’s worth increases, so does the percentage of bankruptcy charges. Additionally, the company’s size affects the expenses associated with issuing debt and equity. Particularly, issuing fresh equity and long-term financing can be highly expensive for small businesses compared to large businesses.
In these analyzes, a completely different approach was used to calculate quantiles for the financially constrained companies and to determine the quantiles (25% of their financial constraint score, here HP index) within which each firm should remain and multiply them by the write-off. In other words, a calculation was performed as follows:


The first 25% of the HP index (here Q1δ) is the first quantile, the second 25% is the second quantile (Q2δ), the third 25% is the third quantile (Q3δ) and the last 25% is the last quantile (Q4δ). The higher the HP index, the greater the financial constraints are likely to be. In this framework, recourse to depreciation is expected to increase as the level of Q decreases for each quantile, as the need for internal financing increases. The econometric model for the financing constraints is therefore as follows:

Equation (3), which is provided as follows, is a good fit for evaluating study hypothesis H1a. H1a: Due to the financial restraints effect on the financial decision structure, Tourism businesses are compelled to use the internal financing channel. Stated differently, we anticipate a pecking order theory effect for the tourism businesses that are financially limited.
Findings
The data reveal a number of startling conclusions. These results and their implications are summarized and discussed. Larger companies are shown to be more susceptible to uncertainty, suggesting that larger US tourism companies have greater challenges when it comes to reorganizing their financial structure. In an environment of high uncertainty, highly leveraged Asian tourism companies will therefore face greater financial difficulties. However, financial obstacles can have a greater impact on highly leveraged companies. Here are some reasons why this might be the case. It is important to note that companies in the tourism industry tend to have higher levels of debt (Akron et al., 2020; Demir et al., 2019; Singal, 2015). Considering that Asian tourism companies mostly rely on external financing, Chen & Chen (2011) provides additional evidence that financing has a major impact on their financial performance. The results of the GMM model are shown in Table 2. From Table 2, it can be seen that the leverage ratio triggers a cumulative and dynamic process. In other words, the financial leverage in the previous period increases the current financial leverage. According to the 2020 study by Rahman et al. (2020), the use of debt capital by textile companies listed on the Dhaka Stock Exchange (DSE) is strongly correlated with lower corporate profitability. Similarly, it has been found that there is a negative correlation between the average profitability of Pakistan’s textile industry and the level of indebtedness. The results of Raza (2013) show that, on average, there is a negative correlation between profitability and the leverage ratio. The study also concluded that a high leverage ratio leads to direct and indirect costs that ultimately result in lower profitability.
Findings.

Note. Parentheses show the t statistics. Robust standard errors for heteroscedasticity and autocorrelation are used. P/A stands for profit to assets ratio. LEV: financial leverage, δ/A depreciation to assets, S/A sales-to-assets ratio. Each Q in the models denotes a quantile and each 25% firm is time-varying. AR (1) and AR (2) denote the probability value of the autocorrelation test for first and second order differenced residuals, Hansen’s J Test denotes the overidentified matrix probability, and Wald Test denotes the p-value of the significance of the model as a whole.
P < 0.05. **0.01%. ***0.001.
Based on our second premise and pecking order theory, the results of our study show that profitability drastically reduces leverage. In this regard, the studies in the existing literature (Chittenden et al., 1996; Degryse et al., 2012; Michaelas et al., 1999; Petersen & Rajan, 2002; Van der Wijst & Thurik, 1993; Vos et al., 2007) support our claim that the most profitable firms prefer internal sources of financing to fund their ventures. This result is consistent with our assumptions as it suggests that there is no financial market between internal financing and financial leverage for these emerging Asian tourism firms in the Modigliani and Miller framework due to financial frictions in emerging markets.
At a statistical significance level of 5%, each of these results is remarkable. Conclusions from empirical research on sales growth studies vary widely (Kester, 1986; Titman & Wessels, 1988) Some researchers discovered a favorable correlation between leverage and sales growth. It is found that financial leverage in this case does not have a major impact on sales or revenue. Studies by Al-Sakran (2001), W. S. Kim and Sorenson (1986) and Rajan and Zingales (1995) have shown that the relationship between leverage and growth is negatively correlated. This indicates that companies with higher growth take on less debt. The dependent variables and sales growth show an expected negative relationship between sales and financial leverage in this study. Interestingly, it is found that depreciation, the primary variable of interest in this study, increases financial leverage.
This result shows that depreciation, which is a significant source of internal financing and is referred to in the literature as the Nondebt Tax Shield, significantly increases financial leverage. In other words, depreciation, which is one of the other measures of endogenous financing, turns out to be an important incentive factor for financial leverage. In other words, depreciation increases the financial leverage of tourism firms. Another surprising finding is that according to the HP index, which is divided into quantiles and shaped by firm size and firm age, among the four main quantiles, tourism firms with the most financial constraints and those with the least financial constraints (the values in Q1 and Q4 are positive but not statistically significant) do not use depreciation to increase financial leverage, while tourism firms in Q2 and Q3 use the depreciation channel to increase financial leverage. At a significance level of 5, each of these results is statistically significant. According to the GMM results, there is no second-order autocorrelation in either model (AR (2) > 0.05). According to the results of the Hansen J-test, the instrument variables used do not have the property of an overidentified matrix. According to the Wald test, both models are significant.
All in all, the theory of pecking order for tourism businesses under information asymmetries. In other words, in the context of financial inadequacies, tourism enterprises with limited resources prioritize their own resources before tapping into external financing opportunities. However, the effects of depreciation are highly controversial. At this point, the conclusion is drawn that depreciation under financial constraints is indeed an important amplifier of financial leverage. The pecking order theory states that corporate expansion should be financed by debt, as depreciation is often one of the most important sources of financing. DeAngelo and Masulis (1980), for example, found that Miller’s claim that the leverage-to-equity ratio is irrelevant is sufficiently refuted by the availability of non-debt tax shields, such as investment tax credits and an asymmetric corporate tax structure that does not reimburse losses, in combination with depreciation deductions. Thus, according to G. Huang and Song (2006), the capital structure is a mutually beneficial balance between agency costs, financial distress, and the tax shield for debt.
In short, we call this a paradox because leverage and tax shielding are positively correlated for financially distressed firms. Since depreciation is an internal financing factor, internal financing drives up the leverage ratio for financially distressed companies. It can be concluded that depreciation can mitigate the sensitivity between financing constraints and debt for tourism firms only for the differentiated among firms with financial constraints, especially for tourism firms in the second and third quantiles (Q2 and Q3).
Robustness Checks
Panel Fixed Effects
To observe the differences between the panel GMM models and the fixed-effects model, the fixed-effects panel model is also calculated as a conventional robustness check, even if there is a Nickell’s bias within the econometric models. However, it can be considered as a preliminary analysis. Table 3 shows that the results of the fixed effects models for the panel and these results confirm our main findings from the GMM models. When analyzing the results for the fixed-effects panel, we find that the results obtained in the GMM model for tourism firms in Q1 are valid. Apart from this, all results are consistent with the GMM results. It can be interpreted that this difference between fixed effects and GMM is due to Nickell’s bias and that GMM results, which better control for endogeneity, are more reliable. For the main model, it can be seen that the GMM and fixed-effects results match exactly.
Panel Fixed Effects Results.

Note. Parentheses show the t statistics. Robust standard errors for heteroscedasticity and autocorrelation are used. See note below Table 2 for the description of the variables.
P < 0.05. **0.01%. ***0.001.
Table 4 shows the different lag values chosen for the instrumental variables in the GMM models. The results obtained support the results of the main model. These results show that the GMM model results, considered as a robustness check, confirm the GMM results expressing the main model.
Robustness Checks Results I: Different Lags.

Note. Parentheses show the t statistics. Robust standard errors for heteroscedasticity and autocorrelation are used. See note below Table 2 for the description of the variables. Moreover, for the GMM diagnostics description, see the note below Table 2, also.
P < 0.05. **0.01%. ***0.001.
In order to assess the relationship between debt and all possible internal financing options, a very novel and sophisticated robustness check is performed at this point of the study by considering the quantiles of financial constraints. In order to examine the relationship between financial leverage and all quantiles of financial constraints, including depreciation and profitability, this paradigm also includes an interaction between the profitability ratio, which expresses internal financing, and all other quantiles. First, it should be noted that all variables representing endogenous financing are included in this model as quantiles of financial constraints. Another point is that the effect of the relationship between depreciation and financial constraints on financial leverage is analyzed by controlling for the relationship between profitability and financial constraints, which is another channel that expresses internal financing and depends on available funds. The results in Table 5 show that the conclusions of the base model remain the same when the relationship between financial constraints and profitability is controlled by quantiles. Since the impact of outliers, eliminating these variables (Table 6 ) from the data give us the accurate descriptive and accurate results for the model. When the relationship between profitability and budget constraint is tested using quantiles, no significant relationship is found across the financial constraint channel with respect to the relationship between profitability and financial leverage identified in the first model. At the same time, testing the sensitivity to lags revealed that the results of Model 2 in Table 5 remained unchanged when alternative lags were used.
Robustness Checks Results II: Different Lags with All Possible Internal Finance Channels with Financing Constraints.

Note. Parentheses show the t statistics. Robust standard errors for heteroscedasticity and autocorrelation are used. See note below Table 2 for the description of the variables. Moreover, for the GMM diagnostics description, see the note below Table 2, also.
P < .05. **0.01%. ***0.001.
The Results with Winsorized Variables.

Note. Parentheses show the t statistics. Robust standard errors for heteroscedasticity and autocorrelation are used. See note below Table 2 for the description of the variables. Moreover, for the GMM diagnostics description, see the note below Table 2, also.
P < 0.05. **0.01%. ***0.001.
In order to identify companies with financial constraints, it makes sense for the quantile-based HP index to depend on firm size and age. For reasons of robustness, however, four separate quantiles were created that only firm age of the company. In these quantiles, the quantiles of firms with time-varying financial constraints are created such that the youngest firms are in q1 and the oldest firms are in q4 by age. To assess the impact of depreciation on the leverage of firms with four different financial constraints, these four quantiles are then combined with depreciation. Table 7 shows the results of this analysis. The results in Table 7 make the paradox we found even clearer when we look only at age. It can be observed that the youngest tourism companies increase their financial indebtedness through the depreciation channel. This result confirms our findings obtained through the HP index and reveals the capital structure paradox of tourism companies in terms of financial constraints. The study shows that it has significant results in this sense through the robustness checks it uses.
Regression Model Results.

Note. Parentheses show the t statistics. Robust standard errors for heteroscedasticity and autocorrelation are used. See note below Table 2 for the description of the variables. Moreover, for the GMM diagnostics description, see the note below Table 2, also.
P < 0.05. **0.01%.***0.001.
Discussion
The empirical and theoretical implications of the Non-Debt Tax Shield provide new insights that expand the state of knowledge on capital structure, according to the results of the study. The capital structure of companies contradicts the apparent correlation between debt and profit, which is positive. The findings of this study are broadly consistent with previous research on the impact of leverage on firm performance, including that of Antoniou et al. (2008), Foong and Idris (2012), Moscu (2014), and Nguyen and Nguyen (2015). Studies on the impact of leverage on ROA-based performance of companies found a strong negative but significant correlation between leverage and profit after tax divided by the company’s total assets. Previous research (Doğan, 2013; Mahmoudi, 2014; Tsuji, 2013) shows that there is a poor correlation between the high performance of companies and leverage. After investigating the relationship between capital structure and financial factors, a small number of studies further focused on the influence of capital structure on financial constraints. Wetzel and Hofmann (2019) examine the functional relationship between working capital assets and firm performance. They illustrate how the presence of budget constraints at each stage of the supply chain affects this relationship. According to their findings, companies dealing with financially constrained supply chain partners should increase their working capital to maximize profits.
Furthermore, the studies examining the same relationship between operating resources and business success have not analyzed enough internal and external factors. The ideal level of productive capital for a company depends on its ability to obtain financial resources, as suggested by the research of Altaf and Shah (2017) and Baños-Caballero et al. (2014). Other relevant research that has looked at funding constraints has been documented, such as studies on SMEs, which are more financially constrained than large companies. In terms of firms, Czarnitzki and Hottenrott (2011) find that access to finance is a key factor in enabling productivity-enhancing expenditure. According to empirical data, longer-lived firms, especially those that are lucrative, are better able to self-finance and prefer to use internal resources rather than bank financing (Sensini, 2017). Research has shown that investments by distressed companies are less sensitive to cash flow. Therefore, cash flow sensitivity of investments may not be a very accurate indicator of financial distress (Carreira & Silva, 2010). There is a significant correlation between the growth rate of sales and total debt. According to these results, SMEs with a higher sales growth rate may have a more favorable probability of sales growth (Mueller & Sensini, 2021). However, the results show that SMEs typically favor immediate debt over medium- and long-term loans, which underlines the financial constraints that are typical for these companies (Banerjee, 2014; Beck and Demirguc-Kunt, 2006; Sensini, 2020).
There is also evidence of the role that credit constraints or monetary limits play in illuminating investment. According to López-Gracia and Mestre (2011) and Zubair et al. (2020), smaller firms are more likely to be constrained than large firms due to the relative scarcity of collateralizable assets and the excessive monitoring burden. In addition, most are aware that companies, especially small and medium-sized enterprises (SMEs), experience higher employment growth when they have better access to debt capital (Ayyagari et al., 2021).
Companies with a relatively high level of debt also have a problem with underinvestment because it may be difficult for them to find new sources of financing. Using data from Iranian companies from 2006 to 2018, Poursoleiman et al. (2020) examined the impact of debt and budget constraints on the relationship between debt and future investment. It was found that there is a negative correlation between potential investments and borrowed capital, the effects of which can be observed in a short period of time. The risk of default and maturity as well as agency conflict are reduced by short-term debt, which reduces this relationship. In addition, Yilmaz (2022) found that leverage has a significant impact on how sensitive companies are to investment cash flow.
A high leverage-to-equity ratio could therefore lead to higher external financing costs and less financial flexibility. In his article dealing with Indian hospitality firms, Altaf (2024) has identified the optimal break-even point for working capital financing and firm performance, which is 0.54, beyond which financing short-term debt will adversely affect production. He and Kyaw (2023) claim that there is evidence to support the assumption that firms with large size, low deviation of real leverage from target leverage and financial freedom realign faster than their peers. In addition, evidence of a non-leveraged tax shield changes our risk assumptions when there is an interest rate advantage due to a high leverage ratio.
However, the research results show that the tax advantage for debt, which reduces the tax burden by lowering the amount of interest, and the negative correlation that has emerged are not coherent. Despite this bias, there is a contradiction between the financial constraints on firms and leverage. The results show that financially constrained tourism firms cannot increase leverage through internal financing, but they can through the use of tax shielding without debt, another important internal financing channel. The observed results are also resistant to different modeling hypotheses, which supports the primary conclusions of the econometric models. The results are not consistent with research findings on financially constrained travel. The main hypothesis of the study and its auxiliary hypotheses were not confirmed by the results. The main hypothesis of the study is supported when the relationship between internal financing and financial leverage over profitability is examined. However, depreciation is also an important internal financing channel, which is an important topic in the financial economics literature (Dobija, 2002; Sierpinska-Sawicz & Sierpinska, 2021). According to this paradigm, the relationship between financial leverage and depreciation disproves the main hypothesis. Fixed assets serve as an important internal financing mechanism as well as a source of depreciation for tourism companies. This situation can be explained by the fact that tourism firms use internal financing sources arising from depreciation to create a source of debt capital from which they receive a tax benefit while increasing their leverage. They also provide a tax benefit (from the interest). Past research also demonstrates the positive relationship between taxes and debt. For example, according to a study by Liu et al. (2019), debt financing is more often used by companies with higher tax rates to reduce their tax liability. Existing research for other countries where there is tax protection for equity (e.g., Italy and Brazil) shows the impact of tax protection for equity on the book value of the capital structure (Frühwirth & Kobialka, 2011). We have labeled this relationship a “paradox” as it prevents the results of the study from supporting the capital structure theory. In addition, the inclusion of depreciation and the breakdown into sub-quantiles re-examines the partial hypothesis of the study that companies with financial restrictions make better use of internal financial resources. The quantiles in the tables used to examine the quantile effects on financial leverage due to depreciation express the exact opposite of the sub-hypothesis. The results of the analysis suggest that firms in financial distress use greater financial leverage and that this use of financial leverage is based on the depreciation channel, which can also be seen as a paradox. It has been noted that tourism companies borrow through depreciation, which is a significant incentive for internal financing. In this situation, the company has a significant internal financing channel through its fixed assets, which is a very important conclusion.
Conclusion
In recent years, companies have resorted to debt in their capital structure decisions to finance their expansion. The aim of this study was to examine the financial constraints that affect the ability of the financial structure of tourism businesses to secure financing.
Using data from a net sample of over 100 listed companies, the panel data model was created. After analyzing the many aspects, we identified five that have a significant impact on the internal financing of tourism companies: leverage-to-equity ratio, sales-to-assets ratio, tax shield without debt and return on assets. This model is, as far as we know, one of the few that focuses on tourism firms’ financial constraints on capital structure. Our study examines the relationship between financial leverage and internal financing of tourism firms in three major Asian countries.
These results show that the depreciation of fixed assets generated by tourism enterprises is an important instrument of borrowing and an important instrument of internal financing. This situation shows that tourism firms create a source of credit through the use of internal financing sources derived from depreciation by obtaining a tax benefit from this source on the one hand and also providing a tax benefit (from the interest) by increasing their leverage on the other. As a result, we have labeled this connection a “paradox,” meaning that the results of the study contradict capital theory. A number of policy implications can be derived from these findings. The first of these policy implications is to control the amount of borrowing by tourism firms for depreciation and the extent to which financial distress or reduced risk-taking can be shaped. This policy design can result in controlling low borrowing and high levels of financial distress in the tourism sector. In addition, the results of the study of profitability and robustness of the leverage relationship, controlling for both quantiles, confirm that depreciation is a significant source of internal financing for tourism firms. The limitations of the study are formulated below. We only work with companies that are listed on the stock exchange. Therefore, private tourism firms are not included in our sample. Studies could use other samples to investigate whether this relationship holds for other countries as well.
Limitations
Research on debt and equity (capital structure) measured with debt to equity in an effort to increase profits is very interesting to study, but there are a lot of other factors that influence it. For example, this study shows that the variables used to measure it used only one measurement instrument, although it used independent and moderating variables. The experiments have shown that certain limitations remain as leverage is also influenced by different measurement instruments. Since only hospitality companies were included in the study sample, conducting the same analysis, and hypothesizing differently in other industries would likely lead to different results.
Footnotes
Appendix
Correlation Matrix.

| Variables | (1) | (3) | (4) | (5) | |
|---|---|---|---|---|---|
| (1) LEV i,t | 1.000 | ||||
| (2) LEVi,t-1 | 0.828 | 1.000 | |||
| (3) P/A i,t | −0.054 | 0.053 | 1.000 | ||
| (4) S/A i,t | 0.221 | 0.270 | 0.150 | 1.000 | |
| (5) δ/A i,t | 0.313 | 0.225 | −0.188 | 0.504 | 1.000 |
Declaration of Conflicting Interests
The author(s) declared no potential conflicts of interest with respect to the research, authorship, and/or publication of this article.
Funding
The author(s) received no financial support for the research, authorship, and/or publication of this article.
Data Availability Statement
Data sharing not applicable to this article as no datasets were generated or analyzed during the current study.