
Abstract
Instructional leaders require timely and predictive data to guide post-pandemic systemic changes. We investigated the predictability of an observational instrument, the Rigor Appraisal, and its association with achievement and other school effectiveness measures in a sample of 53 schools in Illinois. We found that increases in the Rigor Appraisal had a small to moderate and statistically significant association with achievement, a positive and moderate statistically significant association with attendance, a negative relationship between referrals and suspensions, and a positive and moderate statistically significant association with the 5Essentials. Additionally, the implementation of academic teaming was associated with greater achievement in schools with more low-income students. We also found that leaders who conducted non-evaluative instructional walks experienced a positive and statistically significant impact on achievement. As such, the Rigor Appraisal merits further study in different contexts, as it shows promise as a leading indicator that can be used for the continuous improvement of instructional systems.
Plain language summary
This study investigated the utility of the Rigor Appraisal observation instrument as an aid to school leaders in improving instructional systems in schools. We assessed the relationships between the measures in this instrument and student achievement as well as other indicators of school effectiveness using sample data from 48 to 53 schools in Illinois during the 2021 to 2022 school year. We found that higher Rigor Appraisal scores were associated with higher student achievement and increased weekly attendance, as well as with lower rates of student behavioral referrals and suspensions. Higher scores in one specific measure, Activating Student Teams to Achieve the Standard, were also associated with greater achievement in schools with larger populations of students from low-income backgrounds. These findings indicate that the Rigor Appraisal is a promising tool to help instructional leaders to make timely, proactive decisions that improve systems affecting the quality of teaching and student learning in their schools. This study was limited to data from one school district and its findings may not be applicable to other districts and schools. Further study is warranted.
Keywords
Introduction
The pandemic has revealed that public elementary and secondary educational systems in the United States have not addressed the needs of diverse learners (Center on Reinventing Public Education 2022b). Student performance in reading and mathematics has dropped substantially in the United States since the COVID-19 pandemic. The National Assessment of Educational Progress’ (NAEP) long-term trend assessments of reading and math for nine-year-old students in 2022 revealed the largest average score decline in reading since 1990 and the first ever decline in math scores (National Assessment of Educational Progress, 2022a). The results of the main NAEP assessments for 2022 also revealed overall lower scores in reading and math for fourth- and eighth-grade students (National Assessment of Educational Progress, 2022b, 2022c, 2022d, 2022e) compared to 2019 scores. Disaggregated by race, ethnicity, and socioeconomic status, most student groups showed a decline. Although current preliminary studies have shown some rebounding of academic performance, it is still significantly lower than pre-pandemic levels (Lewis & Kuhfeld, 2022).
Current estimates of the median learning loss have been a quarter of a year for reading and half a year for math, with high-poverty school districts losing as much as a third of a year in reading and two-thirds of a year in math (Fahle et al., 2022). These declines indicate that it may take many years for student achievement to recover to pre-pandemic levels (Lewis & Kuhfeld, 2022). Declining academic performance and the slow pace of recovery could result in lower rates of high school graduation, students graduating high school without essential skills for college and career success, and lower rates of college completion, all leading to decreases in lifetime earnings and losses to the national gross domestic product (GDP) (Azevedo et al., 2020; Betthäuser et al., 2023; Center on Reinventing Public Education, 2022b; Hanushek, 2022; Kane et al., 2022).
These troubling findings have been magnified for students of color and students from low-income households. The 2022 NAEP scores revealed a continuation of historically persistent gaps between fourth- and eighth-grade White students and American Indian/Alaskan Native, Black, and Hispanic students in both reading and math (National Assessment of Educational Progress, 2022b, 2022c, 2022d, 2022e) and widening gaps among groups who were already performing at the lowest deciles (Center on Reinventing Public Education, 2022a, 2022b; Kuhfeld et al., 2022; Lewis & Kuhfeld, 2022; Lewis et al., 2022). These persistent gaps also affected low-income students most negatively, widening the gap in performance between these students and their more affluent peers (Hammerstein et al., 2021).
Effective instructional leaders are critical for enacting the systemic changes needed to accelerate learning and meet the needs of all students. Although the effect of principals on students is nearly as large as that of teachers (Grissom et al., 2021), there is little specificity regarding the most essential features of instructional leadership (Grissom et al., 2013) and little guidance on how leaders can overcome persistent disparities in student outcomes based on race, ethnicity, home language, ability, and socioeconomic status (Ishimaru & Galloway, 2014). Classroom walkthroughs have been frequently cited as essential to school improvement, but principals may not collect the right data to help them differentiate between high- and low-quality teaching practices and provide actionable feedback to teachers (Boston et al., 2017; Grissom et al., 2013).
Leaders in elementary and secondary schools need better data and tools for data-driven decision-making to improve the quality of instruction, accelerate learning for all students, and eliminate achievement gaps (Hamilton et al., 2009; Mandinach & Schildkamp, 2021; Marsh et al., 2006). Historically, decision-making in education has narrowly focused on assessment data and has not collected information that would help educators develop students to their fullest potential, identify systemic inequities within schools, and highlight opportunity gaps (Dodman et al., 2023; Isaacs, 2021; Mandinach & Schildkamp, 2021; Marsh et al., 2006).
We created the Rigor Appraisal Instrument to help leaders inform their decisions with leading indicators to improve instructional systems, track instructional improvements, and provide meaningful feedback to teachers. As such, we expected the Rigor Appraisal to be predictive of achievement and other measures of school effectiveness. We propose the following research questions used in the investigation:
Is the Rigor Appraisal predictive of achievement?
Is the Rigor Appraisal predictive of other school effectiveness and wellness measures?
In the following sections, we outline the theoretical and empirical framework of the Rigor Appraisal instrument, the methods and data used in the research study, the results of the study, a review of the policy implications and limitations of the study, and offer concluding remarks.
Theoretical and Empirical Foundations
The theory on which we based the Rigor Appraisal is that there are leading indicators of educational quality that, when collected and analyzed regularly, provide actionable data that leaders can use to proactively improve the quality of education students receive. An indicator is leading if it provides early signals that allow educators to predict performance and make strategic and timely investments in time, effort, and resources to improve student learning (Foley et al., 2008; National Academies of Sciences, Engineering, and Medicine, 2019). Leading indicators also inform productive inquiries about conditions and organizational systems that affect the quality of education students’ experience (Supovitz et al., 2012). In contrast, large-scale standardized assessment scores do not meet these criteria and are lagging measures of school effectiveness (May & Sanders, 2013). School leaders in multiple districts throughout the United States have used the Rigor Appraisal to identify and implement measurable system-based pathways for whole-school improvement. This study represents the application of the Rigor Appraisal instrument in a real-world setting to validate its usefulness as a leading indicator of schoolwide academic performance. It represents one of a series of studies to assess the predictability of the tool.
The Rigor Appraisal Instrument has five pillars: (1) Creating Conditions for Learning Rigorous Standards, (2) Using Standards-based Student Evidence, (3) Activating Student Teams to Achieve the Standard, (4) Verifying Learning to Take Action within a Lesson, and (5) Using Data to Track Student Progress toward Standards. In this section, we discuss each pillar, including its theoretical and empirical underpinnings.
Creating Conditions for Learning Rigorous Standards
The Creating Conditions for Learning Rigorous Standards pillar measures observable systems including school and classroom climate, support for student self-regulation, and high-functioning teacher teams. Optimal interactions between these systems at the school level foster a rigorous learning environment.
School and Classroom Climate
High-quality and consistent interactions between school staff and students create a positive school climate (Akman, 2021; Öngel & Tabancalı, 2022; Suldo et al., 2006). School and classroom climates affect students’ well-being, life satisfaction, ethnic and moral identity, self-efficacy, and resilience (Aldridge et al., 2018; Graham, 2022; VanLone et al., 2019). Climate is also positively associated with student achievement (Benbenishty et al., 2016; Berkowitz et al., 2017; Davis & Warner, 2018; Konold et al., 2018; Osher et al., 2020). A positive school climate can narrow the achievement gap among student subgroups (Suldo et al., 2006).
Student Self-Regulation
Teaching strategies that build students’ self-regulation and co-regulation skills support student engagement and sustain the cognition, emotions, and behaviors required to accomplish learning goals (Darling-Hammond & Cook-Harvey, 2018; Hinnant-Crawford et al., 2016; Zimmerman & Kitsantas, 2014). Many positive outcomes are associated with self-regulation, including improved student achievement (Blitz et al., 2020; Marantika, 2021; Zimmerman & Kitsantas, 2014), the development of visuomotor, mathematics, emergent literacy, and vocabulary skills in young children (Becker et al., 2014; DeFlorio et al., 2019; Williams et al., 2016), reading comprehension, vocabulary, and math in elementary school students (Day & Connor, 2017; Day et al., 2015; Lenes, et al., 2020; Skibbe et al., 2019), and improved mathematics performance of secondary and post-secondary students (Cleary et al., 2017; Musso et al., 2019). There is also evidence that students in high-achieving schools use more self-regulated learning strategies than those in low-performing schools (Guo et al., 2019).
Collaboration in Teacher Teams
To establish effective teacher teams, school leaders support and encourage professional growth, autonomy, and teacher ownership in shared decision-making processes, setting high expectations for academic performance (Argon & Ekinci, 2016; Conner, 2015; Hirsh & Segolsson, 2019; Katzenbach & Smith, 1993; Pierce et al., 2003; Schaap & De Bruijn, 2018; Seglem, 2017). Effective teacher–team collaboration can positively impact school culture and increase student achievement (Green & Allen, 2015; Kraft & Falken, 2020; LeClerc & Moreau, 2011; Muñoz & Branham, 2016; Ratts et al., 2015; Ronfeldt et al., 2015; Tichnor-Wagner et al., 2016). The higher the quality of collaboration in teacher teams, the more effective teachers are at improving student achievement (Park et al., 2018; Ronfeldt et al., 2015; M. Sun et al., 2017).
Using Standards-Based Student Evidence
Standard-based student evidence indicates the presence of structures that support consistent and systematic teaching and learning tasks with student evidence at the taxonomy level of the standard, student progress toward mastery of the standards, and the quality of tasks for collaboration among students.
Target, Task, and Taxonomy Alignment
All students benefit from rigorous and rich learning experiences. When appropriately designed, even students who have previously performed at low levels can simultaneously attain foundational skills as they engage in “authentic intellectual work” (Newmann et al., 2001: 13) that requires higher levels of cognition (Scardamalia & Bereiter, 2022; Y. Sun et al., 2010). Teachers must be able to accurately judge task complexity and design learning to enact appropriate metacognitive strategies. However, the learning tasks they create often do not match the taxonomic levels of the standards and are at lower levels of cognitive complexity (Anees, 2017; Pieschl, 2009). The alignment of learning tasks with the rigor of the standards requires strategic planning of the curriculum, instruction, and assessment to ensure that students demonstrate learning at the level of performance or taxonomy of the standards (Maye, 2013; Ziebell & Clarke, 2018).
Tasks Designed for Teams
Alignment between targets, tasks, and taxonomies is essential. The task must also be suitable for teamwork in groups, be teamworthy (Lotan, 2003; Pennant, 2018), and produce evidence of learning. Appropriately structured teams and tasks are observable features of student learning communities in autonomy-supportive classrooms (Reeve & Cheon, 2021; Reeve & Su, 2014; Wehmeyer et al., 2002, 2017).
Student Work Produces Evidence of Mastery
Teachers decide on the evidence that they expect students to produce, which reflects their mastery of the standards. Both mastery and appropriate alignment are interdependent, as the level of the learning task predicts the level of student performance (Elmore, 2008). The concept of student mastery of standards is rooted in B. S. Bloom’s (1971) mastery learning, in which there must be instructional alignment between the specific learning standards that students are expected to meet and the lessons, feedback, corrective, and enrichment activities. To achieve mastery learning, instruction must provide feedback, correction for students who have not mastered the learning, and enrichment for those who have attained mastery (Guskey, 1997, 2007).
Activating Student Teams to Achieve the Standard
This pillar measures the degree to which students are in academic learning teams, whether teams develop resilience through productive struggles, and whether they function autonomously. Academic teams demand more from students than typical small groups or cooperative learning strategies. In teams, students must verify the effectiveness of their own learning processes and the quality of their collective work.
Academic Teams
Academic teams are student-led, small, and diverse with clear protocols for engaging in standard-based academic work (Toth & Sousa, 2019). Each member of an academic team has a specific responsibility, such as being a facilitator or tracking group progress toward the attainment of standards. Students develop elevated levels of autonomy and critical thinking skills through collaboration in academic teams (Francisco, 2013). As with team-based learning (Michaelsen & Sweet, 2008), academic teaming is student centered.
Organizing students in small collaborative groups creates opportunities for interaction, which leads to improved cognitive learning for all students (Valls & Kyriakides, 2013). Post-secondary empirical studies on team-based learning have provided evidence of student achievement gains, higher student satisfaction and engagement, and positive effects on team diversity (Kearney et al., 2009; Newmann et al., 1992; Roberge & Van Dick, 2010; Stahl et al., 2010; Stipek, 1996; Swanson et al., 2019).
Little empirical literature exists at the elementary or secondary levels that directly evaluates the hypotheses of increased student achievement from academic teaming. We have found only one study has directly assessed this relationship (Basileo, 2018). This study used propensity score matching to create a comparable control group by matching teaming students with similar students in a school district whose teachers did not receive professional development in teaming. The results of the study revealed statistically significant and positive effects in both reading and math.
Developing Resilience Through Productive Struggle
Instruction that encourages and supports productive struggle conveys the teacher’s belief that all students can learn and provides opportunities for students to persist as they develop resilience and efficacy in the face of challenging tasks (Ewing et al., 2019; Livy et al., 2018; Reeve & Halusic, 2009; Reeve & Su, 2014; Reeve et al., 2020; Warshauer, 2015; Zeybek, 2016). The term productive struggle refers to the effort that students must expend to make sense of what they are learning when their answers are not readily apparent (Edwards & Beattie, 2016; Hiebert & Grouws, 2007). Although the concept of productive struggle is rooted in mathematics education, it is applicable to all academic subjects and is essential to transformative learning processes (Murdoch et al., 2020). It develops students’ conceptual transfer skills among disparate knowledge disciplines (Sinha & Kapur, 2021; Valentine & Bolyard, 2018).
Building Student Autonomy Through Teaming
Teachers develop students’ autonomy for learning by creating proper structures and supportive democratic learning environments for them to work autonomously in teams (Han, 2020; Karademir & Akgul, 2019; Reeve, 2009; Reeve & Cheon, 2021; Reeve & Jang, 2006; Reeve & Su, 2014; Stefanou et al., 2004). Cognitive autonomy leads to the deepest level of student engagement in learning (O’Brien, 2018; Wehmeyer, 1997). Students develop autonomy and self-determination as they acquire skills in choice-making, decision-making, problem-solving, goal-setting and attainment, self-regulation, self-efficacy, self-awareness, and self-knowledge within academic teams (Kosko, 2015; Marshik et al., 2017; Ryan & Deci, 2017).
Verifying Learning to Take Action Within a Lesson
This pillar measures teacher monitoring and the use of instructional adjustments, actionable teachers, and peer feedback to improve learning processes and student self-verification.
Teacher Monitoring and Instructional Adjustments
During lessons, teachers recognize trouble spots and respond with micro interventions—adjustments made during the lesson—to clarify their understanding and regain the flow of reasoning (Alibali et al., 2013; Bonne, 2016). Students whose teachers make these adjustments earlier perform at higher levels than those whose teachers delay instructional adjustments (Coyne et al., 2013).
Teachers monitor student progress by examining evidence of learning. When teachers use evidence to adjust instruction and provide feedback to move learning forward and when students use it to adjust their learning strategies, it is formative assessment (Black & Wiliam, 2009; Panadero et al., 2018). A large body of evidence shows that formative assessment practices can improve student outcomes (Black & Wiliam, 1998; Crooks, 1988; Kingston & Nash, 2011; Klute et al., 2017; Wiliam et al., 2004).
Actionable Feedback
Although teachers believe that feedback is important for improving learning and student self-confidence, they find it exceedingly difficult to do it well (Dessie & Sewagegn, 2019; Van den Bergh et al., 2014). Effective teacher feedback uses respectful, non-evaluative, flexible, and informational language that encourages student engagement while helping them understand and correct their own behavior or performance (Hattie & Yates, 2014; Reeve & Halusic, 2009). Actionable feedback clarifies expectations and standards during learning and it provides information about the next steps after the present learning is achieved (Brooks, et al., 2019; Fluckiger et al., 2010; Guskey, 1996, 2001, 2007; Hattie, 2023; Hattie & Timperley, 2007; Looney, 2011; Shute, 2007; Stiggins, 2008). Studies have found a positive relationship between effective feedback and student achievement (Hattie & Timperley, 2007; Hattie et al., 2017; Vollmeyer & Rheinberg, 2005); however, feedback is only effective if learners receive it and understand it (Hattie et al., 2017). Peer feedback through ongoing classroom dialog among students supports understanding as it builds students’ metacognitive skills and self-regulation (Braund & DeLuca, 2018; Davies, 2001). It also provides a sense of belonging and self-worth (Shin & Johnson, 2021).
Students Verify Their Learning
Students’ verification of their own learning is a form of self-assessment in which students evaluate the results and processes of their work (Brown & Harris, 2014). Student self-assessment is a learnable competence that is linked to improved motivation, self-efficacy, self-regulation, behavior, and the quality of relationships between students and teachers (De Smedt & Van Keer, 2018; Glaser et al., 2010; Griffiths & Davies, 1993; Munns & Woodward, 2006; Olina & Sullivan, 2002; Panadero et al., 2016; Schunk, 1996). Accurate self-assessment occurs when students use exemplars or other assessment data such as tests and graded work, and participate in establishing criteria for work quality (Brown & Harris, 2014; Harrison et al., 2015; Ross, 2006).
Self-assessment works most effectively when students receive feedback from their peers in a classroom climate that provides psychological safety for self-evaluation (Brown & Harris, 2014; Harrison et al., 2015; Ross, 2006). Furthermore, when peers hold each other accountable, they feel motivated to perform at higher levels and become more self-reliant as learners (Panadero et al., 2016; Stein et al., 2016).
Using Data to Track Student Progress Toward Standards
This pillar measures the effectiveness of school leaders and teachers by systematically incorporating short-, mid-, and long-cycle data to improve the quality of teaching and learning in the school, and the degree to which the school leader uses data to ensure teacher accountability for student learning.
Short-, Mid-, and Long-Cycle Data to Improve Student Learning
Effective school leaders and teachers use short-, mid-, and long-cycle data to continually improve the quality of teaching and learning in schools (Wiliam, 2006). Long-cycle data span marking periods, semesters, or years. Educators can collect medium-cycle data within and between teaching units, and short-cycle data during and between lessons.
To be formative, an assessment must provide evidence that allows teachers to interpret the learning needs of students and use that evidence to adjust instruction to meet these needs (Black & Wiliam, 1998, 2009). Examination of short-cycle formative, mid-cycle interim, and long-cycle summative data provides essential elements for decision making in schools and districts.
Teacher Accountability
The goal of teacher accountability is for teachers to hold themselves accountable and work within their peer teams to ensure that students progress toward mastery of the standard. The level of accountability influences teachers’ assessments of student performance and the cognitive processes they use to make judgements. These judgements are either category- or attribute-based. Teachers with low accountability tend to use category-based processing to determine student performance levels, whereas teachers with high accountability use attribute-based processing. Category-based processing involves social categories or stereotypes, requires simple cognition and can be inaccurate (Fiske, 1993; Fiske & Neuberg, 1990). Attribute-based processing considers numerous different personal attributes, requires complex cognition, and is more accurate and detailed than the former (Fiske & Neuberg, 1990; Krolak-Schwerdt et al., 2013). Given the importance of teacher judgement in assessing student performance, accountability is an important driver of accuracy and the elimination of assessment bias.
For teachers to be accountable, they must have the autonomy to control the conditions that contribute to successful student learning. The degree of professional autonomy that teachers exercise in the performance of their duties influences the quality of teaching and student learning (Ingersoll & Collins, 2017). Teachers’ professional autonomy is positively associated with student autonomy and self-regulation as learners (Ahn et al., 2021; Soenens et al., 2012). However, recent top-down accountability requirements for school improvement in the United States have decreased the autonomy that teachers and school leaders exercise over major decisions, affecting the quality of instruction and school climate (Ryan & Deci, 2020; Ryan & Weinstein, 2009). Ingersoll and Collins (2017) found that schools with the most centralized decision-making and the least teacher autonomy often perform the poorest.
Successful school and teacher accountability depend on leadership. Leaders must establish a clear path to the stated goals, support execution through team interdependence, and measure performance (Jamal et al., 2015). This requires an open and caring climate that allows honest informational feedback about improving instructional practice as it encourages teachers to achieve high levels of performance (Freed et al., 2021; McCarley et al., 2016). Leaders must be able to identify students who need interventions and hold teachers accountable for appropriate actions to ensure learning.
In summary, we designed a Rigor Appraisal to measure five critical components of rigor: Creating Conditions for Learning Rigorous Standards, Using Standards-based Student Evidence, Activating Student Teams to Achieve the Standard, Verifying Learning to Take Action within a Lesson, and Using Data to Track Student Progress toward Standards. Accordingly, we expected to find that the Rigor Appraisal would be predictive of achievement and other measures of school effectiveness. More specifically, we expected that a positive change in the Rigor Appraisal scores over time would predict changes in achievement and other leading indicators of school effectiveness. Therefore, we formulated the following hypotheses:
H1. The change in the Rigor Appraisal has a positive and statistically significant relationship with achievement and other measures of school effectiveness.
H1a. The Rigor Appraisal will have a positive and statistically significant relationship with achievement.
H1b. The Rigor Appraisal will have a positive and statistically significant relationship with other school effectiveness measures.
H1c. The Rigor Appraisal will have a positive and statistically significant relationship with school wellness measures.
H1d. Program effectiveness measures of the Rigor Appraisal implementation will have a positive and statistically significant relationship with achievement.
H2. Specific Rigor Appraisal pillars will impact achievement differently.
The next section discusses the methods and operationalization of measures used in the study.
Methods
The study sample included 53 schools in a district in Illinois that conducted Rigor Appraisals during the school year and recorded student achievement scores. The district served a diverse student population of approximately 35,000, of which 46.4% of students were low-income, 39.1% were English Learners, and 18.6% had disabilities (SWD) (Illinois State Board of Education, 2023).
School-level Rigor Appraisals were adjudicated by external instructional coaches using a software tool that included a scoring rubric for items in each pillar using a 12-point Likert scale. To ensure rater reliability, the instructional coaches participated in calibration training. This 6-hour training included the content of the Rigor Appraisal instrument and the process of capturing evidence of rigorous instruction and academic teaming structures during classroom observations. Participants practiced scoring the Rigor Appraisal using illustrative videos of classroom instruction. Subsequently, the coaches participated in three calibration sessions at the schools. Upon completion, the coaches were certified, and a master scorer accompanied them on the first Rigor Appraisal data collection cycle to ensure accuracy.
The coaches completed three appraisals per school building during the school year. During each Rigor Appraisal, the coaches met onsite with the principal and school leadership teams. They jointly scored at least 10 randomly selected classrooms to ensure the accuracy of schoolwide trends. Afterwards, they were debriefed on their observations, identified baseline conditions, and determined the next steps for school improvement. They used the aggregated results to guide the school leadership team in identifying system-based root causes and prioritizing actions for change. Teachers remained anonymous, as scores were non-evaluative (not a part of teachers’ annual professional evaluation), and no teacher-identifying information was gathered.
School leadership teams also completed a training course to learn how to conduct nonrandom instructional classroom walks. Unlike the Rigor Appraisals, instructional walks were conducted by school leadership teams to help advance improvement work between Rigor Appraisals and to build internal capacity.
Measures
This section discusses the outcome measures for achievement, school proficiency, and learning rates. It also reviews the independent variables used in the models, including the Rigor Appraisal and pillar scores, school effectiveness measures (Weekly Attendance, Student Referrals, Student Suspension, and Teacher Retention), school wellness measures (5Essentials, Ambitious Instruction, Supportive Environment, Involved Families, Collaborative Teachers, and Effective Leaders), and program effectiveness measures of the Rigor Appraisal implementation (Instructional Walks and Coaching Days).
Achievement
We calculated two school-level achievement measures using spring-to-spring state-assessment data. First, we considered the change in student proficiency in English Language Arts (ELA) and math to assess the correlation levels with the independent variables. We then calculated school-level Learning Rates in ELA and math. These measures are described below.
We used the Illinois Assessment of Readiness (IAR), ELA, and math scores to gauge changes in student proficiency. This was calculated by taking the difference between the percentages of students who met or exceeded proficiency in IAR in ELA and math from spring to spring. Change in proficiency was used as a proxy for student achievement because it is a traditional measure that is easily available.
While the percentage of proficient students is a common measure of achievement, it only measures the number of students below, at, or above a certain scale score level. Proficiency rates do not exist outside the value systems of setting cut-off scores (Cizek, 2011; Jaeger, 1989; McClarty et al., 2013; Shepard, 1979). Interpretations of the percentage of proficient students are unpredictable and can lead to incorrect or incomplete inferences about distributional changes (Ho, 2008). We purposely moved away from proficiency because of the known statistical and substantive costs of making comparisons due to their limited and unrepresentative depictions of test score trends. Furthermore, when operating in lower-performing schools, the percent proficiency was less likely to have variability compared to investigating growth on scale scores across two points in time. Lower-performing students can grow but still fall below proficiency levels depending on how far they are from the cut-off score. Thus, we include two additional proxies of achievement in this study: school Learning Rates in ELA and Math, respectively.
Using H. S. Bloom et al. (2008) as a guideline, we calculated the effect sizes for each grade-to-grade pair (third to fourth, fourth to fifth, etc.) for each school in the district. We used this approach because H. S. Bloom et al. (2008) found that regardless of the assessment, student growth in achievement is greatest in elementary grades (K to first grade is about 1.5 standard deviations), and then declines throughout middle and high school (11th to 12th grades is about 0.05 standard deviations). If the number of students in each grade level is not accounted for, schools with a larger number of younger students will appear to have higher achievement. Consequently, learning rates account for the average growth and the number of students in each grade.
We used Hedges’g effect size formula for each grade-level pair because it is the most appropriate effect size when accounting for small samples (What Works Clearinghouse, 2022). This effect size metric represents the mean difference between two groups of observations at two points in time on a standard deviation scale. We calculated the effect sizes using all students in the district who were tested from spring to spring for ELA and math. We then aggregated the pairs to the school using weighted averages that accounted for the number of students within each grade to create an overall school Learning Rate for each subject area. Hedges’g formula is shown in equation (1).
Hedges’g Formula

•
•
•
•
•
•
•Omega (ω) is the small sample size correction
○ It is equal to
The IAR is not a vertically scaled instrument. Because there were no other available district assessment data, we tested the premise that Hedges’g could still be calculated using a non-vertically scaled assessment. If we had not tested this, effect sizes based on a non-vertically scaled assessment might have produced an erroneous ordering of schools and distorted the correlation coefficients. Briggs and Domingue (2013) found that non-vertical scaling impacted grade-to-grade comparisons only when there was a large degree of scale shrinkage, which restricted the range of gain scores. Furthermore, they found that correlation levels dropped from .87 to .57 when grade-to-grade standard deviations were −0.30 or less. Consequently, anything equal or less than −0.30 could have impacted the ordering of schools.
In our study, we assessed effect sizes of all grade level pairs prior to calculating the weighted school averages and found that only 3% (4 out of 139) had standard deviations less than or equal to −0.30. Consequently, with such a small impact, we concluded that this would not have a significant effect on the ordering of schools, and that the effect sizes should represent a more precise measure than proficiency gains. The next step in the investigation was to validate this assumption by examining the correlation between learning rates and student proficiency. Next, we considered the independent variables used in the investigation. The first set of indicators measured the Rigor Appraisal, followed by school effectiveness measures, school wellness (as measured by the Illinois State Board of Education), 5Essentials survey, and program effectiveness measures.
Rigor Appraisal
Each pillar contained three to four items, and the instrument used a 12-point Likert scale (1–3 = strongly disagree, 4–6 disagree, 7–9, agree, 10–12 = strongly agree). To calculate the overall score, we averaged the scores for each item within the pillar, and then averaged each of the five pillar scores to determine the overall mean score for the observation. Table 1 lists the alpha coefficients of each pillar over time. A Cronbach’s alpha of .6 and higher was considered a reliable measure, and all alpha coefficients were greater than that threshold (What Works Clearinghouse, 2022).
Cronbach’s Alpha of Rigor Appraisal Pillars.

We then calculated the raw score changes from fall to spring. In addition to the raw score changes, we used OLS regression to calculate the Beta coefficient for each school. The Beta estimated the magnitude of change over the course of the three Rigor Appraisals and accounted for the number of days on which the Appraisals occurred during the school year. This method reduced the measurement error of the coders, as it smoothed out the trendline over time.
School Effectiveness
School effectiveness measures incorporated all the traditional leading indicators of achievement, including Weekly Attendance, Referrals, Suspensions, and Teacher Retention. Weekly Attendance was defined as the average percentage of students that attended the school. Referrals and Suspensions were the sum of the total number of behavioral referrals and suspensions for the year. Typically, we would have investigated the changes over time but because of the pandemic and virtual schooling, the rate of change was unavailable for these indicators. In addition, we used publicly available teacher retention dates and calculated the changes for each year.
School Wellness
Schools participate in the Illinois 5Essentials Survey (Illinois State Board of Education, n.d.) annually. The 5Essentials Survey identified five indicators that improve school outcomes: Effective Leaders, Collaborative Teachers, Involved Families, Supportive Environments, and Ambitious Instruction. We included the 5Essentials survey data in our analysis to assess whether the Rigor Appraisal and the state indicators of school wellness were correlated, as the survey has been shown to be predictive of school achievement (Hart et al., 2020). We measured the change over time for each of the 5Essentials in addition to the overall 5Essentials change score by averaging the indicators for each year.
Program Effectiveness
Program effectiveness included four measures: the total number of Instructional Classroom Walks conducted by the principal and school leadership team, the total number of Classroom Walks in ELA and in Math, and the number of third-party Coaching Days focused on the Rigor Appraisal data. We included these as measures in the study because we expected that increases in them would lead to observable changes in classroom instruction, which would impact achievement.
We used Pearson’s correlation coefficients to examine the validity of the Rigor Appraisal and to assess the magnitude and direction of the relationships between the dependent and independent variables. Correlation analyses were performed to assess the predictability, strength, and direction of the observational instruments. Cohen’s (1988) conventions were used to interpret effect sizes of .10, .50, and .80 standard deviations as small, moderate, and large, respectively. As H. S. Bloom et al. (2008) pointed out, these guidelines are not always relevant to intervention effects in education. However, they may be used when there is no better basis for estimating the magnitude of the impact across studies (Cohen, 1988).
In addition to correlation analyses, we used OLS regression to investigate the relationship between the Rigor Appraisal score, pillar scores, program effectiveness measures, and school demographic estimates to predict ELA and Math Learning Rates. School demographic measures included the percentages of SWD and low-income students. The OLS regression provided the best unbiased linear estimates of the coefficients and was a simple way to estimate the parameters of a linear relationship between variables at the school-level.
Results
Table 2 presents the sample’s descriptive statistics. The number of schools ranged from 48 to 53 depending on the measures examined. The change in proficiency varied from −25% to an increase of 14% proficiency. The ELA Learning Rate exhibited a drop of −0.85 standard deviations to an increase of 0.72. Rigor Appraisal change scores also fluctuated from −0.45 scale score point decrease to a 3.27 increase from fall to spring.
Descriptive Statistics.

Next, we investigated the validity of the ELA and Math Learning Rates that were calculated and compared with proficiency. Table 3 shows a moderate to large association and statistically significant relationships between ELA and Math Learning Rates and Proficiency. Furthermore, it should be noted that after removing the four schools that could possibly have impacted the ordering of schools (standard deviations of grade pairs that were −0.30 or less), the magnitude of the correlations remained unchanged. We also investigated correlations among students who took only spring-to-spring tests. The missing assessment data from the baseline year lowered the correlation levels with proficiency. Consequently, ELA and Math Learning Rates that included all tested students from both years were a more valid predictor of Proficiency in this instance.
Proficiency and Learning Rate Correlation Coefficients.

Note. Correlation is significant at *p < .05 and **p < .01 levels.
Next, we investigated the first hypothesis that the Rigor Appraisal has a positive and statistically significant relationship with achievement and other effectiveness measures. We found partial support for H1a as demonstrated in Table 4, which shows that the Rigor Appraisal had a small to moderate and statistically significant association with ELA Learning Rate and it approached statistical significance with math Learning Rate. Rigor Appraisal and ELA and Math Proficiency had weak relationships that were not statistically significant. Furthermore, the Rigor Appraisal Beta had a very small and negative relationship with achievement, and it was not statistically significant.
Rigor Appraisal, Beta, and Achievement Correlation Coefficients.
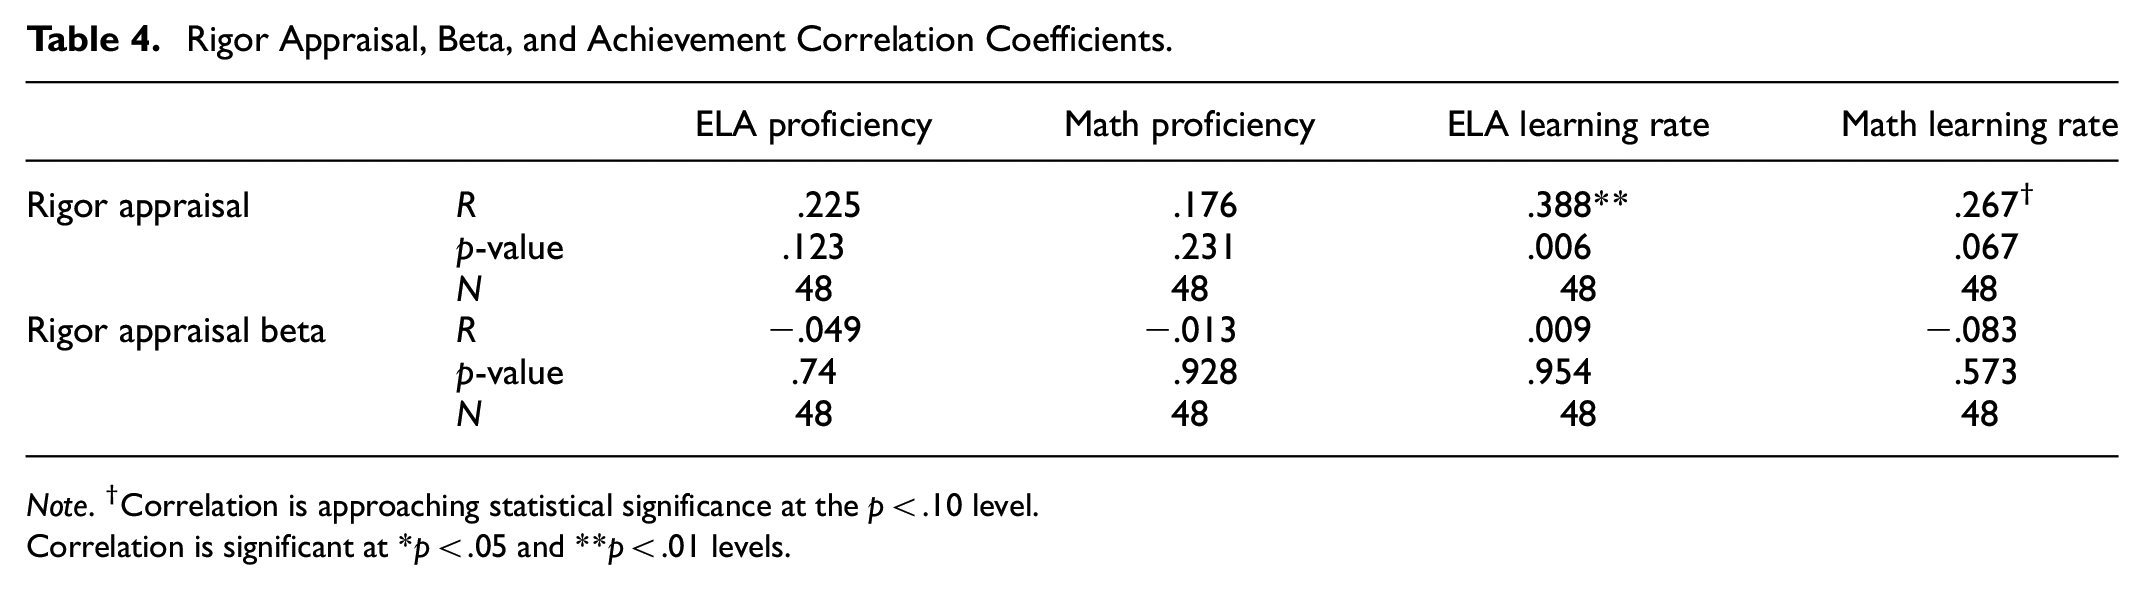
Note. †Correlation is approaching statistical significance at the p < .10 level.
Correlation is significant at *p < .05 and **p < .01 levels.
Table 5 shows support for the assertions put forth in H1b, that the Rigor Appraisal had a moderate and statistically significant association with three of the four program effectiveness measures. More specifically, it had a positive and statistically significant association with Weekly Attendance, meaning that as Rigor Appraisal scores increased so did attendance. Further, the Rigor Appraisal had a negative and statistically significant relationship with Referrals and Suspensions, meaning that as it increased, Referrals and Suspensions decreased. The Rigor Appraisal was not statistically significant with Teacher Retention. Interestingly, while the Rigor Appraisal Beta did not have a relationship with achievement, it had a moderate to large and statistically significant relationship with almost all school effectiveness measures except for Teacher Retention.
Rigor Appraisal, Beta, and School Effectiveness.

Note. †Correlation is approaching statistical significance at the p < .10 level.
Correlation is significant at *p < .05 and **p < .01 levels.
Table 6 reflects support for H1c as it provides evidence for the relationship between the Rigor Appraisal and measures of school wellness. The 5Essentials had a moderate and statistically significant association with the Rigor Appraisal and all measures of achievement. In other words, as the 5Essentials increased year over year, so did the Rigor Appraisal and achievement. Four of the five 5Essentials categories had statistically significant associations with the Rigor Appraisal, except for Involved Families.
The 5Essentials, Rigor Appraisal, and Achievement.

Note. †Correlation is approaching statistical significance at the p < .10 level.
Correlation is significant at *p < .05 and **p < .01 levels.
Finally, we found evidence to support H1d as we examined the impact of program effectiveness and achievement. As shown in Table 7, Instructional Classroom Walks and ELA and Math Classroom Walks had small to moderate statistically significant associations with Math Proficiency and ELA and Math Learning Rates. In other words, the more school leadership teams conducted Instructional Classroom Walks, the stronger their association with achievement. Additionally, Coaching Days had a small-to-moderate statistically significant association with ELA and Math Learning Rates. Thus, the more coaching days a school had, the greater the achievement on the state assessment.
Program Effectiveness Measures and Achievement.

Note. †Correlation is approaching statistical significance at the p < .10 level.
Correlation is significant at *p < .05 and **p < .01 levels.
For the last hypothesis, H2, we explored whether certain pillars of the Rigor Appraisal impacted achievement differently. To this end, we first investigated the Pearson’s correlation coefficients. Table 8 shows that two Rigor Appraisal pillars, Using Standards-based Student Evidence and Activating Student Teams, had a small to moderate and statistically significant association with achievement, with the latter having larger correlations in size.
Rigor Appraisal Pillars and Achievement.

Note. †Correlation is approaching statistical significance at the p < .10 level.
Correlation is significant at *p < .05 and **p < .01 levels.
Next, we used OLS regression to predict achievement. Three different models are depicted in Table 9. First, we wanted to investigate whether the Rigor Appraisal predicted achievement, controlling for Low Income and SWD. Second, we assessed which pillar was the strongest predictor of achievement by controlling for school characteristics. Third, we created an interaction effect between the Activating Student Teams and Low Income groups, as it has been hypothesized that Academic Teams may improve student learning in low-income schools (Toth & Sousa, 2019).
The Effects of Rigor Appraisal and ELA Achievement.

Note. SE = standard error.
Approaching statistical significance at the p < .10 level.
Statistically significant at *p < .05 and **p < .01 levels.
In the first model, we found that regardless of school demographic measures, ELA Classroom Walks was the largest predictor in the model with the Adjusted R2 explaining 30% of the variance in the ELA Learning Rate. The Beta value of 3.27 indicates that a one standard deviation increase in the Rigor Appraisal results in a 3.27 standard deviation increase in the ELA Learning Rate. The second model removes the full Rigor Appraisal measure and includes only the pillars. Interestingly, all program effectiveness measures except ELA Classroom Walks dropped out of statistical significance, leaving Activating Student Teams as the largest predictor of the ELA Learning Rate. The third model included the interaction variable, and we found that when Activating Student Teams increases and Low Income is higher, there was a greater impact on achievement.
We investigated the same models using the Math Learning Rate as outcome variable. We found that Low Income was statistically significant in the first model, whereas Activating Student Teams was not. However, the interaction variable was also statistically significant, and the Adjusted R2 values increased by 6% from model 1 to model 3 (.25 to .31). Furthermore, Math Classroom Walks approached statistical significance in all three models, demonstrating the importance of instructional leaders in observing teachers’ classrooms.
Discussion
In summary, we found that the Rigor Appraisal had a small to moderate and statistically significant association with achievement, a positive and moderate statistically significant association with Weekly Attendance, a negative relationship with Referrals and Suspensions, and a positive and moderate statistically significant association with the 5Essentials. In addition, the activation of student teams was associated with greater achievement in schools with more low-income students. We also found that Instructional Classroom Walks had a positive and statistically significant impact on achievement, regardless of the subject area.
Study Limitations and Future Research
The context in which we conducted the study should be noted as it occurred when there was a national decline in student achievement during the pandemic. However, we did not observe the same kind of regression in our analysis as we did nationally. The Rigor Appraisal process may have helped slow the decline in achievement that occurred elsewhere across the nation because of its use as part of “measurement for improvement” processes that are essential to system transformation (Takahashi et. al., 2020). In this sense, the Rigor Appraisal provided critical data that were motivating factors for collaborative improvement efforts. These data were closely connected to key processes, timely, and easy to analyze regularly. The data collection and analysis processes were also transparent and built stakeholder trust. Regardless of the exact cause, the instrument’s predictability to achievement appears strong in this context.
Despite this strength, this study has several limitations. First, there were disruptions to in-person instructions, which limited the time during which observations could occur. There were also unanticipated changes in the personnel assigned to teaching teams, which resulted in fewer classrooms being consistently observed throughout the study period. Moreover, there was a large amount of missing data. Approximately 35% to 48% of the assessment scores were missing at the baseline year for grade level pairs district-wide. In the calculation of Learning Rates, we retained all the tested students in the distribution to reflect the true population of students more accurately, as we did not want to inadvertently create testing bias by removing students that were not tested at baseline.
We investigated this further and used several models to assess whether the students with missing baseline scores were statistically different. We found that those who did not take the baseline assessment were more likely to score 2.31 scale score points lower on the prior year’s ELA assessment and 4.9 scale score points lower in math, controlling for student characteristics and accounting for the clustering of students within schools. These findings are statistically significant. Additionally, Black, Hispanic, and low-income students were significantly more likely to have a missing baseline assessment, and gifted students were significantly more likely to have a score. Further, the findings remained true across subject areas. Consequently, our calculations did not account for missing student data for the baseline year, and changes in proficiency did not account for those missing test scores.
Other limitations include the fact that the results may not be generalizable, as they are based on one school district. Furthermore, the methods used in this study should not be used to make causal inferences. The OLS models attempted to go beyond correlational analysis, and the Rigor Appraisal measures were scored prior to the administration of the state assessment; much more investigation is warranted to ultimately infer causality. Other confounding variables may have also affected the results.
Future studies should include replicating these findings in different contexts. In this study, the pillar of Activating Student Teams had the largest impact on achievement, but would this always hold true or only in certain circumstances? If the other pillars do not directly impact achievement, in what context do they matter? Moreover, the statistically significant negative correlation between the pillars when Using Data to Track Progress was in the unexpected direction. Further investigations with larger sample sizes are warranted to determine why this association was negative. Another area for future work is a more in-depth assessment of interrater reliability among the third-party-certified coaches. It proved costly to have additional third-party-certified coaches travel to ascertain interrater reliability. Future research should attempt to account for other ways of measuring this, such as video-recording walks for coder verification.
Finally, further exploration should try to pinpoint why Instructional Classroom Walks impacted student achievement. Qualitative interviews with leaders and teachers may be useful in determining how the Walks aided the change process. While there are scoring rubrics associated with the Walks, it was outside the scope of this study to isolate the impact of Walk scores. Future studies may be the key to highlighting how Walks help develop school leaders and build the internal capacity of schools.
Evidence-Based Policy Implications
This study has potential policy implications for both research and practice. First, it demonstrates how the Rigor Appraisal can be an important source of data as it provides a more comprehensive view of the conditions and practices that affect the quality and equity of education that students receive. The study shows that school leaders can use the Rigor Appraisal as a leading indicator of the quality of teaching and student learning, as low scores on the pillars provide actionable areas for improvement without resorting to frequent interruptions of instruction for testing. As such, these data could aid in continuous improvement rather than being based on accountability and compliance (Mandinach & Schildkamp, 2021). Accordingly, we offer the following recommendations.
Random school-wide trend data should be systematically collected by external coaches as they have proven to be a leading indicator of achievement. Replicating this process with a strict focus on classroom instruction could serve as a key area for continuous data-driven improvements. Using a certified coach was fundamental to creating an informative collaborative environment in which leaders could learn collaboratively.
Districts and school leaders should implement non-evaluative Instructional Classroom Walks to provide feedback on instruction on a regular basis.
Professional development to foster student academic teams may help increase achievement, particularly in lower-performing schools.
Overall, the Rigor Appraisal incorporates the essential conditions in schools that support a positive climate for learning, the structures that support the alignment of curricula and instruction with the intent and rigor of academic standards, student mastery of those standards, and the quality of learning tasks to engage all students in learning at higher levels of cognition. Coupled with Instructional Walks, Rigor Appraisal shows promise as a more efficient, consistent, and cost-effective source of data to inform educational improvements and policy.
Conclusion
In summary, our findings indicate that data from the Rigor Appraisal may provide a sound basis for practitioners’ decision making to improve the quality of instruction in their schools. It appears to provide both broad and focused measures with the potential to inform educational improvement and policy development. It shows promise as a valuable tool to aid schools in recovering from the effects of the pandemic, improving educational equity, and reducing academic performance disparities among students from low-income backgrounds. It also has the potential to decrease reliance on interim or benchmark assessments of student progress and reduce interruptions in instructional time for testing. Using it as a source of leading indicators may help educators make better-informed, proactive, and real-time changes to instruction that accelerate learning, improve the quality of teaching, and improve academic outcomes for all students.
Footnotes
Acknowledgements
None.
Ethical Approval
Not Applicable.
Declaration of Conflicting Interests
The author(s) declared the following potential conflicts of interest with respect to the research, authorship, and/or publication of this article: The authors disclose that the research in this study was conducted under the auspices of Instructional Empowerment’s Applied Research Center, a division of Instructional Empowerment, LLC. The Rigor Appraisal instrument was created by the Applied Research Center. Instructional Empowerment’s consultancy uses the Rigor Appraisal in school districts to measure systems change.
Funding
The author(s) received no financial support for the research, authorship, and/or publication of this article.
Data Availability Statement
Data sharing not applicable to this article as no datasets were generated or analyzed during the current study.