
Abstract
There is a growing awareness that the condition of the built environment has a substantial impact on health. Systematic housing conditions surveys are a method for developing information about the physical condition of housing. This paper introduces the Center for Economic Information’s (CEI) Neighborhood Housing Conditions Survey (NHCS). We discuss the history and implementation of the NHCS in light of other academic and civic housing conditions surveys. The paper also reviews the history and method of the NHCS. We find that housing conditions surveys are generally designed from scratch for each new research program, translating survey results into policy remains underdeveloped in the scholarly literature, and heterogeneity between surveys reduces the ability to compare observations across space and time. The NHCS may address some of these issues, suitable as an “off the shelf” template, adjustable to suit programmatic needs, and providing a baseline consistency across space and time.
Keywords
Introduction
This paper aims to introduce the Center for Economic Information’s (CEI) Neighborhood Housing Conditions Survey.
There are two complementary contributions of the paper: the first contextualizes our survey in terms of other similar surveys, and the second includes a history of the Neighborhood Housing Conditions Survey’s implementation and a description of how the survey is carried out. The CEI’s Neighborhood Housing Conditions Survey (hereafter NHCS) embodies a consistent methodology for gathering parcel-level data about the urban built environment. The NHCS was designed to be a benchmarking tool for the identification and analysis of material public policy, but over time, the applications of the tool have changed. Taking our cues from well-established connections between the built environment and health outcomes (Krieger & Higgins, 2002), we present the NHCS as a promising method for compiling observations about the built environment for the quantitative study of the social determinants of health. Potential applications of the NHCS include a component in comprehensive community needs assessments and in planning for climate change mitigation through housing interventions. The NHCS has been carried out 22 separate times (spanning 2000–2023) in the Kansas City, Missouri metropolitan area. Our survey embodies an archive of information describing the changing parcel-level conditions of Kansas City. The parcel-level GIS capabilities necessary to carry out and visualize the survey are now widely available, and the NHCS is a good candidate for widespread implementation.
Contextualization of the NHCS
The NHCS uses a standard methodology to generate ratings that are reliable over time, space, and between surveyors; it is readily conceptualized as a type of Systematic Social Observation (SSO), an observational approach the sociologist Albert Reiss (1971) described as “observation and recoding done according to explicit procedures which permit replication and … which permit the use of the logic of scientific inference.” The SSO approach is applied wherever the condition of public space is relevant to the phenomenon being studied (Baggetta & Bredenkamp, 2021; King, 2015; Sampson & Raudenbush, 1999; Wei et al., 2005). Criminologists often use SSO as a research methodology to understand geographic contributions to incivilities (Odgers et al., 2012; Sampson & Raudenbush, 1999). There is, however, no reason for the objective observation of the built environment to be limited to such applications. Systematic social observation is a profoundly adaptable tool; for instance, it is used to understand how buildings and meeting rooms influence the organizational relationships and connections made among civil society organizations (Baggetta & Bredenkamp, 2021). The SSO approach is also amenable to applications that seek to quantify the impact of the built environment in the production of health outcomes (Schuch et al., 2017), an approach that compliments epidemiological approaches that formalize the knowledge of lay persons regarding their health (Cannuscio et al., 2009).
Though NHCS operates in the Chicago School of Urban Sociology tradition, most of the NHCS sponsors did not use the survey for academic research. Many different organizations and agencies have sponsored NHCS surveys without the intention of producing peer-reviewed research. The City of Kansas City, Missouri, commissioned CEI’s original housing conditions survey to inform public housing policy. Other survey implementations were sponsored by the Unified Government of Wyandotte County, the National Institutes of Health, the American Recovery and Reinvestment Act, Greater Kansas City Local Initiatives Support Corporation, and the U.S. Department of Housing and Urban Development, among others. The diversity of funders underscores the variety of uses to which the NHCS has been and can be put. The NHCS fills an important niche, providing reliable quantified information about the built environment that is amenable for use in data-driven planning and assessment of public policy and private initiatives.
This section broadly divides visual-assessment housing surveys by academic and civic application. There is considerable overlap between these two categories in practice, with academic work ideally supporting civic undertaking and vice versa. The work of the CEI’s NHCS falls into both these categories. The NHCS was not designed for academic use; however, it has increasingly been put to those uses in the past decade. In our summary of civic applications of housing condition surveys, we draw extensively on the National Neighborhood Indicators Partnership (NNIP). In our engagement with academic work, we focus on applications relevant to public health and epidemiology (rather than the previously mentioned criminology applications).
Civic Applications
Our review of systematic civic surveys of the urban environment is limited to the work done by the organizations associated through NNIP. Reviewing the NNIP parcel-level survey work that began between 2006 and 2018, we can summarize a representative cross-section of programmatic civic assessments of housing conditions and contextualize the NHCS. NNIP is a “learning network, coordinated by the Urban Institute,” representing 30 cities from across the United States (National Neighborhood Indicators Partnership [NNIP], 2023). The organizations associated through NNIP are independent. To qualify for membership in NNIP, an organization must be a locally focused data intermediary with recurrently updated information on neighborhood conditions and working on enabling the use of data in policy-making and community development. A specific emphasis on the “institutions and residents of distressed neighborhoods” is another essential criterion. NNIP is a knowledge-sharing network; as such, reciprocity and participation in networking events are required by member organizations. There is a tradition of using NNIP to improve public health that reaches back several decades (Howell et al., 2003). The CEI is currently an alumni member of NNIP.
A 2018 review of NNIP housing conditions survey initiatives indicated that housing conditions surveys had taken place in Memphis, Pittsburg, Camden, Boston, Cleveland, Dallas, Detroit, Manhattan, Providence, Philadelphia, Atlanta, Memphis, Washington D.C., and Fort Worth (A high-level summary of five of these programs is provided in Supplemental Material SM1). The cost and extent of these surveys varied considerably. For instance, the 2008 survey in Memphis cost $338,000 for 200,000 parcels (∼$1.70 per parcel), while $600 was allocated for the Providence survey of 42,000 parcels (∼$ 0.01 per parcel). Further heterogeneity of the programs extends to the types of structures surveyed (residential, commercial, both), whether photo documents were collected in addition to the survey observations, a record of the kind of building (vacant, single family, apartment, etc.), how the physical condition of structures are described (indicating fire damage, codes violation yes/no, detailed ratings of multiple housing characteristics), and the degree to which information was gathered about the surrounding built environment (streetlights, road conditions, the presence of curbs etc.).
The heterogeneity of the NNIP surveys may create the impression that they are a hodge-podge without substantive similarities. However, such an is tempered by considering the varied purposes and constraints of these survey initiatives. A memo compiled to guide the Pittsburg NNIP partner (hereafter Gradek Memo) in creating a new housing survey instrument enumerates vital lessons for the task.
The Gradek memo contains valuable advice for designing and implementing a housing conditions survey. Some advice is similar to that which can be found in academic publications; “solicit input of community organizations in developing the collection instrument” (Brown & Kyttä, 2014) and “[i]t is best to survey specific elements of a community (individual properties, sidewalks, etc.), and aggregate up to block or neighborhood levels to produce totals,” and institute “training and data reliability checks” (B. Wilson et al., 2019). Other advice is critical but unlikely to be found in an academic paper. He writes, “survey instruments” should be “idiot-proof,”“be aware of safety issues,” and that “coordination of data collection efforts is essential” for high-quality, consistent data (Gradek, 2009).
Those points notwithstanding, the first point mentioned in the Gadek Memo is essential: “Have a clear sense of how the data will be used after it is collected. The purpose should drive the effort” (Gradek, 2009). Combining this lesson with the truism that funding is always limited implies that the heterogeneity of the NNIP surveys is by design. The initiatives in which surveys are deployed address many concerns; thus, the instruments will be tuned differently (sometimes radically so) in different locales. Housing conditions surveys are purpose-built instruments subject to time, funding, and labor power limitations. With that in mind, it would be a remarkable coincidence if these surveys exhibited a convergence regarding scale, scope, cost, or category.
The diversity of the NNIP cross-section underscores the importance of neighborhood residents and researchers working reciprocally to identify, collect, and utilize information about the urban environment. This process of reciprocal collaboration is discussed in the scholarly literature as Data Driven Organizing (DDO), whereby the collection of information about the built environment organizes the stakeholders related to the data being gathered (Teixeira & Wallace, 2013). DDO is intended to build on and engage with neighborhood residents’ tacit knowledge about their environment and experiences (Cannuscio et al., 2009). Relevant to this review, the survey mentioned in Teixeira and Wallace (2013) was designed by an NNIP affiliate, instituted consistent with DDO, and produced new knowledge sufficient for academic publishing. CEI’s experience carrying out the NHCS was added to the knowledge base that produced the Pittsburg memo, the survey used in Teixeira and Wallace (2013), and the survey activities alluded to above.
Academic Literature
Concerning the academic literature on housing condition surveys, we introduce three methods to contextualize the NHCS: the quality of the instrument, the method of gathering data, and the second-order structure of the surveys in the literature. We do not attempt a systematic review of the housing conditions survey literature. Other researchers have systematically reviewed the housing conditions surveys used in the academic literature (Pineo et al., 2018). We discuss but do not replicate that work.
One method to contextualize the housing conditions survey is by using established metrics to judge the desirable properties of a survey. The quality of a survey instrument can be judged according to the criteria of cost, coverage (or completeness), availability, validity, and accuracy (King, 2015). Alternatively, the survey instrument can be judged by the outcome of the process it is in service to, that is, a survey used in a project focused on remediating vacant homes can be evaluated in terms of the homes remediated as a result of the survey (Pineo et al., 2020).
The five judgment criteria can be applied to sample data to choose among survey options. For instance, the criteria of completeness can help a research team decide between different survey implementations, for example, in-person assessment versus remote viewing (King, 2015). To utilize these criteria most accurately, the judgment must be based on an “apples to apples comparison”; surveys implemented on the same type of geography (i.e., city, neighborhood, block, parcel, etc.). Alternatively, the judgment criteria can help a research team decide which potential survey to implement. Cost, accuracy, and validity all inform the choice of a survey aimed at parcel geography versus point geography. These criteria touch on issues of scale (i.e., zip code vs. parcel) and exactness (i.e., street centerline vs. parcel centroid), enabling the survey to meet its purpose (Briant et al., 2010; Kaplowitz et al., 2010; Zandbergen, 2009). The cost per parcel will vary with the geography of choice. Surveys that ascribe observations to larger geographies are, other things equal, less expensive than surveys that focus on smaller geographies (i.e., block-level surveys are cheaper than parcel-level surveys). The additional criteria of flexibility was suggested in a review of the NHCS (B. Wilson et al., 2018, 2019).
Alternatively, we can group surveys by how they are implemented. The NHCS is carried out by paid, trained surveyors via slow-moving car. Windshield surveys of this sort have an extensive history that is at least as old as the SSO technique (Callan, 1971; Keczmerski and Sorter, 1984; Nickelson et al., 2013). Other transportation options are possible; it is possible to carry out the survey via bicycle (Kwate & Saldaña, 2011). A hybrid approach between in-person and remote surveying is the video geo-narrative. In that case, a digital video recording of housing is made in the field and then analyzed in the laboratory (Schuch et al., 2017). The last decade has seen the automated assessment of housing conditions developed via field photography (Bader et al., 2015; Odgers et al., 2012). There is literature about potential bias in visual assessments and reliability of Google street view based instruments (Clarke et al., 2010; Smith et al., 2021). Assessment via moving vehicle forces the surveyors to work at the machine’s speed, lowering the labor cost. Remote sensing methods amplify the imperatives of speed and low labor costs. The technique of survey implementation has implications for data-driven organizing. Remote viewing is less amenable to the organization of people in the data-gathering process.
A third method for contextualizing the NHCS is according to the article “Urban Health Indicator Tools of the Physical Environment: a Systematic Review” (Pineo et al., 2018). The authors use a five-class taxonomy (spatial scale, purpose, topic, scope, and formation) to understand the diversity of “Urban Health Indicator Tools” (UHI). For instance, 145 UHI are identified, 13 of which utilize a comparable spatial scale to the NHCS. The authors refer to that scale as “less than neighborhood level” (Pineo et al., 2018). According to this five-class taxonomy, the NHCS is (i) at the less than neighborhood spatial scale, (ii) used for local benchmarking and research, (iii) on the topic of Health and Wellness, (iv) with a broad scope incorporating the environment, health, and economic data, (v) existing in a digital format.
After reviewing the survey instruments, the authors identify two implied but unaddressed issues in the academic literature. The first issue is one of missed opportunity: a focus on the development and validation of tools rather than on the way these tools are used in public policy and decision-making. More resources go into the development of a housing conditions survey than into the translation of survey findings into policy. In the measurement of the efficacy of the tool (cost, coverage, availability, validity, and accuracy), translation into policy is seldom considered. This is a lost opportunity to consolidate the continuum of ends and means. The second issue follows from the number and diversity of tools available: there is no consensus on how and what to measure in the urban environment; “[d]espite the large number of tools already available, researchers continue to contribute new international indicator sets while implicitly supporting standardization” (Pineo et al., 2018, p. 614). These issues point to gaps in the state of scientific knowledge and additional areas for research.
In understanding the literature on housing conditions surveys, it is helpful to remember that an article about a survey instrument is typically first in a sequence of papers generated by a health research agenda. For instance, the paper “Validity of an Ecometric Neighborhood Physical Disorder Measure Constructed by Virtual Street Audit” (Mooney et al., 2014) introduced a new surveying technique. The survey instrument introduced in this paper was followed by several methodology papers interrogating and expanding the technique (Bader et al., 2015; Mooney, Bader, et al., 2017; Quinn et al., 2016; Rundle et al., 2022), and several papers applying the technique connecting public health issues with the built environment (Joshi et al., 2017; Mooney et al., 2016; Mooney, Joshi et al., 2017). This pattern is not a problem in itself. Still, it does illustrate how the incentives for new publications as part of a burgeoning research agenda support the proliferation of survey techniques.
The pattern of survey proliferation is particularly notable in this case because the research agenda beginning with “Validity of an Ecometric …” fits in with the best practices in survey application literature and encourages survey convergence. The Bader et al. article fits into this literature by incorporating as much geographic variation as possible, as many questions as possible, and a data-gathering technique that is as consistent as possible. The Bader article uses Google Street View to rate a random sample of 300 census tracts from metropolitan areas across the USA. Their rating instrument was designed to incorporate as many different existing survey elements as possible, including elements of the Irvine-Minnesota Inventory, the pedestrian Environment Data Scan, the Maryland Inventory of Design Qualities as well as aspects of the Project on Human Development in Chicago Neighborhoods and the New York Housing and Vacancy Survey (Bader et al., 2015, p. 168). One hundred eighty-seven survey items from 300 dispersed census tracts gathered from photographs led to the Rundle et al. (2022) review of various machine learning approaches to “Urban Health Informatics.” An algorithm is trained to perform the visual assessment automatically, and in the second stage, regression techniques are used to data mine the results (Random forest, LASSO, etc.). Promising as this attempt at survey convergence may seem, this research agenda may be a dead end. Data collection through Google Street View violates the terms of service stated on the website (Google, n.d.), a significant strike against the generalizability of the underlying methodology.
This section has conceptualized rather than descriptively contextualized the NHCS among civic and academic survey instruments. The NHCS stands closer to the civic applications of housing conditions surveys. The expertise embodied in the CEI staff from implementing the survey was added to the NNIP joint stock of knowledge, flowing from there indirectly to the academic literature. Rather than generating the typical publication pattern of an academic research agenda, the NHCS generated years of fugitive literature in the form of summary reports on housing conditions. The NHCS has been used in several scholarly publications, but these occurred before the survey technique was separately introduced into the academic literature (Kennedy, 2011; B. Wilson et al., 2019; N. J. Wilson et al., 2023). The following section contains descriptive information by which the NHCS can be further understood (history of the survey, how it is carried out, how much information is gathered about each parcel, how many parcels were surveyed, who carried out the survey, and for what ends, what are the mechanics of the survey, cost of implementation).
Development of CEI’s Neighborhood Housing Conditions Survey
The NHCS was initially developed to measure housing stock and residential infrastructure to aid community development through community asset mapping. CEI’s role in the initial development of the NHCS was funded by a HUD Community Outreach Partnership Center grant at the University of Missouri Kansas City (COPC-MO-97-091). Ed Linnebur of the Kansas City Neighborhood Alliance (KCNA)—a local Community Development Corporation (CDC) operating under a regional charter—had designed the initial survey in collaboration with David Park, who was, at that time, Director of the City of KCMO’s Department of Neighborhood and Community Services. Designed to focus on identifying property maintenance code violations, the initial project was called the Neighborhood Codes Academy. Mr. Linnebur trained neighborhood volunteers to conduct the survey in roughly 120 faceblocks of KCMO’s 49/63 Neighborhood Coalition. CEI staff worked with Mr. Linnebur to coordinate data collection with results mapping using GIS desktop computer applications on the city’s digital parcel geography. The success of this pilot project established the basis for a long ongoing collaboration between CEI and KCNA on further implementation of the NHCS that lasted until KCNA finally closed its doors in 2006, after which CEI continued the NHCS on its own.
Shortly after the completion of the 49/63 pilot, CEI and KCNA were awarded a contract by the City of KCMO for the survey of ∼ 85,000 residential parcels (constituting 100% of ∼ 60 urban core neighborhoods), financed with Community Development Block Group funding (Bowles, 2000). That survey was initially conducted by students recruited from the UMKC Urban Affairs program (subsequent implementations have used paid surveyors). The pilot survey was completed in the spring of 2002, and results are reported in the Final Report for the City of Kansas City, Missouri (Contract No. 1999-32). In 2001, before the KCMO survey was completed in 2002, CEI and KCNA were awarded another major contract by the City of Kansas City, Kansas, to survey approximately 35,000 residential parcels contiguous with the KCMO urban core, conferring on the NHCS a bona fide regional character. The KCKs survey was completed in 2002, and the final report was issued on March 31, 2023 (Eaton, 2003).
The early reporting about the survey articulates a clear vision for the NHCS, “It is a powerful planning tool and it establishes a baseline that can be used to evaluate the effectiveness of housing policy” (Eaton et al., n.d., italics original). Early economic reports list eight distinct development agendas in Kansas City before suggesting that the NHCS can be used to evaluate these agendas on a consistent basis (Bowles, 2000).
The discussion of indicators and benchmarking in the NNIP guidebook, “Building and Operating Neighborhood Indicators Systems,” frames the significance of the NHCS. An emphasis of the NHCS is on developing benchmarks, or “a reference point or criterion against which to judge one’s performance,” that exist at the finest level of detail that is cost-effective to produce in terms of labor time and money (Kingsly, 1999, p. 18). Benchmarking is a part of different kinds of civic work, from directing public infrastructure spending to directing private investment, from characterizing physical neighborhood conditions to supporting research into the nexus of health and the built environment. These systematic housing condition surveys became the basis of an archive of neighborhood-level indicators and a core piece of a data-driven neighborhood development model (Bowles & Eaton, 2010).
Overview of Previous Surveys
Beginning in 2000 and continuing through the present day, the CEI has carried out 23 separate housing conditions surveys in the Kansas City metropolitan area. Table 1 describes the NHCS by program, year, survey date, and number of parcels surveyed. Several surveys took place over several years. In some years, multiple surveys took place. Some surveys were quite large, while others were relatively small. The first KCMO housing conditions survey looked at 82,081 parcels, while the Sugar Creek survey looked at only 1,790. In the 23 years of the survey, 262,016 parcels received ratings.
NHCS Overview—Programs, Years, Dates, # Surveyed.

Note. The total number of parcels surveyed includes 3,499 parcels with no associated housing conditions observations.
The NHCS has been carried out on both sides of the state line in metropolitan Kansas City. Federal CDBG program funds, municipal budgets, and regional nonprofits with an agenda for data-driven community development have funded it. The data gathered in the KCMO housing survey was used as pilot data to develop the city’s strategic housing plan and to guide its infrastructure investment (programs 3 and 18). Over its lifetime, it has been used extensively by neighborhood associations and non-profit community development organizations to inform and evaluate their programmatic efforts. It was the backbone of CEI’s online neighborhood indicators program for almost 20 years.
The method for determining which parcels were to be surveyed has changed from program to program. All programs focused on residential parcels; some gathered data about commercial properties (programs 18 and 29). Some programs only looked at individual neighborhoods (programs 12–16, 22, 24, 25), while others looked at multiple neighborhoods while focusing on those expected to have a preponderance of substandard conditions (programs 26, 27). One program focused on Kansas City looked at a random sample of parcels from the city (program 30), another program looked at all the houses within randomly drawn circles of 1-mile diameter scattered across the metro area (program 18), yet another held the task of establishing baseline conditions for a federal Urban Green Impact study (program 29).
Figure 1 illustrates the patchwork effect created by the 23 NHCS programs, each of a different size and scope. A few neighborhoods (e.g., the East Side and Historic North East neighborhoods) were rated several times, while most neighborhoods and incorporated places (e.g., Edwardsville, Riverside, Liberty, Lees Summit) received little or no survey attention. The observed variability by year and geography is attributed to funding and motivations changing from program to program. Despite those shortcomings, the duration and scale of the NHCS make it a useful resource for studying the built environment in the Kansas City Metropolitan Area.
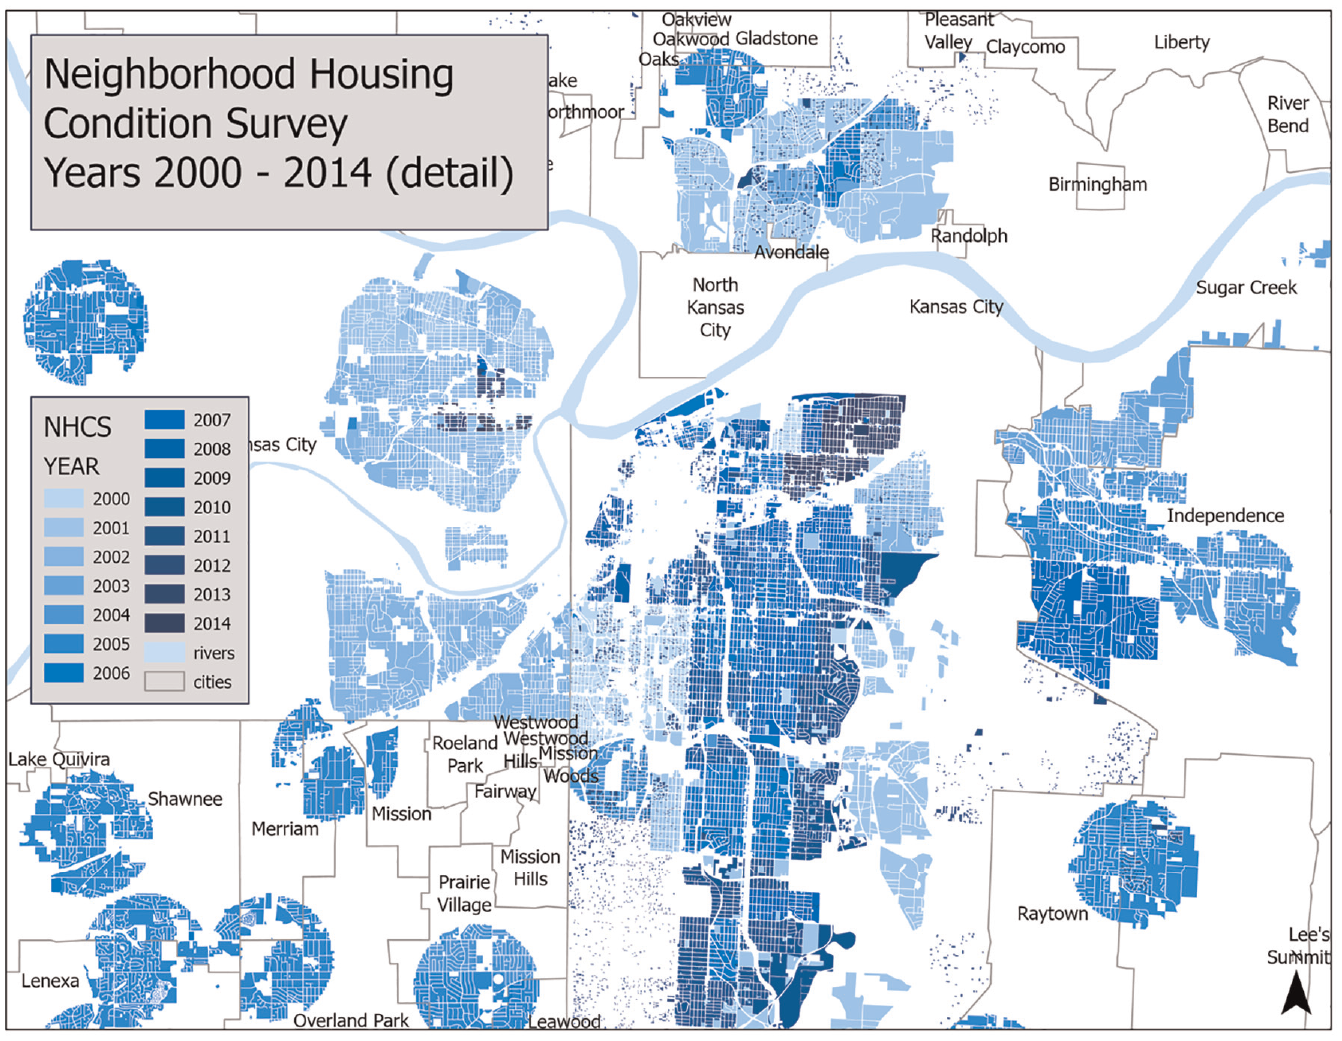
Map of NHCS geography (reproduced with minor alterations from N. Wilson, 2021; N. J. Wilson et al., 2023).
The survey is flexible across two analytical dimensions: geography and application. Considered as a whole, the NHCS is an extensive collection of observations (nearly 5 million data points) at the parcel level. This level of geographic resolution and the volume of observations make the housing conditions survey ideal for use in retrospective public health investigations—though this is not the use for which the survey was designed (Kennedy, 2011). For example, many observational analyses are performed at an aggregative geographic level, such as census tracts. A more refined geography is preferable for health reserach (Kaplowitz et al., 2010; Manson et al., 2009). It is possible to aggregate parcel-level observations so that health analyses can be performed at a personal level and aggregated up to a higher level such that the anonymity of the participants is not compromised.
The NHCS comprises observations of residential and non-residential parcels, with and without a structure. An aspect of the NHCS that makes it useful for applications such as health research is that it gathers objective structural classification as well as conditions of the structures themselves. Structural classification data include precise street address, structure type (including no structure), use type, structure profile, and whether a visible address is associated with any structures on the property. Some programs gathered auxiliary information about the parcels, such as whether it was a rental property, the city and county parcel ID, and whether the owner of the parcel lives at the address. This auxiliary information is listed in Supplemental Material SM2.
The NHCS is designed to provide up-to-date administrative knowledge about the parcels themselves, descriptive content regarding parcel content and architecture, and ordinal rankings for housing conditions. Updating parcel-level knowledge involves comparing the content of maps made from administrative GIS layers with observations in the world. In practice, this means splitting individual parcels into multiple parcels, combining multiple parcels into single parcels, and updating the parcel’s visible address whenever it differs from official records. Administrative maps provided to the survey team can be outdated, and the NHCS is designed to account for such instances.
The descriptive information gathered by the survey is grouped into four categories: structure type, use type, residential type, and structure profile. These categories generate a parcel-level inventory of the presence, use, and architectural characteristics of the buildings in the area subject to the NHCS. This architectural information is finer-grained than what is available in zoning maps and liberates some of what is in proprietary real estate listings.
The ordinal rankings of housing conditions are the main content of the NHCS. The conditions are grouped into three general categories: structure, grounds, and infrastructure. There are five housing conditions grouped under each of the three categories. The five conditions in the structure category are roof, foundations and walls, windows and doors, porch, and exterior paint. The five conditions in the grounds category are private walks & drives, lawn, vehicles, litter, and open storage. The five conditions under the infrastructure umbrella are public walks, curbs, streetlights, catch basins, and street conditions.
Each housing condition (roof, foundation and walls, windows and doors, porches, and exterior paint) is rated using an ordinal five-level ranking. A score of 1 is the lowest, and 5 is the highest. A score of 6 indicates that the condition does not apply to the parcel in question, implying either the lack of a structure or the absence of that particular facet of housing (e.g., a home without a porch would receive a rating of 6, as would a vacant lot). Thus, the percentages of parcels with six ratings reported in Table 2 vary slightly from roof to the other conditions. The roof rating contains an additional score, 7, which indicates either a flat roof or an obstructed view of the roof. Ratings of 4 and 5 indicate conditions with good and excellent ratings, respectively. There is more variation in the rating system among substandard or worse conditions. Across all conditions, a score of 3 or less indicates a substandard housing condition, while scores of 1 and 2 indicate severely deteriorated and seriously deteriorated conditions. A rating of substandard or worse suggests a condition that would violate Kansas City, MO, housing codes.
Percentage of Housing Conditions Receiving Each Rating.

When summarizing the results of all 23 NHCS programs by housing conditions rating, it is important to be circumspect. Much of the metropolitan area has been surveyed more than once, and several parts have been surveyed many times, yet much of the metro area has never been surveyed. The percentages reported in Table 2 refer only to the housing conditions survey in total; we do not expect the housing conditions in various neighborhoods to reflect the percentages reported. Still, general trends in housing conditions are apparent. About 16% of the parcels surveyed are vacant lots, and 2.75% of the roofs were un-ratable for one reason or another. Roof ratings also diverge from the rest of the conditions because they do not contain a preponderance of excellent ratings. Foundation and Walls conditions have the highest percentage of good and excellent ratings and the lowest percentage of ratings substandard or below. All housing conditions exhibit a narrow range (30%–34%) of good ratings. Critically, the substandard or worse rating percentage is less than 35% of the total number of surveyed parcels. The outlier again is roof condition with no other conditions within 8% of its figure. The percentage of deteriorated parcels is uniformly less than 6%, with exterior paint exhibiting the largest percentage of severely deteriorated ratings.
When interpreting these statistics and using the housing conditions ratings in more complicated statistical applications, remember that the NHCS is an ordinal rating system. Higher ratings always indicate superior conditions; a condition rated at 4 is of superior quality to a 3, 2, or 1. However, the relative magnitudes of the distance between ratings are not consistent across the scale. The change in observed quality between a condition with ratings 2 and 3 is not equivalent to the change in that same condition between 3 and 4. Similarly, the magnitude of change in one condition between two ratings is not equal to the magnitude of change between two ratings of a different condition. The only consistency between ratings is that a rating of 3 or lower may correspond to a housing code violation.
The NHCS is not a code enforcement tool; surveyors do not report parcels in violation to municipal authorities. However, the NHCS is indexed to municipal building codes. In this way, the NHCS provides more information than a dichotomous code violation while maintaining the possibility that it could be collapsed into such a system and combined with similarly structured rating systems.
Training and Quality Control
The NHCS includes comprehensive training and quality control procedures. As mentioned, the survey was designed for a rating of 3 or lower to suggest a housing condition violating local building codes; this design feature connects the internal ordinal rating system to the independent judgment of code enforcement and the associated legal establishment. To ensure the ratings are consistent from program to program and researcher to researcher, everyone administering a field survey must complete a three-part classroom-and-field training regimen. The instructor needs to understand the survey instrument and its application in the real world.
Training through in-class and field instruction is consistent with best practices discussed in the published literature (Caughy et al., 2001; Teixeira & Wallace, 2013). For the first several years of NHCS implementation, our KCNA partner trained new instructors. After KCNA closed its doors, senior CEI staff took over that role. The classroom session focuses on learning the rating guide (see Supplemental Material SM2). After the classroom session, there is an in-field instructional session where the rating guide is demonstrated with examples from the neighborhood. These two sessions are approximately 3 to 4 hr each. The field examination is focused on two certification blocks, approximately 70 parcels. To pass their field examinations, potential raters must return ratings with scores with an absolute mean difference of less than one compared with the scores established by the trainers. If potential surveyors fail their field exam, they return to the classroom for additional instruction. Similarly, a brush-up course is required after 3 months in the field to prevent a drift in ratings during long survey operations. After one has gone through the training, certification, and survey process, she is qualified to instruct others in the survey.
There are a few steps required before training can begin. The team will need access to REDCap (the current version of the NHCS runs on this software) and tablet computers to fill out the survey questionnaire (Supplemental Material SM3 contains the current version of the REDCap survey). The team will need a GIS layer corresponding to the certification area’s parcel geography and another GIS layer of the area intended to be surveyed (Typically, this layer originates as and is obtained from a municipal digital land cadaster). The software should be pre-loaded with block and parcel level identification variables; these will save the surveyors the time of entering the address and other identification information while in the field. The survey trainers should have the certification blocks chosen and the ratings established before the training begins.
After certification, surveyors go into the field to record their observations. In addition to their tablets to perform the survey, the rating team brings a high-resolution map of the surveyed neighborhood to orient themselves and to mark up with notes about the urban landscape. Surveyors also use a tracking sheet to organize notes about differences between the GIS parcel layer and observed neighborhood conditions.
There is a structured process of generating certified datasets after the field surveys have been completed. First, the comments on the paper map and tracking sheet are examined line by line and used to update the GIS parcel map. This routinely involves splitting and merging parcels in GIS to reflect the built environment. Second, the tracking sheet is reviewed for ambiguities not accounted for in the survey questions. In the third step, the REDCap data is joined to the administrative parcel layer in GIS. After this join process, the survey observations are ready to be visualized. Typically, “structure type” is used to test for survey completeness. All survey fields are visualized and examined for inconsistencies. A comprehensive list of inconsistencies is created, and the survey team is sent back into the field to resolve these issues. These “mop-up” observations are merged with the GIS data. Now, the survey results are certified and ready for use.
There are two critical points about NHCS “certified” data sets. First, the parcel geography originates from a legal land survey and property ownership land cadaster record. After it is modified in the NHCS process, the parcel geography no longer possesses that precise and legal character. It may reflect numerous inexact field observations unverified in property ownership records. Second, the modified parcel geography and the collected survey data (for any given area, neighborhood, etc.) constitute a “matched set.” The survey data can only be adequately attached to, mapped, and spatially analyzed using the modified parcel geography generated in the survey process.
Implementation History
The neighborhood housing conditions survey has undergone several iterations in its two decades of use. The survey currently exists as a REDCap survey; REDCap is a secure and proprietary web-based platform for building and managing surveys and databases. The NHCS began as a paper survey that was scanned into a database after the fieldwork and before the GIS work. By 2006, the NHCS had migrated to a tablet computer interface, eliminating the possibility of transposition error and accelerating data entry. After the original KCMO and KCK surveys, the first digital implementation of the NHCS was via Personal Desktop Assistant (PDA). Survey datasets were downloaded to PDA, taken into the field for data collection, and collected data was then uploaded to a Microsoft Access database where error correction and consolidation occurred. An Excel spreadsheet was then exported as the certified dataset. Beginning with the completion of the first KCMO survey in 2001, NHCS results were uniformly published online by CEI’s CityScope internet map server and neighborhood indicators service. Version 2.1 of CityScope was decommissioned in 2020 during the long COVID pause and has not since been restored.
The original 2000 to 2001 KCMO housing condition survey cost approximately $350,000 for a survey of 82,081 parcels (∼$4.25 per parcel). In 2014, the cost of an additional survey of 2,559 parcels was estimated at approximately $20,000, about $7.50 per parcel. Smaller surveys are more expensive on a per-parcel basis than more extensive surveys. Larger surveys benefit from economies of scale and are more economical than smaller surveys because they are subject to the same fixed costs. These costs include the University overhead for facilities and administration and the cost of training and certification born by the CEI alone. Logically, the most extensive NHCS program benefited the most from economies of scale, and this was also the survey carried out on paper and transcribed. This means that it is difficult to see the cost-saving benefit from the digitization of the survey in the retrospective per parcel cost of implementation.
Discussion
The CEI’s NHCS stands astride from prior academic and civic housing surveys on several fronts. The flexibility of the NHCS in terms of what it has been used for—benchmarking, public policy, community development, and health research—is unique among the survey literature we have reviewed. The depth of information gathered—ratings of 15 five-level housing conditions and an additional 10 classes of observations at the parcel level—is unique among the survey literature we reviewed, particularly regarding how many years the NHCS has been used.
Some aspects of the NHCS as a dataset will benefit from directed investigation. For instance, we need to find out the pace at which housing quality changes. Our 20 years of observational data have captured gentrification and neighborhoods in decay. Observing how housing conditions spread in terms of improvement and deterioration may be possible. There is no reason to expect these changes to be consistent across housing types and among neighborhoods with significant differences (in terms of age of housing stock, population demographics, population density, etc). Such research would be a welcome addition to longitudinal research into neighborhood change.
There are some issues with housing conditions surveys that should be considered. As a “windshield” survey, visibility limitations (vegetation, inaccessible streets, flat roofs) impact the survey’s completeness. Parcel-level observations are atomizing by their nature. As an investigative tool, observational metric parcel level observations may be warranted; however, a gestalt aspect of neighborhood-ness exists beyond the parcel level. This is one tool among many and should not be thought of as making systematic thinking irrelevant or unnecessary. A neighborhood does not emerge from a simple summing up of its houses, and houses don’t exist only at the parcel level (crucial aspects of infrastructure like electrical and water services are networked). The NHCS is only as valuable as the ends to which it is put.
There is an implicit acceptance of the legal framework that structures the NHCS rating system in terms of local building codes. The survey is indexed to Kansas City code enforcement, and this may not be appropriate if we are to study housing expansively. For instance, some living situations—encampments of the unhoused—are part of the built environment but do not translate well into the NHCS rating schema. Conversely, the five-level ordinal scoring is superior to a dichotomous pass-fail building code indicator. The NHCS schema facilitates the investigation of associations between health and the built environment with refined precision at the upper and lower ends of the rating spectrum.
The NHCS can play a role as an “off-the-shelf” product in community needs health assessments and housing-based climate change mitigation assessments. It is standard for community-engaged research to generate information about gaps and opportunities via interviews and focus groups, 2023); carrying out an NHCS will add comprehensive and systematic information about physical housing conditions. For instance, the NHCS will identify severely deteriorated roofs—a deteriorated roof being logically connected to moisture, mold, and health outcomes like asthma. The NHCS similarly applies to the nexus of housing and climate issues; homes in poor repair are likely also to need energy efficiency improvements. Home weatherization is associated with a lower carbon footprint and monetary and healthy benefits for residents (Tonn et al., 2023). Through NHCS-informed methods, outreach time and money can be focused on those homes that pose the most significant risk to their occupants.
The method of survey implementation is related to the ideals of data-driven organizing. Implementation via the windshield survey, remote viewing, or Google Maps separates the survey team from the surveyed neighborhood. Recall that one of the motivating logics of DDO is that the process of gathering information about the neighborhood organizes the constituents toward the project’s overall goals. Survey methods that operate at a remove from the neighborhood may impair this aspect of DDO. Addressing this question is a suitable research topic: does the survey implementation technique affect the implementation of overarching project goals? This question fits well within a larger research agenda that seeks to connect housing condition surveys to their use in policy implementation. Answers to these questions about implementation and the connection between survey instruments and the policies they are used for may be contained in the back catalog of NNIP housing conditions surveys. The totality of the NNIP housing conditions surveys represents a large, diverse dataset that is national in scope; the systematic examination of these NNIP surveys as a group may yield insight into these questions of how the surveys themselves are used in policy implementation and the up-stream questions that seek to connect survey implementation with the down-stream policy goals.
Finally, given the odious uses to which the legibility of housing conditions has been used in the 20th century—of which redlining is the most notorious (Gotham, 2014; Rothstein, 2017)—it is important the NHCS and similar surveys are not used as a tool of discrimination and displacement.
Conclusion
Work remains to be done; we still need to finish interrogating the information in the collected NHCS data. For instance, rate of change analysis could be accomplished by selecting only parcels rated in more than one program. Comprehensive correlation analysis between the several housing, grounds, and infrastructure ratings should be performed for the individual homes within various geographies and temporalities. Local incidence of spatial autocorrelation can be performed to discover patterns in the housing, grounds, and infrastructure ratings between parcels.
An algorithm can be devised to associate the parcel-level observations of the early years of the NHCS with the more recent block-level NHCS. The “eyeball” nature of the housing conditions survey implies automating future surveys through remote sensing observations and artificial intelligence ratings may be possible. However, questions remain about whether the correct direction for housing surveys is towards their automation or something more in keeping with DDO.
There are several advantages to the NHCS as designed and implemented. The parcel-level observations of housing, grounds, and infrastructure conditions are at a usefully precise geographic level, resolving significant issues around the modifiable aerial unit problem (B. Wilson et al., 2019). The process of actively looking at the city can create a feedback loop that allows researchers to find, in essence, what they did not set out to look for. Surveying every parcel in a specified geography will enable researchers to update municipal records. These updates are relevant to vacant parcels and postal addresses but need to be more relevant to updating records of vacant structures. The NHCS, as it has been carried out, is a labor-intensive operation. However, this can be understood as an advantage to the degree to which it produces detailed, helpful information that is otherwise unavailable. Surveying the entire metropolitan area regularly could be the basis of a “shovel-ready jobs program” while the survey results could feed into targeted employment programs.
One shortcoming of this paper is that we need to compare NHCS results directly with those of another survey method. It will be helpful to compare observations produced by the NHCS with those produced by one of the methods discussed in the systematic review produced by Pineo et al. (2020). The patchwork nature of the NHCS’s history is also a shortcoming. The ability of the NHCS to evaluate civic interventions (such as a change in zoning or blight designations) is limited by the intermittent timing of the surveys and the unsystematic scope of the areas surveyed. The intermittent timing of surveys presents a challenge to understanding how housing conditions change over time. The unsystematic scope of the survey means that some neighborhoods are surveyed repeatedly while others are only surveyed once, which presents a challenge to understanding housing conditions comprehensively.
Additional implementations of the NHCS with implications for future research are underway. We are exploring the potential for the NHCS to be the basis for an exterior housing-based pediatric lead risk index (N. J. Wilson et al. 2023). The development of similar indices for other pediatric illnesses, such as asthma, broken bones, contusions, and poisonings, is in the planning phase. Another future line of inquiry is quantifying relationships between internal and exterior housing conditions. Assessment of interior housing conditions is invasive and time-intensive. To the extent exterior housing assessment can serve as a proxy for interior assessment, the potential exists for considerable savings in money and time and directed health outreach based on the visual. With another comprehensive NHCS implementation, we will have a quarter century of detailed information about housing conditions in Kansas City. We can then use the benchmarking capabilities of the survey to evaluate in objective material terms the impact of all urban development in the city that has taken place since 2000.
Parcel-level GIS is attainable for every city in the United States. It is used to direct funds for public infrastructure where they are most needed, to further the understanding of the nexus of housing and health, and to capitalize on the current state of knowledge about housing and health for directed investment. The accumulation of longitudinal housing conditions will aid each of these agendas. Conversely, there is value in finding unexpected connections that are not an explicit aspect of research design. This is a vote against the lean, just-for-purpose surveys.
Work needs to be done to consolidate survey instruments such that observations of housing conditions are consistent across space and time. There is value in the ability to synthesize housing condition observations across unconnected research aims and civic applications. There should be an “off the shelf” survey available for civic and academic use and a clearing house for modifications and extensions of common survey designs such that surveys can be both fit for purpose and connected across agenda. The NHCS, in its comprehensive design and extensive history, is a good candidate for consideration towards such an end.
Supplemental Material
sj-pdf-1-sgo-10.1177_21582440241257674 – Supplemental material for A Parcel Level Housing Conditions Survey in Academic and Civil Context
Supplemental material, sj-pdf-1-sgo-10.1177_21582440241257674 for A Parcel Level Housing Conditions Survey in Academic and Civil Context by Neal J. Wilson and Douglas Bowles in SAGE Open
Footnotes
Acknowledgements
The authors would like to thank Brian Matlock for research assistance and the various survey teams who did the work of implementing the Neighborhood Housing Conditions Survey in the field. The authors are solely responsible for the accuracy of the statements and interpretations contained in this publication. Such interpretations do not necessarily reflect the views of HUD.
Declaration of Conflicting Interests
The author(s) declared no potential conflicts of interest with respect to the research, authorship, and/or publication of this article.
Funding
The author(s) disclosed receipt of the following financial support for the research, authorship, and/or publication of this article: Funding to write this paper was provided through the U.S. Department of Housing and Urban Development year 2020 Lead and Healthy Homes Technical Studies (LHHTS) Grant Program (FR-6400-N-15).
Ethical Approval
An Ethics Statement is not applicable to this paper.
Data Availability Statement
Data sharing not applicable to this article as no datasets were generated or analyzed during the current study.
Supplemental Material
Supplemental material for this article is available online.
References
Supplementary Material
Please find the following supplemental material available below.
For Open Access articles published under a Creative Commons License, all supplemental material carries the same license as the article it is associated with.
For non-Open Access articles published, all supplemental material carries a non-exclusive license, and permission requests for re-use of supplemental material or any part of supplemental material shall be sent directly to the copyright owner as specified in the copyright notice associated with the article.