
Abstract
South African undergraduate university students face many unique challenges that put them at risk of developing mental health concerns such as depression, anxiety, stress, suicidal ideation, and posttraumatic stress disorder. However, psychological well-being has been found to play an essential role when it comes to effectively coping with and adjusting to university life. This study aimed to identify the predictor variable(s) or combination(s) of predictor variables that explained a significant percentage of the variance in psychological well-being amongst undergraduate university students. A total of 1,191 students between the ages of 18 and 30 participated in the study. This was a non-experimental study using a cross-sectional correlational research design. The results from the hierarchical regression analyses indicated that adjustment to university life statistically and practically significantly contributed to the explanation of the variance of the following dimensions of psychological well-being: Positive Relations, Self-acceptance, and Purpose in Life. These findings suggest that interventions that target adjustment could be used to improve the psychological well-being of undergraduate university students.
Keywords
Background
South Africa is known for its rich cultural diversity and racial history (Braathen et al., 2013; Das-Munshi et al., 2016; Ramdass, 2009), and despite the ending of Apartheid over 25 years ago, various racial and material inequalities remain present (Beaubien, 2018; Braathen et al., 2013; Das-Munshi et al., 2016; Pillay, 2021; Ramdass, 2009). South Africa faces many socio-political issues (e.g., high levels of violence, crime, and unemployment) (Banda Chitsamatanga & Malinga, 2021; Braathen et al., 2013; Das-Munshi et al., 2016; Pillay, 2021; Ramdass, 2009) and South African university students face many unique challenges, such as unequal access to resources and political unrest (Chetty & Pather, 2015; Du Plessis, 2021; Edwards et al., 2004; LaBrie et al., 2012; Makgahlela et al., 2021). Students are now faced with greater academic demands than ever before and a greater sense of responsibility (Banda Chitsamatanga & Malinga, 2021; Credé & Niehorster, 2012; Makgahlela et al., 2021; Stoklosa, 2015; van Breda, 2017). They also face adjusting to a new social environment and taking on new roles and responsibilities, such as managing their time and finances (Credé & Niehorster, 2012; Stoklosa, 2015). Many university students also face separation from their friends and family due to moving to another city for tertiary education purposes (Credé & Niehorster, 2012; Stoklosa, 2015). International research identified various stressors faced by university students, such as personal inadequacy, fear of failure, interpersonal difficulties with lecturers, poor time management, peer competition, financial burdens, inadequate study facilities, and managing their personal and academic life (Chernomas et al., 2023; Jayasankara Reddy et al., 2018; Ramachandiran & Dhanapal, 2018; Sreeramareddy et al., 2007). These challenges put university students at risk of developing mental health concerns such as depression, anxiety, stress, suicidal ideation, sleeping problems, and posttraumatic stress disorder (PTSD) as they often do not have the coping skills needed to deal with these challenges (J. Bantjes et al., 2019; Olasupo et al., 2018; Ramachandiran & Dhanapal, 2018; van Breda, 2017). These challenges and further mental health concerns can result in poor academic performance, increased dropout rates, and reduced graduation rates (Essop, 2020; Mokgele & Rothmann, 2014; Pather & Dorasamy, 2018). In South Africa, the first-year university dropout rate is 40% to 55%, with only 20.3% of university students reaching graduation (Essop, 2020; Mokgele & Rothmann, 2014) compared to for example 61% of students in the United States (Hussar et al., 2020). Compared to other countries within Africa, Ghana has a 50% drop out rate while Nigeria has a 33% drop out rate (Ankeli, 2023; PASGR, 2019). In South Africa, university students’ psychological well-being (PWB) is significantly lower than university students in the United States (Edwards et al., 2004). This may be attributed to the various socio-cultural and political factors faced in South Africa (Banda Chitsamatanga & Malinga, 2021; Braathen et al., 2013; Das-Munshi et al., 2016; Edwards et al., 2004; Pillay, 2021). University students in low to middle income countries are more likely to be exposed to trauma and crime and less likely to access affordable mental health care. Between 2016 and 2019, depression rates in South African university students increased yearly (Rousseau et al., 2021; Twenge, 2019). Approximately 33.2% of South African university students experience mild to moderate symptoms of depression, while 15.8% of students experience mild to moderate symptoms of anxiety (J. R. Bantjes et al., 2016; Makhubela, 2021). Not only does this highlight problems in the higher education system, but it also raises concerns about the competency of the South African labor market (Cilliers & Flotman, 2016).
However, studies have found that increased levels of PWB in university students tend to lead to lower rates of depression, anxiety, and stress, resulting in better academic performance, goal attainment, mindfulness, physical health, resilience, and coping strategies (Chow et al., 2018; Das-Munshi et al., 2016; Freire et al., 2016; Harding et al., 2019; Olasupo et al., 2018; Ramdass, 2009; Siddiqui, 2015; Smith & Yang, 2017; Turashvili & Japaridze, 2012; Udhayakumar & Illango, 2018). This research highlights the importance of researching PWB among university students and indicates how PWB can increase university students’ quality of life, subsequently lowering the dropout rate (J. Bantjes et al., 2019; Freire et al., 2016; Olasupo et al., 2018).
PWB has been conceptualized in two different ways, namely hedonic and eudaimonic well-being (Dodge et al., 2012; Ryan & Deci, 2001; Vázquez et al., 2009). The hedonic conceptualization views well-being as the pursuit of happiness and pleasure (Bhullar et al., 2013; Dodge et al., 2012; Keyes et al., 2008; I. P. Khumalo et al., 2012; I. Khumalo et al., 2013; Ryan & Deci, 2001; Ryff, 2014; Vázquez et al., 2009; Wissing et al., 2011; Wissing & van Eeden, 2002). However, not all researchers agreed with this conceptualization of well-being and argued that happiness is not the main criterion of well-being (Bhullar et al., 2013; Dodge et al., 2012; Ryan & Deci, 2001; Vázquez et al., 2009). Eudaimonic theorists argued that not all human desires that are pleasure producing are beneficial for individuals and do not promote wellness (Dodge et al., 2012; Ryan & Deci, 2001; Vázquez et al., 2009). This research study used the eudaimonic conceptualization of well-being. Eudaimonic psychological well-being is described as self-actualization or striving to one’s full potential (Dodge et al., 2012; Ryan & Deci, 2001; Vázquez et al., 2009). Ryff elaborated on this argument to describe well-being as “striving for perfection that represents the realization of one’s true potential” (Ryff & Keyes, 1995, p. 100). For Ryff, PWB encompasses an individual’s positive functioning, dividing PWB into six core dimensions, namely (i) autonomy, (ii) environmental mastery, (iii) personal growth, (iv) positive relations with others, (v) purpose in life, and (vi) self-acceptance (Ryff, 1989, 2014; Ryff & Keyes, 1995; Ryff & Singer, 2008). Within these dimensions, Autonomy refers to one’s ability and desire for independence as well as an internal locus of control (Gustems-Carnicer et al., 2019; Opree et al., 2018). Environmental Mastery refers to one’s ability to manage and control one’s environment to suit one’s needs (Gustems-Carnicer et al., 2019; Opree et al., 2018). Personal Growth refers to one’s need for continued personal development or self-actualization (Gustems-Carnicer et al., 2019; Opree et al., 2018). Positive Relations refers to one’s ability to establish deep and satisfying relationships with others (Gustems-Carnicer et al., 2019; Opree et al., 2018). Purpose in Life refers to one’s sense of direction and goals in life (Gustems-Carnicer et al., 2019; Opree et al., 2018). Lastly, Self-acceptance refers to positive attitudes toward oneself (Gustems-Carnicer et al., 2019; Opree et al., 2018). Based on eudaimonic well-being, PWB can be defined as an ongoing state of optimal functioning characterized by high levels of Autonomy, Environmental Mastery, Personal Growth, Positive Relations with Others, Purpose in Life and Self-acceptance (Joshanloo, 2016; Ryff, 1989, 2014, 2017). The Scales of Psychological Wellbeing (SPWB) developed by Ryff in order to measure these six core dimensions (Henn et al., 2016; Ryff, 1989, 2014) remains a prominent measure of PWB in research and has reported multiple sources of evidence for the validity of the SPWB (Ryff, 2014).While there is debate over the structure of SPWB, using the components of SPWB rather than a global score provides a more detailed understanding of SPWB in students and allows us to target specific dimensions to provide more detailed support for university students (Blasco-Belled & Alsinet, 2022; Ryff, 2014).
Variables such as emotional intelligence, adjustment, media and technology usage, and gender can be studied as possible predictor variables of PWB. Studies done on South African university students show that higher levels of emotional intelligence tend to result in increased levels of PWB (Beckmann & Minnaert, 2018; Carmeli et al., 2009; Cronje, 2019; Lawal et al., 2018). Lack of adjustment to university has been shown to significantly predict anxiety, depression, and social dysfunction amongst South African undergraduate university students (Olasupo et al., 2018), with media and technology usage having adverse effects on the PWB of university students (Çardak, 2013; Twenge, 2019). Differences have been found between male and female university students in PWB; each sex scored higher on specific aspects of PWB (Chraif & Dumitru, 2015; Roothman et al., 2003).
PWB and Emotional Intelligence
Emotional intelligence is defined as the ability to accurately perceive, understand, utilize and manage emotions in oneself and others (Schutte et al., 2013). Emotional intelligence has been found to have a positive effect on PWB (Asad Ali Shah et al., 2018; Balluerka et al., 2016; Görgens-Ekermans et al., 2015; Lawal et al., 2018; Yusoff et al., 2013). Studies on university students have shown that higher levels of emotional intelligence tend to result in decreased levels of somatic complaints, depression, and anxiety, and improved PWB, success, self-esteem, and mental and physical health (Beckmann & Minnaert, 2018; Cronje, 2019; Lawal et al., 2018; Malinauskas & Malinauskiene, 2020; Moeller et al., 2020; Rehman & Sohail, 2018; Singh & Kaur, 2019). Further South African studies have shown that as emotional intelligence encompasses the ability to deal with negative moods, students with higher emotional intelligence are less likely to experience negative moods, and more likely to experience positive affect that is associated with higher levels of PWB (Görgens-Ekermans et al., 2015).
PWB and Adjustment
University students tend to face many challenges and their adjustment to university life is essential to their PWB, as positive adjustment tends to lead to increased levels of PWB (LaBrie et al., 2012; Olasupo et al., 2018). Adjustment refers to how well university students cope with university life (Feldt et al., 2011). University students who can adjust to university life are less inclined to experience anxiety, depression, and social dysfunction and more prone to experience increased levels of PWB (Olasupo et al., 2018). In addition, both South African and international studies found that successful adjustment is associated with better academic performance (Petersen et al., 2009; Wintre & Yaffe, 2000). It is important to note that COVID-19 is increasing adjustment problems amongst university students, but further research is still required to clarify its severity (Arslan et al., 2022).
PWB and Media and Technology Usage
Media and Technology usage encompasses using a wide range of technological equipment such as cell phones, televisions, and computers (Rosen et al., 2013). It also includes a range of activities that can be performed on this equipment, such as texting, watching TV, and utilizing social media (Rosen et al., 2013). Media and technology usage is very prevalent amongst university students (Çardak, 2013; Twenge, 2019), with up to 95% of university students currently utilizing media and technology, with social media being the primary media used (Anand et al., 2018; Mese & Aydin, 2019; Nagel et al., 2018). Some studies show that media and technology usage can have adverse effects on the PWB of university students (Çardak, 2013; Twenge, 2019). During the COVID-19 pandemic, many university students have had to complete their studies online, leading to increased media and technology usage, resulting in increased anxiety levels due to the spread of false information and the inability to connect in real-time life (Jiang, 2021). Other studies, however, show the opposite, emphasizing the potential uses of media and technology in measuring and intervening in well-being (Magsamen-Conrad et al., 2014; Yaden et al., 2018). Regardless, media and technology overuse amongst university students tends to lead to increased mental health concerns and lower levels of PWB in terms of diminished impulse control, loneliness, depression, anxiety, lower social comfort, and distraction (Anand et al., 2018; Becker et al., 2013; Çardak, 2013; Tangmunkongvorakul et al., 2019).
PWB and Gender
Differences have been found between men and women in terms of PWB, with each gender scoring higher on specific aspects of PWB and with women having an overall lower sense of PWB (Gómez-Baya et al., 2018). Statistically significant differences have been found on four of the dimensions of PWB between males and females (Chraif & Dumitru, 2015; Matud et al., 2019). Men score significantly higher in self-acceptance and autonomy, while women score higher on personal growth and positive relations with others (Chraif & Dumitru, 2015; Matud et al., 2019). Similar differences have also been found to occur between male and female university students (Chraif & Dumitru, 2015; Roothman et al., 2003). This could be attributed to societal stereotypes around gender roles. Men are encouraged to be more independent and self-reliant, leading to men having a higher sense of autonomy and self-acceptance (Maroof & Khan, 2016; Matud et al., 2019). In comparison, women are encouraged to build relationships and be social, leading to women having a higher sense of personal growth and positive relations with others (Matud et al., 2019).
Purpose of This Study
University students tend to fall into the developmental stage known as emerging adulthood, marked by identity exploration and a variation in pathways to adulthood (Arnett, 2000). This developmental stage encompasses those aged between 18 and 29 years and is distinctly different from adulthood (Arnett, 2000, 2006, 2007). However, this developmental stage is not universal and is culturally determined (Arnett, 2000). This stage consists of endless possibilities in which attending university is only one option. During this developmental stage, university students have left the dependency associated with adolescence, but they have not yet taken on all of the responsibilities related to adulthood (Arnett, 2000, 2006). Although university life presents students with many options and choices, it also raises many challenges for undergraduate students (Credé & Niehorster, 2012; Feldt et al., 2011; Olasupo et al., 2018; Stoklosa, 2015; van Breda, 2017). Some of the challenges that students face include greater academic demands and a greater sense of responsibility (Credé & Niehorster, 2012; Stoklosa, 2015; van Breda, 2017). They need to adjust to a new social environment and take on new roles and responsibilities (Credé & Niehorster, 2012; Stoklosa, 2015) while facing separation from their friends and family (Credé & Niehorster, 2012; Stoklosa, 2015). PWB can benefit university students’ academic, emotional, and mental well-being (Chow et al., 2018; Harding et al., 2019; Olasupo et al., 2018; Panahi et al., 2016; Smith & Yang, 2017; Turashvili & Japaridze, 2012). Therefore, identifying possible predictors of PWB and studying the PWB of university students can provide valuable information for intervention programs to improve the PWB of university students (Morales-Rodríguez et al., 2020).
Methodology
Research Aim and Questions
This research study aimed to determine which variable(s) or combination(s) of variables explain a significant percentage of the variance in PWB amongst undergraduate university students at the University of the Free State. In this study, PWB was the criterion (dependent) variable, while Adjustment, Emotional Intelligence, Media and Technology Usage, and Sex were the predictor (independent) variables. In order to address the research aim of the study, the following research questions were explored:
Does the combination of Media and Technology Usage, Adjustment, Emotional Intelligence, and Sex explain a significant percentage of variance in psychological well-being amongst undergraduate university students?
Do any of the individual variables significantly contribute to the variance in psychological well-being amongst undergraduate university students?
Research Design
The study was quantitative and non-experimental in nature and used a cross-sectional correlational research design (Stangor, 2015).
Participants and Sampling
A non-probability sampling technique, more specifically, convenience sampling (Stangor, 2015), was used, and data was collected voluntarily from university students. The sample consisted of 1,191 South African undergraduate university students aged between 18 and 30. The sample consisted mostly of female students, comprising 77.5% of the sample (n = 923), while the remaining 22.5% of the sample consisted of male students (n = 268). The average age of the participants was 22.12 years (SD = 2.65). This sample consisted of a diverse range of ethnicities, with the vast majority of the sample identifying as Black (n = 961, 80.7%). The remaining 19.3% consisted of participants who identify as Colored (n = 49, 4.1%), White (n = 153, 12.8%), Asian (n = 1, 0.1%), and Indian (n = 4, 0.3%). The majority of the undergraduate students were in their second year of study (n = 596, 50.0%). The rest of the students were in the following years: the first year of study (n = 29, 2.4%), the third year of study (n = 439, 36.9%), the fourth year of study (n = 72, 6.0%), and other (n = 55, 4.6%). With regards to first-generation students, the sample was more or less evenly divided between first-generation students (n = 539, 45.3%) and non-first-generation students (n = 652, 54.7%), with there being more non-first-generation students in the sample.
Measuring Instruments
Data was collected using a biographical questionnaire to obtain demographic information and four formal measuring instruments to measure the various variables.
Ryff’s Scales of Psychological Well-Being (SPWB; Ryff & Singer, 2008) was used to measure the PWB of the participants. The SPWB consists of 42 items across six dimensions, namely (i) Autonomy, (ii) Environmental Mastery, (iii) Personal Growth, (iv) Positive Relations, (v) Purpose in Life, and (vi) Self-acceptance (Henn et al., 2016; Ryff, 1989, 2014). The SPWB uses a six-point Likert-type scale with response options that range from 1 (“strongly disagree”) to 6 (“strongly agree”) (Henn et al., 2016; Ryff, 1989, 2014). Internal consistencies identified in previous studies for the core dimensions ranged between 0.40 to 0.88 (Chan et al., 2019; Gao & McLellan, 2018; Li, 2014; van Dierendonck et al., 2008). Higher scores imply higher levels of PWB in terms of the specific PWB dimensions (Ryff, 1989).
The Student Adaption to College Questionnaire (SACQ; Credé & Niehorster, 2012) was used to measure the adjustment of the participants. The SACQ consists of 55 items covering two subscales, namely (i) Positive Adjustment and (ii) Negative Adjustment (Credé & Niehorster, 2012; LaBrie et al., 2012). The responses are indicated using a nine-point Likert-type scale ranging from 1 (“doesn’t apply to me at all”) to 9 (“applies very closely to me”) (LaBrie et al., 2012). Exceptional internal consistencies for the subscales have been identified in a previous study as 0.92 for Negative Adjustment and 0.93 for Positive Adjustment (LaBrie et al., 2012). A higher score for Positive Adjustment implies that a person is positively or well adjusted to university. In contrast, a higher score for Negative Adjustment suggests that a person is negatively or poorly adjusted to university (LaBrie et al., 2012).
The Schutte Emotional Intelligence Questionnaire (SEIS; Schutte et al., 1998) was used to measure the emotional intelligence of the participants. The SEIS consists of 33 items on a five-point Likert-type scale with response options that range from 1 (“strongly disagree”) to 5 (“strongly agree”) (Gardner & Qualter, 2010; Jonker & Vosloo, 2008; Schutte et al., 1998, 2009). The SEIS measures global trait emotional intelligence (Schutte et al., 1998, 2009). A high score is indicative of higher levels of emotional intelligence (Schutte et al., 2009). Exceptional internal consistencies, ranging between 0.90 and 0.93, have been reported in previous studies (Cronje, 2019; Gardner & Qualter, 2010; Jonker & Vosloo, 2008; Schutte et al., 1998, 2009).
The Media and Technology Usage and Attitudes Scale (MTUAS; Rosen et al., 2013) was used to measure the media and technology usage of the participants. The MTUAS is a 60-item scale that includes 11 usage subscales: Smartphone Usage, General Social Media Usage, Internet Searching, E-Mailing, Media Sharing, Text Messaging, Video Gaming, Online Friendships, Facebook Friendships, Phone Calling, and TV Viewing (Rosen et al., 2013). The MTUAS also includes four attitudes subscales (Rosen et al., 2013). However, for this study, only the usage subscales were used. The usage subscales use a 10-point Likert-type scale with response options that range from 1 (“never”) to 10 (“all the time”) (Rosen et al., 2013). Adequate to good internal consistencies of the subscales, ranging between 0.71 and 0.89, have been reported in previous studies (Cronje, 2019; Oäzguär, 2016; Van Tonder, 2020). Higher scores indicate more regular use of media and technology (Rosen et al., 2013). Previous studies have grouped the 11 subscales into three dimensions: (i) Media usage for social engagement (Online Friendships, Facebook Friendships), (ii) Media usage for communication (E-Mailing, Text Messaging, Phone Calling, Smartphone Usage, Media Sharing), and (iii) Media usage for leisure (TV Viewing, Internet Searching, Video Gaming, General Social Media Usage) (Cronje, 2019; Van Tonder, 2017, 2020). Good to exceptional internal consistencies for the three respective dimensions, ranging between 0.89 and 0.96, were reported in previous studies (Cronje, 2019; Van Tonder, 2017, 2020). These three dimensions were used in this research study.
Procedure
This study was approved by the Institutional Review Board (IRB) at the authors’ affiliated university before data collection. The research project was advertised during undergraduate Psychology lectures, and students could voluntarily participate in the study. The questionnaires were administered in English and completed in the students’ own time through the online educational platform, Blackboard. The students had 3 months to complete the questionnaires. A coding system was used to ensure the anonymity of the participants. During data collection, the principles of confidentiality, beneficence, and non-maleficence were upheld (Allan, 2015). All the participants had to provide written informed consent before they could participate in the study. The research information leaflet explained that the study was anonymous and voluntary, and permission to report and store their data was obtained. The safety and confidentiality of the data was ensured. Participants were allowed to withdraw from the study at any point. Counseling services were available should any participants experience any distress due to the study. However, no students reported any need for counseling services.
Data Analysis
Descriptive statistics were calculated for the sample and the measuring instruments. Cronbach alpha coefficients were calculated to investigate the internal consistencies of the measuring instruments. Pearson correlations were then calculated to investigate the relationships between the variables, namely PWB, Emotional Intelligence, Adjustment, Media and Technology Usage, and Gender. In order to determine the contribution of the various predictor variable(s) or combination of predictor variables to the variance of PWB, hierarchical regression analyses were conducted. According to Steyn (2005), the effect size can be defined as small (0.10), medium (0.30), and large (0.50) regarding correlations. With regards to hierarchical regression, Cohen (1992) stated that effect size can be defined as small (0.02), medium (0.15), and large (0.35). In this study, the focus was only on results that were statistically and practically significant. Statistical significance demonstrates the existence of an effect in a study based on levels of significance, while practical significance demonstrates the magnitude of the effect and whether the effect is significant enough to have practical implications in the real world. Both the 1% and 5% level of significance was used in the analyses of the data.
Results
Descriptive Analyses
The means, standard deviations, skewness, kurtosis, and internal consistencies of the various measuring instruments are reported in Table 1.
Descriptive Statistics and Reliability Coefficients for the PWB, SEIS, SACQ, and MTUAS Dimensions.

It is evident in Table 1 that five of the SPWB subscales, the SEIS, SACQ subscales, and the three dimensions of the MTUAS all have adequate to exceptional internal consistencies ranging from 0.60 to 0.95. However, the subscale Environmental Mastery was not included in further statistical analyses due to an unsatisfactory Cronbach alpha of .40. With regards to skewness and kurtosis, according to Kahane (2008), the cut-off point for skewness is
Correlations Between the PWB Scales and Gender, Positive and Negative Adjustment, Emotional Intelligence, and the MTUAS Dimensions (N = 1,191).

Note. PA = positive adjustment; NA = negative adjustment; M1 = media usage for social engagement; M2 = media usage for communication; M3 = media usage for leisure.
p ≤ .01. *p ≤ .05.
In order to investigate the correlations between the variables, Pearson correlations were calculated for the variables. In order to use Gender as a demographic predictor variable, the researchers created two categories, namely Male (coded 1) and Female (coded 2). The correlation coefficients are illustrated in Table 2.
Table 2 shows that Autonomy has statistically significant positive correlations with Positive Adjustment and Emotional Intelligence. These correlations are statistically significant at the 1% level with respective medium effect sizes of .35 and .34. These findings seem to suggest that students with higher levels of autonomy tend to adjust better to university and have higher levels of emotional intelligence. Similarly, these findings may also suggest that well-adjusted students and students with higher levels of emotional intelligence tend to have higher levels of autonomy.
Personal Growth has statistically significant positive correlations with Positive Adjustment and Emotional Intelligence. These correlations are statistically significant at the 1% level with respective medium effect sizes of .41 and .46. Personal Growth also has a statistically significant negative correlation with Negative Adjustment. This correlation is statistically significant on the 1% level with a medium effect size of .38. These findings seem to suggest that students with higher levels of personal growth tend to be better adjusted to university and have higher levels of emotional intelligence. Similarly, these findings may suggest that well-adjusted students and students with higher levels of emotional intelligence tend to have higher levels of personal growth.
Table 2 indicates that Positive Relations has statistically significant positive correlations with Positive Adjustment and Emotional Intelligence. These correlations are statistically significant at the 1% level with respective medium effect sizes of .47 and .41. Positive Relations also has a statistically significant negative correlation with Negative Adjustment. This correlation is statistically significant on the 1% level with a medium effect size of .39. These findings seem to suggest that students with higher levels of positive relations tend to be better adjusted to university and have higher levels of emotional intelligence. Similarly, these findings may suggest that well-adjusted students and students with higher levels of emotional intelligence tend to have higher levels of positive relations.
In addition, Table 2 indicates that Purpose in Life has statistically significant positive correlations with Positive Adjustment and Emotional Intelligence. These correlations are statistically significant at the 1% level with respective medium effect sizes of .48 and .40. Purpose in Life also has a statistically significant negative correlation with Negative Adjustment. This correlation is statistically significant on the 1% level with a medium effect size of .36. These findings seem to suggest that students with higher levels of purpose in life tend to be better adjusted to university and have higher levels of emotional intelligence. Similarly these findings suggest that well-adjusted students and students with higher levels of emotional intelligence tend to have higher levels of purpose in life.
Lastly, Table 2 indicates that Self-acceptance has statistically significant positive correlations with Positive Adjustment and Emotional Intelligence. These correlations are statistically significant at the 1% level with respective large and medium effect sizes of .53 and .39. Self-acceptance also has a statistically significant negative correlation with Negative Adjustment. This correlation is statistically significant on the 1% level with a medium effect size of .48. These findings seem to suggest that students with higher levels of self-acceptance tend to be better adjusted to university and have higher levels of emotional intelligence. Similarly, these findings suggest that well-adjusted students and students with higher levels of emotional intelligence tend to have higher levels of self-acceptance.
Hierarchical Regression Results
Hierarchical regression analyses were conducted to identify the contribution of the combination of predictor variables (i.e., Gender, Adjustment, Emotional Intelligence, and Media and Technology Usage) and the contribution of the individual predictor variables to the percentage of the variance in PWB.
The results of the hierarchical regression analyses with Autonomy as criterion variable are reported in Table 3.
Contributions of Gender, Adjustment, Emotional Intelligence, and MTUAS Dimensions to R2 With Autonomy as Criterion Variable.

Note. PA = positive adjustment; NA = negative adjustment; M1 = media usage for social engagement; M2 = media usage for communication; M3 = media usage for leisure.
p ≤ .01.
As illustrated in Table 3, the combination of the independent variables is responsible for 17.8% (
The results of the hierarchical regression analyses with Personal Growth as a criterion variable are reported in Table 4.
Contributions of Gender, Adjustment, Emotional Intelligence, and MTUAS Dimensions to R2 With Personal Growth as Criterion Variable.
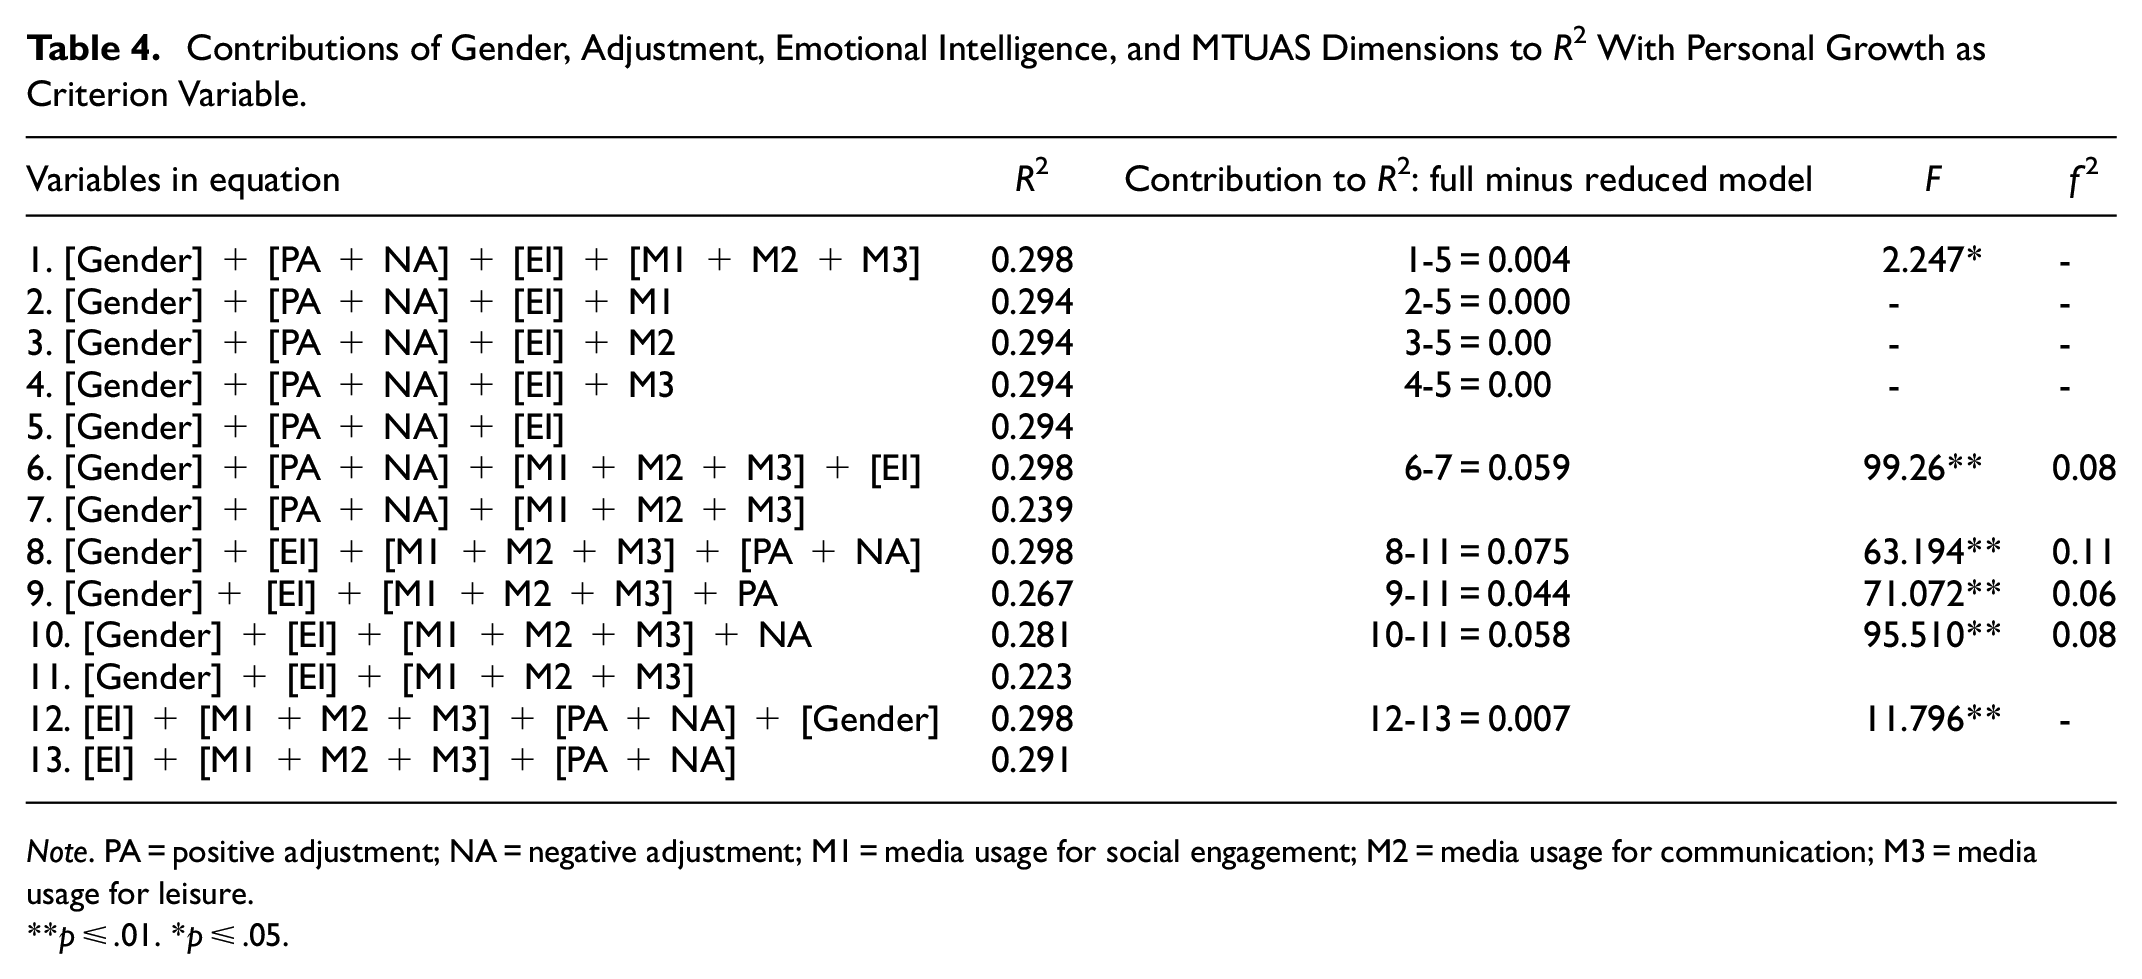
Note. PA = positive adjustment; NA = negative adjustment; M1 = media usage for social engagement; M2 = media usage for communication; M3 = media usage for leisure.
p ≤ .01. *p ≤ .05.
As illustrated in Table 4, the combination of the independent variables is responsible for 29.8% (
The results of the hierarchical regression analyses with Positive Relations as criterion variable are reported in Table 5.
Contributions of Gender, Adjustment, Emotional Intelligence, and MTUAS Dimensions to R2 With Positive Relations as Criterion Variable.

Note. PA = positive adjustment; NA = negative adjustment; M1 = media usage for social engagement; M2 = media usage for communication; M3 = media usage for leisure.
p ≤ .01.
As illustrated in Table 5, the combination of the independent variables is responsible for 30.3% (
The results of the hierarchical regression analysis with Self-acceptance as a criterion variable are reported in Table 6.
Contributions of Gender, Adjustment, Emotional Intelligence, and MTUAS Dimensions to R2 With Self-acceptance as Criterion Variable.

Note. PA = positive adjustment; NA = negative adjustment; M1 = media usage for social engagement; M2 = media usage for communication; M3 = media usage for leisure.
p ≤ .01.
As illustrated in Table 6, the combination of the independent variables is responsible for 37.4% (
The results of the hierarchical regression analysis with Purpose in Life as criterion variable are reported in Table 7.
Contributions of Gender, Adjustment, Emotional Intelligence, and MTUAS Dimensions to R2 With Purpose in Life as Criterion Variable.
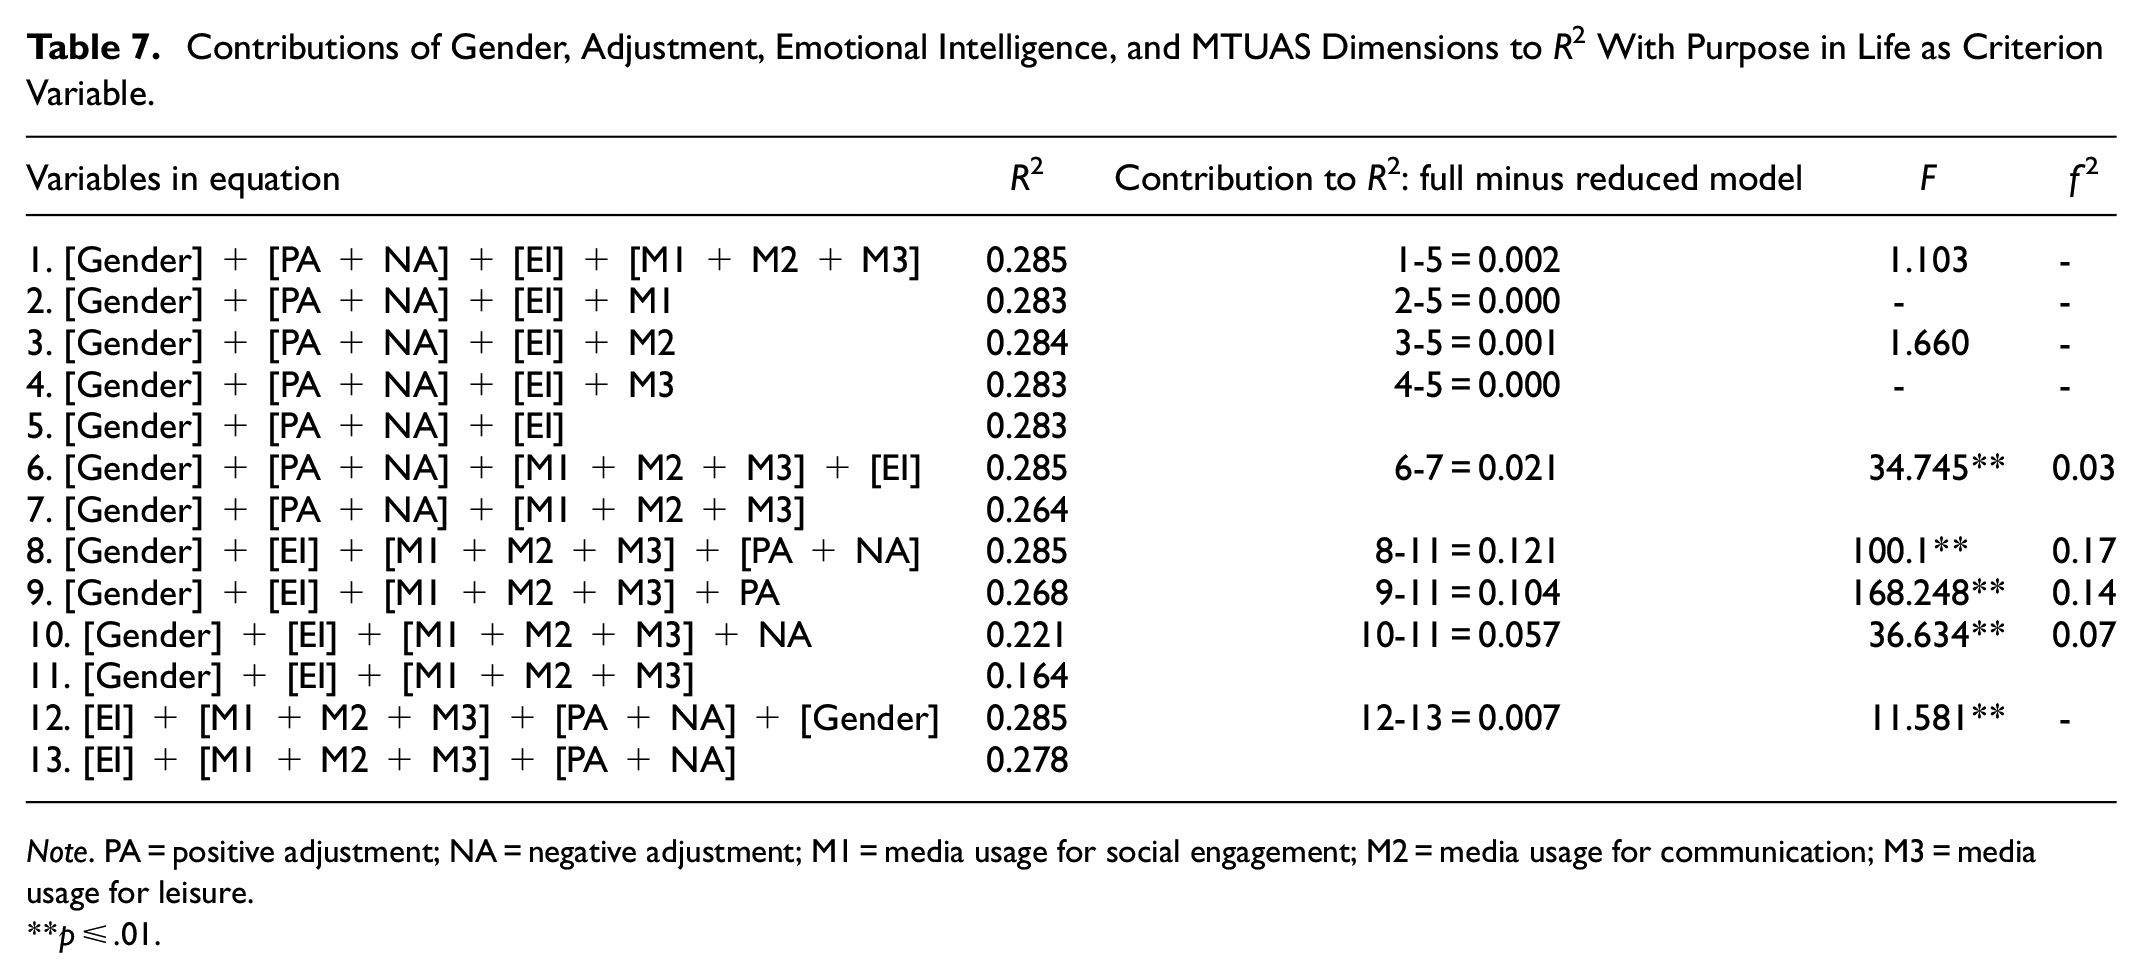
Note. PA = positive adjustment; NA = negative adjustment; M1 = media usage for social engagement; M2 = media usage for communication; M3 = media usage for leisure.
p ≤ .01.
As illustrated in Table 7, the combination of the independent variables is responsible for 28.5% (
Discussion
Discussion of the Significant Correlations With Adjustment in This Study
Correlations were determined between the predictor variables and the criterion variables. This included correlations between the five subscales of SPWB and Adjustment, Emotional Intelligence, Media and Technology Usage, and Sex. The discussion will focus on the correlations with adjustment due to adjustment being the only individual predictor variable that statistically and practically significantly contributed to the explanation of the variance of PWB.
This study found that improved adjustment (i.e., higher levels of positive adjustment and lower levels of negative adjustment) was statistically and practically significantly associated with increased levels of Personal Growth, Positive Relations, Purpose in Life, Self-acceptance, and Autonomy. Well-adjusted university students tend to have higher levels of autonomy (Girelli et al., 2018; Lamborn & Groh, 2009), as explained by the Self-Determination Theory of Ryan and Deci (2000), indicating that intrinsic or autonomous motivated individuals engage in activities for their own pleasure, interest, and satisfaction. This motivation is often found in self-determined students and is related to greater academic performance and adjustment to university (Girelli et al., 2018; Ryan & Deci, 2000, 2017). Similarly, individuals with higher levels of autonomy tend to be better adjusted to university (Girelli et al., 2018; Lamborn & Groh, 2009).
Well-adjusted university students tend to have deeper relationships that provide a sense of belonging, fostering an ideal environment for individual or personal growth (Ball et al., 2020; Young et al., 2013). This is also in line with Alfred Adler’s theory of Social Interest which states that individuals depend on social interactions to find meaning in life and engage in personal growth (Ball et al., 2020; Crandall, 1980). Personal Growth has furthermore been linked to better adjustment and acts as a buffer against psychological distress (Dweck et al., 1995; Schroder et al., 2017; Staudinger & Kessler, 2009; Yeager et al., 2014). Personal Growth also has a statistically significant negative correlation with Negative Adjustment. Increased levels of maladjustment and increased psychological distress tend to lead to decreased levels of personal growth (Schroder et al., 2017).
According to Erikson’s theory of psychosocial development, individuals in their early 20s face the critical developmental task of establishing intimate relationships with others (Fleming & Erikson, 2004; Goguen et al., 2008; Knight, 2017). Developing mature relations with others is considered one of Chickering’s developmental tasks for undergraduate university students (Chickering, 1969). Therefore, relationships with others are considered vital to our development (Fleming & Erikson, 2004; Goguen et al., 2008; Knight, 2017). Close or positive relations with others can be seen as a marker of adjustment in university students (Baker, 2006; Fass & Tubman, 2002; Laursen & Mooney, 2008). Positive Relations with parents and university peers are associated with improved adjustment amongst university students (Fass & Tubman, 2002; Goguen et al., 2008; Laursen & Mooney, 2008; Wintre & Yaffe, 2000).
Finding one’s purpose in life is considered the driving force in life (Frankl, 1969; Wong, 2014). The university environment provides opportunities for self-exploration, which is important for developing one’s purpose in life (Pfund et al., 2020). The literature shows that well-adjusted university students tend to have a higher sense of purpose in life (DeWitz et al., 2009; Liter, 1987; Wesley & Booker, 2021). Well-adjusted individuals can shift their mindset from what they cannot control onto what they can control and thus has better control over their meaning or purpose in life. Therefore, better adjustment can increase life purpose (Dollinger, 1986; Park & Folkman, 1997; Thompson et al., 2003).
According to Maslow’s hierarchy of needs, self-acceptance is crucial for all self-actualizing individuals (Compton, 2018). The university environment and opportunities that the university provides, such as establishing close relationships and developing self-awareness, tend to contribute to the development of self-acceptance (Ceyhan & Ceyhan, 2011). Ceyhan and Ceyhan (2011) found that self-acceptance increases throughout students’ undergraduate degrees. Well-adjusted university students are more likely to accept the more unflattering aspects of themselves and thus have higher levels of self-acceptance (Taylor & Combs, 1952; Williams & Lynn, 2010).
Discussion on the Predictors of Psychological Well-Being
The combination of the predictor variables (MTUAS dimensions, Emotional Intelligence, Adjustment, and Gender) statistically significantly contributed to the explanation of the variance of the subscales of PWB (Autonomy, Personal Growth, Positive Relations, Purpose in Life, and Self-acceptance). Positive Adjustment as an individual predictor variable statistically and practically significantly contributed to the explanation of the variance of Positive Relations, Self-acceptance, and Purpose in Life. Negative Adjustment as an individual predictor variable statistically and practically significantly contributed to the explanation of the variance of Self-acceptance. Positive Adjustment and Negative Adjustment as a combination statistically and practically significantly contributed to the explanation of the variance of Positive Relations, Self-acceptance, and Purpose in Life.
Positive relations with parents and university peers are associated with improved adjustment amongst university students (Fass & Tubman, 2002; Goguen et al., 2008; Laursen & Mooney, 2008; Wintre & Yaffe, 2000). Well-adjusted university students tend to use social support provided by their friends and tend to have more quality friendships or positive relations (Buote et al., 2007). When students leave high school and start attending university, their social network decreases, especially if they leave their home to study at university (Buote et al., 2007). Therefore, university students need to build up their social network by making new friends at university. Well-adjusted first-year students, therefore, tend to have more quality friendships or positive relations (Buote et al., 2007).
Developing a sense of purpose is another vector of development identified by Chickering (1969). Purpose in life has been linked to the activities that university students partake in Molasso (2006). Well-adjusted university students tend to study more, spend more time with friends, exercise, and socialize at parties, ultimately leading to a higher sense of purpose in life (Molasso, 2006; Terenzini & Pascarella, 1991).The literature shows that well-adjusted university students tend to have a higher sense of purpose in life (DeWitz et al., 2009; Liter, 1987; Wesley & Booker, 2021). Well-adjusted university students tend to study more, spend more time with friends, exercise, and socialize, ultimately leading to a higher sense of purpose in life (Molasso, 2006; Terenzini & Pascarella, 1991). Therefore, better adjustment can increase life purpose (Dollinger, 1986; Park & Folkman, 1997; Thompson et al., 2003).
Self-acceptance entails unconditional acceptance of oneself as an infallible human being who makes mistakes (MacInnes, 2006). Self-acceptance has been linked to lower levels of depression and anxiety and higher levels of psychological health (MacInnes, 2006). Individuals who have higher levels of self-acceptance are more likely to know their strengths and weaknesses, possess personal resources, and have better adjustment to university (Balakrishnan, 2019; Raines & Lewandowski, 2009; Williams & Lynn, 2010).
The COVID-19 pandemic brought many new challenges for university students who had to adjust to working online and losing many of the aspects of university that aid adjustment such as Positive Relations with peers (Adedoyin & Soykan, 2023; Kaisara & Bwalya, 2020). While more research is still needed to clarify the effects of the pandemic on university student’s adjustment, the pandemic highlighted to the world the importance of adjustment and how challenging it can be to one’s mental health (Adedoyin & Soykan, 2023; Arslan et al., 2022).
Psychological well-being continues to be a variable of increased interest as it’s importance in society, especially within the university student population, is evident. The significant finding of adjustment as a predictor of various subscales of PWB can be practically applied in order to better the PWB of university students. This study and previous research have highlighted the need to support South African university students due to the unique challenges they face. As such, the findings of this study and future research should be used to inform workshops, interventions, and psycho-education programs for university students to improve their PWB. This can improve university intervention strategies and ultimately improve the mental health of university students in South Africa. On a larger scale, the improvement of PWB in university students could ultimately lead to decreased drop-out and failure rates amongst university students in South Africa (Essop, 2020; Mokgele & Rothmann, 2014). This could improve the economy of South Africa and improve the high unemployment rates, currently sitting at 35.3% in 2022 (Statistics South Africa, 2022).
Limitations and Recommendations
There are limitations that may have impacted the results obtained within the study, and the results of this study should, therefore, be interpreted against these limitations. Firstly, the results cannot be generalized to different university student populations across South Africa as a result of using non-probability sampling. Secondly, this study used self-reported questionnaires, which are by nature subjective to the participant. This can lead to the limitation of participants not answering truthfully, especially to more sensitive questions.
In order to better the understanding of PWB, it is recommended that further research is conducted at various universities across South Africa as well as in other tertiary education contexts such as FET colleges. This will increase the generalizability of the results across students in South Africa. Furthermore, research should also be conducted on postgraduate university students as they may have different experiences. It is recommended that further studies make use of probability sampling to ensure the generalizability of the results. In addition, a longitudinal or qualitative approach would be beneficial in contributing to a more in-depth understanding of PWB.
Contribution of This Study
The main contribution of this study is the identification of Adjustment as a statistically and practically significant predictor of PWB in university students. Furthermore, this study contributes to the internationally growing body of research dedicated to PWB. In addition, it contributes more specifically to the understanding of PWB in a South African context and within a university student population. This study also contributes to a better understanding of Emotional Intelligence, Adjustment to University and Media and Technology Usage in South African undergraduate university students as predictors of psychological well-being.
Lastly, as previously discussed, PWB influences the academic, emotional and mental well-being of university students. It is, therefore, worth measuring and intervening with the PWB of university students. The findings of this study can be used to inform workshops, interventions and psycho-educational programs aimed at improving the psychological well-being of university students.
Footnotes
Declaration of Conflicting Interests
The author(s) declared no potential conflicts of interest with respect to the research, authorship, and/or publication of this article.
Funding
The author(s) received no financial support for the research, authorship, and/or publication of this article.
Ethical Statement
This research study was conducted in accordance with the ethical standards of the institutional research committee. The ethical clearance number is: UFS-HSD2020/1134/0510.
Data Availability Statement
The data that support the findings of this study are available from the corresponding author upon reasonable request.