
Abstract
Technology-mediated group toxicity polarization is a major socio-technological issue of our time. For better large-scale monitoring of polarization among social media news content, we quantify the toxicity of news video comments using a Toxicity Polarization Score. For polarizing news videos, our premise is that the comments’ toxicity approximates either an “M” or “U” shaped distribution—that is, there is unevenly balanced toxicity among the comments. We evaluate our premises through a case study using a dataset of ~180,000 YouTube comments on ~3,700 real news videos from an international online news organization. Toward polarization-mitigating information systems, we build a predictive machine learning model to score the toxicity polarization of news content even when its comments are disabled or not available, as it is a current trend among news publishers to disable comments. Findings imply that the most engaging news content is also often the most polarizing, which we associate with increasing research on clickbait content and the detrimental effect of attention-based metrics on the health of online social media communities, especially news communities.
Plain Language Summary
Findings imply that the most engaging news content is also often the most polarizing, which we associate with increasing research on clickbait content and the detrimental effect of attention-based metrics on the health of online social media communities, especially news communities.
Introduction
Group polarization, referred to as “hyperpartisanship” in the political context, is defined as a state of social interaction where the participants are strongly divided (Kalsnes & Larsson, 2021).
Studies suggest that polarization emerges when the viewpoints of people from different backgrounds crash and collide. It has also been suggested that online toxicity is associated with group polarization in online environments (Binns, 2012; Salminen et al., 2018; Singer, 2010). We refer to this as “toxicity polarization,” Within online discussions, toxicity polarization is a critical phenomenon that reflects the stark contrast of online communication behaviors (Vicario et al., 2019), particularly on digital platforms where discussions occur. Toxicity polarization specifically refers to a situation where there is a clear divide between at least two groups of discussants: one exhibiting highly toxic behavior in their comments and interactions and the other maintaining non-toxic or neutral discourse. Concerning scope, toxicity polarization is most prevalent on digital platforms, including social media, online forums, comment sections of news websites, and anywhere user interactions are allowed. Due to their global reach and anonymity, social media platforms often serve as hotbeds for such polarized toxicity. While politics and social justice issues are often considered the most common triggers, toxicity polarization can occur in discussions on various topics, including health, science, religion, and entertainment. The primary objects of toxicity polarization are both online individuals and communities. Individuals may face direct attacks, cyberbullying, or harassment, while communities or groups may experience collective targeting, stereotyping, or hate speech. Toxicity polarization also targets conflicting ideas, beliefs, and values, with the toxic group often resorting to aggressive behavior to suppress opposing viewpoints rather than engaging in constructive dialog. Characteristically, toxicity polarization typically uses aggressive, hateful, or derogatory language, often charged with extreme emotions, including personal attacks, profanity, threats, and inflammatory statements. In toxicity polarization, there is a noticeable absence of moderate opinions or a middle ground. The discourse is split into extremes, with no apparent pathway for compromise or mutual understanding.
Related Literature
This notion arises from our extant understanding of polarization dynamics in online social media. For example, Rossini (2020 p. 176) writes, “this type of [toxic] discourse can affect people’s perception of the credibility, trustworthiness, and quality of news outlets and articles, and can increase polarization …”. Online group polarization, along with its associated hate and intolerance, results in adverse effects on social media users’ well-being, which is why studying this phenomenon is vital for media and journalism, as well as for the broader society (Garimella et al., 2017; Rossini, 2020). Furthermore, polarization detection forms the first step in developing information systems to address this socio-technical challenge (Qureshi et al., 2020).
Researchers have mainly linked polarization with online news content (Dori-Hacohen et al., 2021; Feezell et al., 2021; Salminen et al., 2020), for example, regarding COVID-19 news (Chipidza, 2021). News stories may evoke emotional reactions from online audiences and result in aggressive responses against the news channel, other viewers or readers, or the subjects covered in the news stories, such as refugees, political actors, nations, and vulnerable or marginalized groups (Rossini, 2020). On the other hand, news stories can also yield positive responses, such as expressions of empathy and goodwill and wishful and hopeful responses to crises.
At times, these two types of reactions—aggressive and constructive—may co-exist so that the audience is firmly split into those reacting abusively and those responding in constructive ways (Qureshi et al., 2020; Wakefield & Wakefield, 2023). Altogether, these considerations make it crucial to understand better the polarizing effect of online news content toward “healthier” information ecosystems. This understanding relies on an empirical analysis of polarization regarding where it occurs, how frequent it is, and so on. Nevertheless, it is not clear how to quantify polarization on online news content, and particularly to quantify how likely a given news story is to result in polarizing reactions among the news’ audience. Developing tools and techniques to be embodied in polarization-mitigating information systems can, therefore, entail solutions to aid a piece-by-piece alleviation of online polarization, which essentially is a “wicked” socio-technological issue riddled with complexity.
Understanding online group polarization at scale is valuable for many stakeholder groups. First, news media channels and organizations are incentivized to measure audience responses and moderate over-heated discussions to maintain the health of online communities. For example, early polarization detection can help shut down comment sections before the discussion exceeds the news channel’s norms for acceptable behavior (Canter, 2013). Second, social media platforms deal with various adverse effects associated with group polarization, which is sometimes referred to as the “dark side of social media” (Chandrasekharan et al., 2017; Chen & Wang, 2022; Patton et al., 2016; Salminen et al., 2018; Sood et al., 2012). For them, quantifying polarization on their platforms represents a vital endeavor to mitigate the effects of controversy on the psychological well-being of their users, especially those not interested in polarizing content. Third, society as a whole has a vested interest in measuring online group polarization (Simchon et al., 2022), as controversies reveal the current pain points of the public and thus provide insights for policymakers tied to citizens’ divided reactions on particular issues (Garimella et al., 2017; Kumar et al., 2018; Lim, 2017).
Causes for Online Polarization
Table 1 lists example sources for online polarization discussed in the literature, illustrating the plurality of themes sparking online controversy.
Sources for Online Controversies Possibly Leading to Toxic Polarization.

Note. Previous literature shows that many topics and issues are associated with polarization.
Overall, online polarization can be defined as a high degree of disagreement between individuals or groups with opposing views, beliefs, and values, usually manifesting itself in social networks, discussion forums, or social platforms on the internet (Mkono, 2018; Moule et al., 2017). The concept is closely associated with online provocation, controversy, and trolling, which refer to other online users’ behaviors and strategies to elicit emotional responses (Mkono, 2018). It is mainly associated with news stories that have political elements (Araújo & Prior, 2021), although any news content can potentially be subject to polarized reactions. According to Goyanes (2020), some individuals deliberately “seek out political information and discussion online” (which he refers to as “ideological polarization”). In contrast, incidental polarization occurs when the individual is exposed to political information without their active willingness to seek it, for example, due to a social media newsfeed algorithm recommending political content.
Because of these indirect effects of algorithms and the computer-mediated roles of social media platforms in news dissemination, one of the fundamental questions is whether online environments are particularly fertile grounds for controversies and polarization. According to Khorasani (2008, p. 2), like their counterparts in offline social networks, participants in online communities “make friendships and argue with each other and become involved in long and tedious conflicts and controversies.”Moule et al. (2017) observe, however, that online environments have created new forms of socialization and have forged changes in intra- and inter-group relations, while Hardaker (2010, p. 215) argues that the relative anonymity provided in online exchanges “may encourage a sense of (…) freedom from being held accountable for inappropriate behavior.”
Other studies highlight the democracy of online environments as a contributing factor to online polarization (Hauser et al., 2017). Chatzakou et al. (2017) postulate that because of the pseudo-anonymity of online platforms, people tend to express their viewpoints with less inhibition than they would in face-to-face interactions. Because the internet brings together people with different backgrounds and provides a space for people to interact who would not normally interact with each other, an environment is created where different attitudes and points of view are presented. This creates the conditions for polarization to arise (Khorasani, 2008). While the scale of discussions and the publicity fostered by online environments may encourage debate, at worst, they also encourage vindictive controversies (Garimella et al., 2017).
Online environments are particularly vexing for marginalized or vulnerable groups because discriminatory patterns of social engagement, including sexism and racism, tend to be exacerbated online (Herring et al., 2002). Although the internet gives unprecedented access to differing views, people tend to filter out opposing views, and when offered a choice, users prefer like-minded content (Garimella et al., 2017), forming what is referred to as echo chambers. It is further seen that echo chambers fuel polarization and reinforce harassing behavior when hateful attitudes migrate outside the community. Lim (2017) examines online firestorms through social proof theory, which maintains that users tend to form opinions based on popularity metrics (e.g., likes and shares) and side with what is perceived as the most popular opinion. Patton et al. (2016) study outreach workers’ views on violent youths’ use of social media and note that youths taunt rival gangs online and curate their own self-image, but they show little concern for online privacy. However, they found that when youth workers had strong relationships of trust with youths, social media could also play a positive role in preventing or de-escalating violence.
Detection of Online Polarization
Qualitative approaches largely dominate the analysis of online primarily dominated journalistic studies. A predominant technique for analyzing online polarization is issue/debate mapping. Marres (2015) provides an overview of the development of issue mapping, tracing its roots to the study of scientific controversies. Marres and Moats (2015) discuss three different strategies for dealing with polarization on Twitter, each related to a specific epistemological view: (1) precautionary (described as “scientific-empiricist”), (2) affirmative (described as “performative”), and (3) a radical approach. The precautionary approach views social media platforms as largely instrumental in that polarization occurs on these platforms but is not fundamentally influenced by the platform itself. Studies following this approach aim to clean up the data to exclude platform-specific artifacts, such as bots. The performative approach adopts a more positive outlook on medium-specific artifacts, and as Marres and Moats (2015) note, because search engines count links and consider metadata, they can also reveal the political sentiments driving the content, thus providing information on the causes of polarization. The third approach—and the one advocated by Marres and Moats (2015)—seeks to find a symmetrical view that pays equal attention to the content of the polarization and the mediating role of social media.
The radically empiricist approach acknowledges media bias and views online resources as empirical events, not merely as platforms for polarization. Munk (2014) presents an example of a radically empiricist approach to controversy mapping and describes the approach as follows (p. 3): “controversy mapping works from the pragmatic principle that whatever makes a difference to the actors in the controversy should be charted and given a place on the map relative to its importance.” However, the limitation of radically empiricist debate mapping is that it sheds limited light on users’ specific strategies to inflict polarization.
Studies employing discourse analysis are helpful in this regard. Korasani (2008) draws interesting correlations between polarization in online discussion forums and religious controversies of the past and discusses common rhetorical strategies related to online polarization. These include (a) opening moves, (b) attacking moves, (c) defending moves, (d) counterattacks, (e) deflecting moves, (f) accusation moves related to violations of principles of communication, (g) neutral moves, and (i) using rhetorical and direct questions. A similar approach is found in studies of rhetoric and the linguistic pragmatics of trolling (Hardaker, 2010).
Despite a considerable body of research on (online/group/political) polarization, attempts at quantifying online polarization are scarce. Among the most notable approaches to date, Garimella et al. (2017) propose and test a graph-based algorithm (RWR: Random Walk with Restart) that focuses on reducing controversy by bridging echo chambers. Inspired by studies on how users prefer to consume content, the algorithm considers how likely users are to accept recommendations. This previous research builds a conversation graph for a topic, partitions the graph to identify potential sides of the controversy, and measures the amount of controversy from graph characteristics.
Research Questions
To investigate online group polarization in social media news content, this study addresses three impactful research questions (RQs):
RQ1: How can online polarization be quantified based on users’ comments to a news story?
RQ2: Can online polarization be predicted if the content’s comments are disabled?
RQ3: What engagement features characterize polarizing online news content?
A theoretical framework for this research is the Social Media-Induced Polarization (SMIP) (Qureshi et al., 2020), that highlights instances and consequences of polarization exacerbated by social media platforms. SMIP can lead to widespread societal impacts, including property destruction and human suffering, particularly when misinformation about socio-cultural activities, products, or services proliferates. SMIP highlights the unbalanced nature of information presented to users, contributing to an echo chamber effect where one’s beliefs and ideologies are constantly reinforced. The framework underscores the growing concern of echo chambers, particularly socio-cultural topics.
To address the group polarization challenge, we propose the Toxicity Polarization Score (TPS) as a novel approach for quantifying online polarization via the toxicity of online news comments, and we then conduct machine learning experiments to assess the proposed approach. First, we collect a dataset of comments on news stories from an international news organization’s social media channel. We then score each comment’s toxicity and use the distribution of the toxicity scores of a news story’s comments to determine the story’s level of polarization. After this, we manually analyze the results better to understand the sources of polarization among the online commenters. Finally, we predict the TPS of the news content with the assumption that the comments are disabled, thus relying solely on the content’s meta-data features for prediction. Making such a prediction matters, as some online news media channels have begun to disable the comments for content that they perceive as inflammatory (Canter, 2013), and we aim to show that the polarization of this content can still be determined, given that one has suitable meta-data about users’ behavior, i.e., how they engage with the content. However, disabling commenting does not solve or remove the underlying problem of polarization, so it is still imperative to understand the relationship between news stories and polarization, even in the absence of commenting.
Materials and Methods
Data Collection
Using the YouTube Analytics API, 1 we collect ~180,000 social media comments from ~3,700 news stories published in a video format by an international news channel on YouTube. The data was collected with the organization’s permission. We chose this channel to investigate polarization because they cover a range of news topics and focus on “serious” news, such as politics and international affairs, rather than entertainment. The channel had, at the time of the data collection, a diverse viewership of 605,015 subscribers from more than 150 countries, and the comments on the news stories are often varied in their reactions, thus affording a rich dataset for analyzing online group polarization. Overall, there are 3,714 news stories with a total of 180,773 comments. Each story received 49 comments on average, although the median number of comments per story was much lower (n = 18). Each comment was passed through the Perspective API, 2 a publicly available service for the toxicity scoring of online comments, in order to obtain a toxicity score. The toxicity score of a comment range from 0 to 1, where 0 indicates no toxicity and 1 indicates a highly toxic comment. The combination of a publicly available API and custom-developed detection algorithm illustrates the feasibility of implementing a technology stack into information systems to mitigate online polarization (Qureshi et al., 2020).
This research approach is novel by integrating mixed methods methodology with advanced technology tools to analyze and assign toxicity scores within the context of online group polarization. Firstly, using the YouTube Analytics API for data collection enables an in-depth, large-scale analysis of social media comments, ensuring a comprehensive dataset that reflects diverse global perspectives. This is particularly significant given the international scope of the news channel selected, known for its serious content focus, thereby providing a rich, varied, and relevant context for polarization study. Moreover, the innovative use of the Perspective API to assign toxicity scores to individual comments automates identifying potentially polarizing content and introduces a standardized measure of “toxicity,” allowing for more objective, quantifiable, and replicable (by other researchers) outcomes. Integrating custom-developed detection algorithms further enhances the research methodology, offering a tailored approach to understanding the nuances of online discourse within the specific framework of news commentary. Also, this mixed methods approach, combining quantitative data with qualitative analysis, allows for a more nuanced understanding of online group polarization, addressing the complexity of human interaction in digital communication by recognizing that toxicity is not merely present or absent but exists on a spectrum. Different comments can reflect varying degrees of polarization, a subtlety that a more traditional, singular method might miss. Finally, the feasibility of implementing this technology into information systems (Qureshi et al., 2020) underscores the practical implications of this research, suggesting potential for real-world applications in mitigating online polarization. This practical aspect is crucial in the current digital age, where online discourse significantly influences public opinion and societal dynamics. Therefore, this research’s approach is novel and profoundly relevant to contemporary society’s challenges.
Using the Perspective API to assign toxicity scores to individual comments is a creditable research strategy for large volumes of data, such as social media comments. The Perspective API allows researchers to analyze large datasets like ours efficiently. Manual review of such volumes of text would be prohibitively time consuming and resource intensive. The Perspective API can quickly process large quantities of data, providing quick results that can significantly accelerate the research timeline. Human review of comments can be subjective, with different reviewers potentially assigning different toxicity levels to the same comment. The Perspective API applies consistent criteria to all comments, eliminating human bias and ensuring the toxicity scoring is based on the same standards across the entire dataset.
The Perspective API is built on advanced machine learning models trained on vast swaths of data, enabling them to understand nuances and context that might escape a more straightforward analysis. These models can identify patterns and trends across large datasets, providing insights that are not immediately apparent through manual analysis. It, therefore, allows for adjustments based on the context and the specific needs of a project. Researchers can calibrate the sensitivity of toxicity detection based on their requirements, ensuring that the analysis reflects the nuances of the content and the cultural and linguistic context in which the comments were made. By assigning quantifiable scores to each comment, the Perspective API facilitates further statistical analysis. By leveraging the capabilities of the Perspective API, researchers and practitioners can gain a more in-depth understanding of online discourse dynamics and contribute to safer, more respectful online interactions. Therefore, the use of the Perspective API is applicable to this research.
Polarization Score
The core intuition of our approach is toxicity polarization, in which we define a situation in which audience responses are polarized in terms of the toxicity of the comments expressed by users. That is, the density of comments is high both on the low and the high end of the toxicity spectrum. Figure 1 illustrates the ideal case of toxicity polarization, which follows an M shape distribution (i.e., a data distribution that resembles the letter “M”). The M shape indicates the simultaneous co-existence of toxic behavior and non-toxic behavior. This distributional analysis for polarization quantification has not been used in previous research.

Toxicity scores outlining polarization with an M-shaped and a U-shaped distribution of news comments.
We choose toxicity score as the foundational metric for quantifying polarization because it captures the hostility of the comments for a particular piece of online content—a type of sentiment conceptually associated with polarization. In the Perspective API, toxicity is defined as “a rude, disrespectful, or unreasonable commenting that is likely to make one leave a discussion” (see Note 2).
Figure 1 illustrates the ideal toxicity score distribution that the comments for a given news story can take. Ideally, we expect a “U” or “M” shaped distribution for a fraction of total comments falling into a set of predefined toxicity ranges in the case of a particular news story. The concepts of U-shape and M-shape are often used in different contexts, such as economics, statistics, and data distribution patterns. In graphical representations, “U-shape” and “M-shape” describe the visual formation of data points or trends. The U-shape is used when the data points create a pattern that looks like the letter “U.” Here, values are higher at the ends and nearly non-existent in the middle, indicating that the middle value is not just low but the lowest. This pattern suggests two extremes with a significant dip in the middle, lacking a moderate or middle range. A U-shape in discussions about trends or distributions means that instances are more frequent at the two opposite ends of a spectrum, with fewer occurrences in between. The M-shape occurs when the data create a pattern resembling the letter “M.” This formation indicates two peaks and a valley, suggesting three prominent points: high, low, and high. The M-shape has a middle value, but it’s part of a sequence of high-low-high, indicating more complexity and range in the data distribution or trend.
The toxicity score ranges between 0–1, and is divided into 10 equal width intervals of 0.1 s.t. B = {b1, b2,…,b10}, where b1 = [0, 0.1], b2 = [0.1, 0.2], and b10 = [0.9, 1]. Since the distribution of the comments for a polarizing news story is expected to follow a “U” or “M” shape, we weigh more the fractions of comments having toxicity scores in the lower ranges (i.e., b1, b2) and higher ranges (i.e., b9, b10) of the toxicity spectrum in comparison to those in the ranges b3, b4, and b5 or b6, b7, and b8. We use a symmetric weighting scheme around b
5
s.t.
Moreover, we define a normalization factor subject to sum all weights in one-half of the toxicity score range sums to 1, that is,

Here,

Here,

Here the TPS represents twice the harmonic mean of
Figure 2 illustrates how the mean toxicity level varies for videos as a function of the number of comments made for the corresponding stories. However, for defining the TPS, we divide the toxicity score range into 10 bins and remove all the stories which have ≤10 comments with an expectation for at least 1 comment per bin. After this reduction, we are left with a total of 2,545 news stories where on average, each story received 69 comments, and the median number of comments per story increased to 30.

Density of comments for different toxicity thresholds.
We estimate the TPS for all the news stories with at least 10 comments. Figure 3a showcases the TPS distribution for all such stories, whereas Figure 3b compares the TPS distribution with the mean toxicity scores for all the comments corresponding to those stories. As we can observe from Figure 3a, the TPS distribution has a nearly normal shape, so we fit a Gaussian distribution on top of this score distribution to obtain a mean TPS of

TPS distribution and its comparison with average toxicity score of all the videos.
Results
Toxicity Score Distributions
In Figure 4, we highlight the comment distribution for the toxicity ranges corresponding to the sample set of the top 6 most polarizing news stories for illustration.

Top 6 most polarizing videos (a through f inclusive) ranked by decreasing TPS.
As per our definition of toxicity polarization, we expect the comment distribution of each of these stories to be approximately close to an “M” or “U” shaped distribution. We observe such a result for these stories following the intuition that for a news story to be polarizing, the density of comments is simultaneously higher on the low and high ends of the toxicity spectrum. The five most toxic and least toxic comments attested to each of these six polarizing stories (see Table 2) indicate that the least toxic and most toxic comments in the stories have contrasting sentiments.
Five Least and Most Toxic Comments Associated With the Top 5 Polarizing Videos.

Note. The least toxic comments generally have sentiments such as empathy, intrigue, blessing, happiness, and so on, whereas the most toxic comments often contain profanity.
Toxicity Score Prediction
Next, we proceed to develop an ML model to predict the TPS for a given news story. We predict the TPS of the story content, assuming that the comments are disabled, relying solely on the content’s engagement statistics for prediction. This exercise matters, as online news media platforms are increasingly disabling the ability to comment to prevent inflammatory discussions for topics they deem controversial. In so doing, we aim to show that this content’s level of “polarizability” can still be determined, given that one has adequate meta-data.
We obtained several engagement features for each news story using the YouTube Analytics API with the channel owner’s permission. These features include: (a) number of views, (b) number of likes, (c) number of dislikes, (d) number of shares, (e) number of subscribers gained due to the video, (f) number of subscribers lost due to the video, (g) average duration of a view of the video, and (h) the percentage of the total duration of the video that was viewed. We also include the toxicity score of the content obtained using Perspective API: (i) toxicity score for the video description and (j) toxicity score for the video title. We use all these metadata as features in an ML model to predict the corresponding TPS that we have estimated. We use the Gradient Boosting Machine (GBM) regressor for the predictive model. We choose this non-linear tree-based model for three reasons: (1) it has been found to be competitive in practical data science challenges, (2) it is applied extensively in a variety of challenging ML problems, including bioinformatics (Mall et al., 2013), and (3) the model’s feature weights can be interpreted with a relative ease (explainability is an important characteristic of ML modeling).
As standard for ML experiments, we randomly divide our dataset of 2,545 videos into two parts: a training set (67% of total videos) and a test set (the remaining 33% of all videos). The training and test is a standard and robust ML approach for developing a well-tuned model and evaluating fairly based on unseen data. Holding out a substantial portion of the data (33% in this case) for testing ensures that the model is assessed on unseen data, a reliable indicator of how the model will perform on new, real-world data. This practice helps prevent overfitting, where the model performs well on training data but poorly on new, unseen data. Randomly dividing data helps maintain the overall data distribution in training and test sets. This random sampling ensures that both sets represent the comprehensive dataset, considering the possibility of underlying patterns or stratifications in the data. Allocating 67% of the data to the training set ensures enough data to train the model effectively, capturing the underlying data patterns and relationships necessary for accurate predictions. The remaining 33% allows for a test set large enough to give statistically significant results. It’s a balance ensuring that the model is still learning data, and the evaluation needs to be more optimistic due to a small sample size.
We perform a 5-fold cross-validation procedure on the training set to obtain the optimal model hyper-parameters. After this, we train the GBM model using these hyper-parameters on the training set and make predictions on the unseen test set. We find that the best GBM model achieves a mean absolute error of 0.07 on the test set. In other words, the model’s predictive accuracy is very good. Thus, we have a predictive model that can estimate the TPS for a news story whose comments are disabled, using only the story’s metadata features.
Interpreting the Polarization
To better understand why polarization takes or does not take place in a given video, we conduct two additional analyses: (a) variable importance analysis (Wei et al., 2015) of the predictive model and (b) manual evaluation of the most and least polarizing content (according to the TPS metric).
Variable Importance Analysis
Figure 5 shows the relative importance of each feature in the optimal GBM model. The features with the highest variable importance include (a) average duration of a view (averageViewDuration), (b) number of likes, (c) number of shares, and (d) percentage of the total duration of the video that was viewed (averageViewPercentage). The results show that the most engaging videos are also the most polarizing, as view duration, liking, and sharing are typically considered engagement metrics (Peters et al., 2013).

Feature importance analysis.
Manual Evaluation
For the manual evaluation, we randomly sampled 40 news stories from 150 stories with the highest TPS, and another 40 stories from 150 stories with the lowest TPS. One of the researchers conducted an open coding using the qualitative theme identification rooted on grounded theory procedure (Corbin & Strauss, 1990), which involved reading the material, identifying central themes, and combining themes when necessary, in order to address two analytical questions: (1) What are the central themes in the videos and their comments? (2) Why is there polarization in the material?
Our approach for manual evaluation is a strategic decision designed to ensure a comprehensive, unbiased, and in-depth qualitative analysis of the content and its sociological implications. Selecting 40 news stories each from the collections with the highest and lowest Toxicity Polarization Scores (TPS), ensures a balanced representation of both extremes in the dataset. Randomly sampling the stories from the top and bottom 150 ensures that the selection is unbiased and representative, eliminating any selection bias that might skew the analysis toward particular themes or topics. This randomness helps in capturing a wide variety of content and comment types, thereby providing a more holistic view of the discourse. The process of identifying central themes and combining them as necessary is a critical step in understanding the essence of the discourse. It helps in distilling vast amounts of data into identifiable patterns and categories that provide insight into the collective psyche of the commenters and the sociocultural dynamics at play.
Overall, the qualitative analysis of comments revealed 48 themes among the 80 news stories and their associated comments. Figure 6 shows the most common themes in polarized and non-polarized stories. The most distinctive themes for more polarized stories were Politics (n = 14, 13.8%), Donald Trump (n = 6, 9.2%), Entertainment (n = 5, 7.7%), and Sport (n = 5, 7.7%). It was surprising to see that entertainment and sports topics can become polarizing, but this tends to be the case when combined with another theme with controversial elements. For example, a story about Iran wanting to host the Asian Cup (theme = Sport) but not allowing women in the stadiums (theme = Citizen Rights) was seen as polarizing (TPS = 0.468). This can be taken as indicative of topics becoming “mixed,” and this mixing appears to cause more polarization.

Themes from the sampled polarized (a) and non-polarized (b) videos.
The most distinctive themes for less polarizing news stories were Informative (n = 13, 17.8%), Citizen Rights (n = 10, 13.7%), and Human Story (n = 9, 12.3%). “Informative” refers to stories that give fact-based explanations about a topic (e.g., “How Does The US Court System Work?”). “Citizen Rights” stories deal with topics such as fair pay, government spying, and privacy. On these matters, people seem to have a stronger collective disposition. The content under “Human story” features an individual person of interest, often conveying an emotional and/or inspiring message (e.g., “This 11-Year-Old is Keeping Homeless People Warm”). Such content can be powerful in mitigating polarization, even when the topic of the news story could otherwise be controversial. For example, the following news stories have a low TPS: “What It’s Like Policing While Black” (TPS = 0.018) and “Meet the DC Falafel Shop Helping Refugees” (TPS = 0.017). This suggests that when a topic such as racism or refugees has a human story aspect, it may become less polarizing.
Another interesting genre of news stories is “Solution to a Problem.” These stories give instructions or tips to specific audiences (“Young & Broke in SF? Budget Date at These Places”). These stories appear to be more neutral in sentiment and do not garner much toxicity polarization. Table 3 characterizes the nature of online polarization. For example, videos about the death of Freddie Gray (an African-American man who died after being arrested by the police) (rows 2–3 in Table 3) contain a clear distinction of reactions of aggression (toward either the victim or the police), and reactions offering condolences or expressing sadness. Similarly, the video about Australia rejecting asylum seekers (row 4 in Table 3) involves reactions attacking the government (or refugees) and those praising the decision. Overall, the distinct themes in content ranked as low and high polarization by the TPS lend qualitative support to the metric’s ability to distinguish between less and more polarizing social media content.
Examples of polarization.
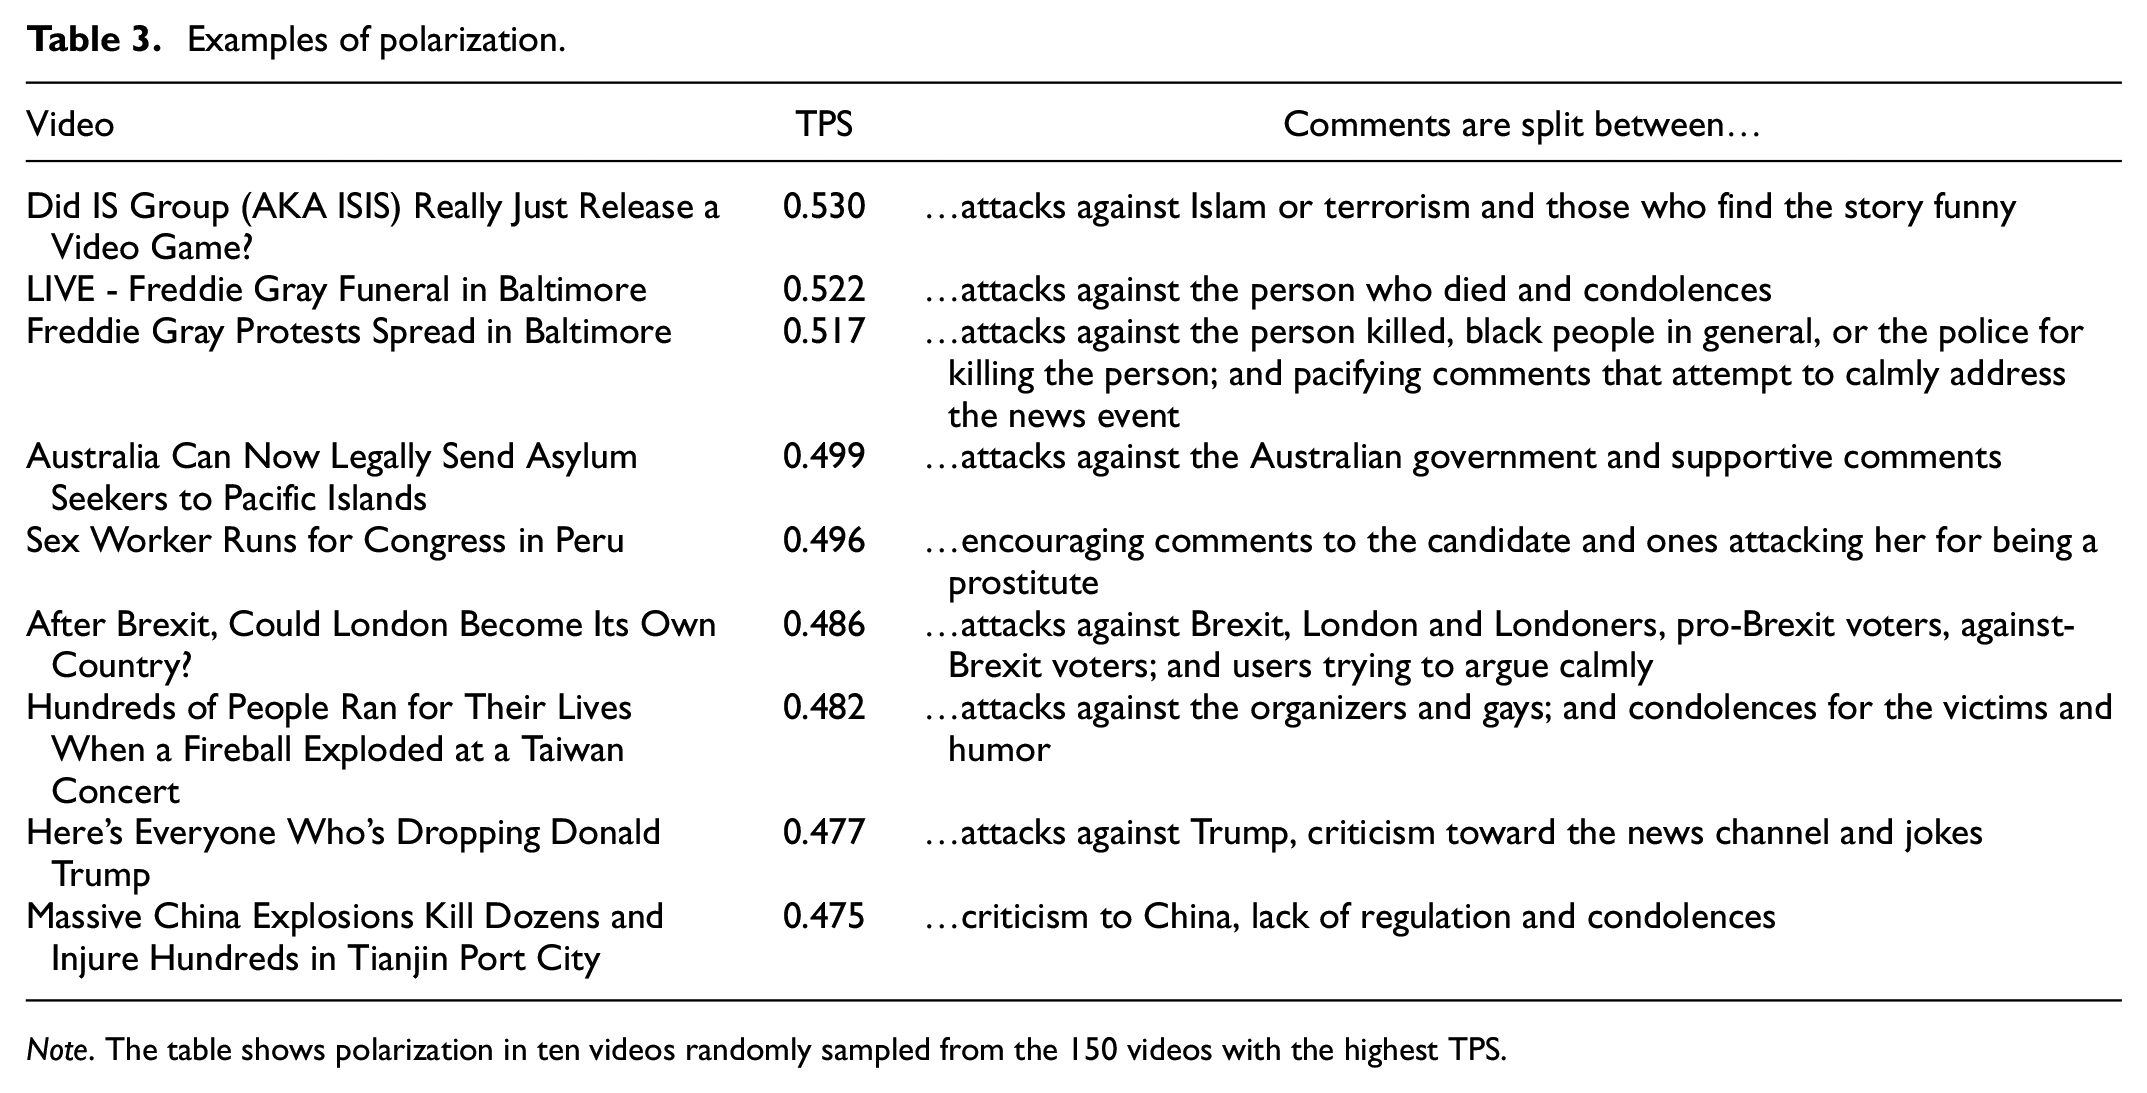
Note. The table shows polarization in ten videos randomly sampled from the 150 videos with the highest TPS.
The discrepancy between the number of polarized and non-polarized topics within the dataset reveals the underlying dynamics and biases in the comments discourse. This disproportion indicates several phenomena or conditions within the communication environment. The prevalence of some (a minority of the total) polarized topics suggests that participants are engaging in “echo chambers,” where individuals’ views are reinforced by the homogeneous opinions of their group, intensifying polarized stances. The platform’s moderation policies, community guidelines, or the absence thereof can significantly influence the number of polarized discussions. The nature of topics themselves can inherently incite polarization. Issues like politics, religion, or social reforms often involve personal beliefs and identities, leading to more heated, polarized discussions compared to neutral or universally accepted topics. External factors, including global events, political climates, or public sentiment, can also affect the degree of polarization in topics. During times of societal stress or political contention, polarization might increase.
Discussion
Research Contribution
Social and political polarization has been identified as one of the key issues in the digital media environment (Hiltunen, 2021). The polarizing effect of news media is a gripping challenge for many reasons, one of which is the eroding trust in news by those that consume it. For example, it has been observed that only around one-third of people (34%) in the United States trust news, and this decline in trust has been at least partially attributed to the “strong polarization of the media landscape” (Henke et al., 2020). While researchers have proposed various approaches for quantifying polarization in news and other online content (see a review by Garimella et al., 2017), the problem of effective polarization detection has not been resolved. Garimella et al. (2017) postulated that methodological contributions for polarization detection are in high demand due to the scale and scope of polarization occurring in online news content. For this goal of quantification, novel metrics and computational techniques provide clear advantages for a better isolation and analysis of the polarization taking place in society.
This research presented a novel metric for quantifying online polarization in news content. Unlike using graph data (Garimella et al., 2017), the TPS is compatible with contextual unstructured data, namely online news comments. This approach of using the distribution of toxicity score of user-generated comments has not been applied in previous research dealing with the polarization of online news stories. Our manual evaluation of the TPS’ validity, using a dataset of real comments from online news videos, provides support for the ecological validity of the approach in detecting online polarization in online news.
Looking specifically at the news context, our findings suggest that the most engaging videos are also the most polarizing, as view duration, liking, and sharing have the highest relative importance for our predictive model. This finding is associated with the clickbait logic, in that controversial content also brings more visibility (Ha et al., 2018). Thus, controversy can be seen as an efficient marketing tactic for online content. While previous research has postulated that some (unethical) news outlets may seek to benefit from political polarization driven by financial motives (Tandoc et al., 2019), our case organization is not counted among such unethical operators and is seen as a reputable international news organization.
Nonetheless, it is conceivable that even reputable news organizations can have built-in management mechanisms that inadvertently encourage writing content that polarizes audiences, such as “key performance indicators” that would reward highly engaging (but controversial) content. Given that attention in social media is exceedingly competitive, no news organization can be seen to be utterly immune to the danger of creating polarizing content in order to increase their number of impressions, clicks, and ad revenue, and this is aptly captured by Bodrunova et al. (2018) in their article titled “Please Follow Us.”
The opposite pulls from commercial organizations seeking profit and netizens’ desire for a less polarized online space present a complex and challenging dilemma. Reconciling these opposing forces is not straightforward and requires nuanced approaches. News outlets and social media platforms often benefit from polarizing content in terms of engagement and ad revenue, so they may be hesitant to reduce such content as it might impact their bottom line. However, news organizations also have a social responsibility to ensure that the content they promote does not contribute excessively to polarization and societal division.
One way to reconcile these opposing interests is through transparency and accountability. News organizations and social media platforms can be more transparent about their content algorithms, moderation policies, and the impact of polarization on society. They can also be held accountable through regulations and public pressure to promote more balanced responsible content. Social media platforms can make algorithmic adjustments to reduce the visibility of highly polarizing content. This could involve promoting content that encourages constructive dialog and fact-based discussions, rather than amplifying extreme or sensational viewpoints. Educating users about the potential pitfalls of consuming polarizing content can also help. Media literacy programs can teach individuals how to critically evaluate information, identify bias, and engage in civil discourse. There could be incentives provided to news organizations and content creators to produce more balanced and informative content rather than sensational or polarizing material. These incentives could come from a combination of regulatory measures and public demand for responsible journalism.
Concerning the realism of making social media entirely free of polarizing content, complete eradication of polarizing content may not be realistic or desirable. Freedom of speech and diverse viewpoints are essential aspects of democratic societies. However, the goal should be to mitigate extreme polarization and harmful content while preserving the healthy exchange of ideas and opinions. Achieving this balance requires ongoing efforts and collaboration across various stakeholders, as mentioned above.
The qualitative analysis suggests that different themes and story framing approaches drive polarization. While previous research has also discovered several conceptual themes behind online polarization (Chatzakou et al., 2017; Herring et al., 2002; Marres & Moats, 2015) (as listed in Table 1), we found evidence of a mixture effect, according to which a political element in a story can contaminate an otherwise neutral topic—for example, where sports becomes politicized through a discussion of human rights. This finding builds on previous studies on “topic-driven toxicity” (Salminen et al., 2020) that the toxicity of audience responses varies in relation to the news topic. Our study expands this line of inquiry by observing the role that the news topic plays in the polarized reactions of the audience. Along with politicization and polarization among media actors, news media’s role and possible countermeasures for mitigating group polarization merits further analysis.
Practical Implications for News and Media
On a broader scale, the methodological development in media studies has shifted toward computational journalism (Flew et al., 2012), that is, using algorithms and big data mining techniques to analyze news content and audience engagement and reactions. As stated by Schmidt et al. (2020, p. 1), “heated debate and polarization (…) play a pivotal role in online social dynamics.” Due to the rapidly expanding nature of online news stories, their manual tracking and analysis is not feasible or even possible in many cases. Therefore, our study demonstrates how computational techniques and machine learning (ML) can be used to facilitate journalistic research and media studies at scale.
Even though we used a YouTube news dataset in this research, the TPS applies to any dataset with (a) comments for specific online content and (b) toxicity scores for each comment. Obtaining toxicity scores is facilitated by publicly available services, such as Google’s Perspective API. We next discuss the implications for various stakeholder groups.
News organizations and journalists can adopt the TPS to better understand what content causes polarization among the audience. The relationship between audiences and the media is becoming more interactive and participatory (Deuze et al., 2007; Domingo et al., 2008), so the media themselves are seen as participants in the online debate. While engagement metrics like the number of likes inform about the quantity of audience engagement, metrics such as the TPS provide insights into the quality of conversations around news stories. Consequently, in their role of influencing online discussions, the media can benefit from these insights.
Social media platforms can apply the TPS to monitor the nature of conversations in their platforms, examining, for example, how polarization is related to the platform’s engagement and retention metrics. The TPS provides a way to understand user behavior around polarizing content. Our results also suggest that social media platforms face an ethical dilemma: If polarization is positively associated with engagement, which is positively associated with the platform’s monetization (Ha et al., 2018), then should the platform promote or mitigate polarization? While it is possible to remain neutral, a platform’s algorithms might inadvertently reward polarizing content, even when the platform would prefer not to amplify polarization. Future research could examine this trade-off.
Policy makers and social scientists can apply the TPS to increase their awareness of polarizing topics and carry out deeper analyses into the polarized camps of social media groups, in order to gather insights for policy making. Because polarization and associated controversies can shape civic behaviors such as voting, demonstrations, and public opinion, understanding polarization is crucial for its implications in the public domain.
Overall, the news media has a vested interest in creating safe online news environments that mitigate fear, mistrust, and seeking alternative news sources (Thorbjørnsrud & Figenschou, 2020). Polarization can have an instrumental effect in this regard, as a great degree of conflict is likely to hamper the user experience of online news readers. Being able to automatically detect content that induces these reactions from a large mass of global online news stories can result in many benefits, including monitoring social media controversies in real-time as they evolve.
Limitations and Future Research
Since our findings are based on data from one news channel, testing the approach using other datasets would be insightful to probe polarization in other channels and contexts. The TPS is applicable to any dataset, as it utilizes the distribution of comment toxicity as information, and is therefore agnostic to the specific domain. Using our formulations, other researchers should be able to replicate the method with their own datasets. Also, future studies could investigate the relationship between news topics and polarization more closely. While we provided a qualitative analysis in this regard, a more systematic quantitative analysis would be a valuable direction for future work. Moreover, while we identified that social media engagement metrics were influential predictors for polarization, it is also possible to investigate the reverse: does polarization predict news consumption? This question could be addressed via longitudinal analysis, such as the Granger causality applied by Kwak et al. (2018).
Interestingly, the TPS could be implemented in an intelligent journalistic system, that is, a tool that would help journalists track and monitor online news polarization. There is a general need for intelligent journalistic systems that facilitate sense-making and insights into audience behavior and reactions, so further development in this direction would be worthwhile.
Finally, future research is needed to compare the TPS with other toxicity classification approaches, including the use of other natural language approaches. Unfortunately, comparing work in this field is challenging for three primary reasons: (a) there is no universally accepted definition of polarization; (b) the statistical approaches of polarization detection differ greatly by study; and (c) there are no validated baseline datasets for polarization detection, as far as we know. These general shortcomings require the attention of the research community, specifically for developing publicly available baseline datasets with “ground truth” labels, to enhance research on computational journalism and media studies. However, making resources such as content and comment datasets publicly available is challenging because online news organizations might consider these datasets to be too business-sensitive for wider circulation.
Conclusion
Using the distribution of toxicity in users’ responses to online news content, the Online Polarization Score was proposed for quantifying polarized audience reactions. A qualitative analysis supports the score’s ability to detect polarizing news content drawn from a large YouTube news channel. A feature analysis indicates that higher social media engagement is associated with a higher degree of polarization, thus making it possible to detect likely polarizing news content based on the content’s meta-data. Future work is needed to deploy the score in information systems that mitigate polarization.
Footnotes
Declaration of Conflicting Interests
The author(s) declared no potential conflicts of interest with respect to the research, authorship, and/or publication of this article.
Funding
The author(s) received no financial support for the research, authorship, and/or publication of this article.
Ethical Approval
Not applicable.
Data Availability Statement
Data sharing not applicable to this article as no datasets were generated or analyzed during the current study.