
Abstract
Time to degree completion is an important metric of academic progress and success for doctoral students. It is also a common way for educational stakeholders to compare programs even if the content of the degree programs varies. But what types of behaviors and experiences are associated with faster times to degree? In this study, we examine the relationship between receiving competitive research awards (e.g., grant writing) and time to degree for PhD students. We organize our analyses by student identities, specifically gender and underrepresented racial minority (URM) status, to examine differences in time to degree based on student demographics. Our dataset included students that graduated between academic years 2008 to 2009 through 2018 to 2019. We also interviewed students currently enrolled in these same programs. We find that underrepresented minority women who won competitive research awards graduate faster than all other students who also won awards but also report lower levels of advisor support. Underrepresented minority women and all underrepresented minority students who won research awards tended to graduate faster compared to other groups of students who did not win awards. Students who reported feeling supported by their advisors, most of which reflected hands-on guidance through the writing process, in the interviews were more likely to apply for grants. Combined, these results highlight that writing grants and specific types of advisor support may influence faster times to degree for biosciences PhD students. This study suggests similar introspective analyses at other institutions and databases are needed.
Introduction and Background
Writing is, in some ways, the most essential skill that students develop and fine tune during their time in PhD programs. Scientific communication is strongly linked to academic success including research career persistence (Cameron et al., 2020). Although most of the attention on academic writing is centered on publications and presentations, grant writing is important for doctoral students because it provides them an opportunity to demonstrate their ability to think and act like a scientist by developing an original research project (Files et al., 2020). And because a successful career in science, especially the biosciences, is so dependent on one’s ability to secure external funding, grants are a critical academic currency. Aside from the financial benefits of securing grants, grant writing builds skills like critical thinking and strategies for communicating scientific ideas (Kahn et al., 2016; Quitadamo & Kurtz, 2007). Grant writing is also essential for advancement at the faculty level and securing grants improves one’s chances of advancing to tenure (Bloch et al., 2014; Ransdell et al., 2021; Smith et al., 2017; Thorpe et al., 2020). While the links between faculty career success and grant writing is evident, the relationship between PhD student success and grant writing is less understood. The ways that PhD advisors support their students and whether or not they correlate with positive grant writing outcomes are also not well documented.
There are many different markers for success as a PhD student, but degree completion is a significant one (de Valero, 2001). The time it takes to complete a degree can relate to delayed career earnings, use of institutional resources, and differing amounts of student debt (e.g., accrued interest on student loans). In this way, a student’s time to degree, measured by the number of active graduate quarters (or semesters) until PhD conferral, is a significant commitment for students as they develop professionally and is also important to the institutions that support them. It is also a metric used by doctorate granting universities to compare outcomes (Blank et al., 2017). Other studies have considered factors like marital status, race, gender, academic performance (undergrad GPA and GRE scores) on time to degree and other measures of academic accomplishment (Akabas & Brass, 2019; Feldon et al., 2017; Mendoza-Sanchez et al., 2022; Petersen et al., 2018; Price, 2006), but the relationship between advanced academic tasks like grant writing and time to degree is less understood. Therefore, if faculty success is strongly associated with winning grants, how might winning grants be associated with PhD student success in terms of time to degree? Some data indicates that submitting or receiving external funding impacts time to degree (Ehrenberg & Mavros, 1995) but no formal data has yet been collected or analyzed to support this specifically for the biosciences. To bridge this gap, this study assessed the impact of external funding on time to degree for doctoral students studying the biosciences at Stanford University and which types of advisor support helps students secure external funding once they are enrolled.
Doctoral experiences, like all social experiences, are shaped by one’s personal identity in ways that reflect patterns of inequity in science, technology, engineering and mathematics (STEM) (Bernard & Cooperdock, 2018; Chaudhary & Berhe, 2020; Committee on Effective Mentoring in STEMM, Board on Higher Education and Workforce, Policy and Global Affairs, & National Academies of Sciences, Engineering, and Medicine, 2019; Master & Meltzoff, 2020; McCoy et al., 2017; Palmer et al., 2011). Student diversity based on race and gender is important for inclusion and representation, but determining factors associated with their success is also important. In some cases, student diversity and identity have been sources of intellectual innovation despite these same students receiving less recognition (Hofstra et al., 2020). Other studies have observed that STEM students from minoritized backgrounds are also less likely to feel senses of belonging in ways that are associated with positive academic outcomes (Walton et al., 2012; Walton & Cohen, 2007, 2011) and negative mental health symptoms (Sargent et al., 2002; Strayhorn, 2018). Given the stakes and prior research, our paper weaves these different threads together using longitudinal and interview data to answer questions about the relationship between securing external funding and time to degree while also tending to whether student identities are salient in these relationships. Our paper answers the following questions about the nature of the relationship between time to degree, student identity, and winning competitive grants and fellowships:
What is the relationship between time to degree and winning competitive awards for students in the biosciences?
What are the ways students feel supported by their advisors (or not) in the grant writing process? Are there specific sets of behaviors associated with feelings of support as well as success in the grant writing process?
Does the level of advisor support vary along dimensions of student identity, specifically race and gender?
Materials and Methods
Our data come from Stanford University biosciences PhD programs in two forms: longitudinal data from an internal database and from interview and survey data. The data include information about the student’s gender, specific program, citizenship status, and time to degree. To ensure participant anonymity, we do not provide a full breakdown of the interview participants. To study the relationships between time to degree and funding acquisition, we considered the students’ gender and URM status. We defined URM using federal categories mandated by the Department of Education; this is also how large organizations like NIH define URM status. The URM category includes students who are US citizens or permanent residents and who self-identify as American Indian/Alaska Native, Black/African American, Hispanic/Latino, or Native Hawaiian/Other Pacific Islander. The category includes any student who affiliates, with any one of these categories, regardless of whether they also affiliate with other categories (i.e., affiliating as “White” and “Black/African American” yields a URM designation). These same criteria were used in the survey and interview data to determine URM status. We excluded students who transferred into the program or discontinued before graduating (n = 12). Medical Scientist Training Program (MSTP) students were not included in our analyses. We used Stanford’s Student Integrated Reporting and Information System (SIRIS) to query official university enrollment records related to time-to-degree and student demographics.
Longitudinal Quantitative Data
Our quantitative data about student grant successes were pulled from several data sources, queried in September 2022. We leveraged the Stanford Electronic Research Administration System (SeRA), a database which tracks external proposals, such as fellowships or grants, submitted and awarded to grant seekers at Stanford (including doctoral students); see Botham et al., 2020 for more information about the database. We also considered other fellowships that are not tracked by SeRA but are popular among students at Stanford (e.g., National Sciences Foundation (NSF) Graduate Research Fellowship, Ford Fellowship, Soros Fellowship, National Defense Sciences and Engineering Graduate (NDSEG) Fellowship). The publicly available NSF Graduate Research Fellowship Program (GRFP) Award Offers and Honorable Mentions List (see https://www.research.gov/grfp/) provided names of graduate students that won the NSF GRFP Award and Honorable Mentions status. The Ford Foundation Predoctoral Fellowship also posts the names of recipients (see Ford Fellows directory). Fellowships not based directly on research (Soros Fellowship) and with limited publicly available information (NDSEG Fellowship) were excluded. We provide this additional detail to encourage other researchers interested in replicating this study. Funding sources included the National Institutes of Health (NIH), the Howard Hughes Medical Institute, and more specialized sources such as the American Brain Tumor Association. We do not know how many of the students in our sample applied to the NSF GRFP, but 140 students applied for external funding and of those students 59 won awards (data not shown). See Table 1 for a breakdown of the longitudinal data.
Overview of Data.

NSF.
SeRA.
SIRIS.
Two students won multiple awards, hence the total number of awards being 93 for 91 students.
We use two statistical tests to compare average times to degree between different groups of students. First, we used Welch’s t-test to compare group means while accounting for different group sizes. Second, we used Cohen’s d, an effect size metric used often in education research (Allington et al., 2023; Kumari & Kumar, 2023). The outcome of interest that we compared is the elapsed time to degree measured in years. We grouped the students by URM status, gender, and the intersections of URM status and gender. Although we tested many different groups, we only present the results that were statistically significant with the t-testing (i.e., p < .05). We indicated in figures and the text statistical significance with one asterisk indicating p-values below .05; two asterisks for p-values below .01; and three asterisks for p-values below .001. We also follow well established conventions when describing the effect sizes and present effect sizes that were not null (i.e., 95% confidence interval does not include 0). To interpret the size of the effect, we refer to Cohen’s original suggestions where an effect size of 0.2 is small, 0.5 is medium, and 0.8 and above is large (Cohen, 2013). To prevent potential false discovery across the many comparisons within our data, we exclude any effect sizes that are below 0.5 (medium). We also filter out results that are not at least medium with respect to Cohen’s d and statistically significant according to the t-tests. Combining both allows for our analysis to go beyond p-values and think about effect sizes for more robust analysis and interpretation (Sullivan & Feinn, 2012). We present the strongest results and comparisons that passed multple tests of significance and encourage other institutions to look at their own data.
Qualitative Data
We draw qualitative data from a screener survey and interviews of doctoral students currently enrolled in the same biosciences programs. A recruitment email with a screener survey was sent to all biosciences PhD students at Stanford who were enrolled in at least their third year (n = 238). The screener survey had a response rate of 8.4% with 20 responses. The survey asked basic questions about grant writing experience including: Did you apply for external funding (grants, fellowships, other funded awards) during years 1 to 3 of your program? (y/n); What did you apply for and at what stage in your program did you apply?; Did you receive any of the funding opportunities you applied for? If so, which ones?; Did you have industry experience before applying to your program?; How did your career choice (career plans) influence your decision to not apply for grants? The survey was used to ensure diversity of grant writing experience amongst interview participants (e.g., students who had/hadn’t applied to grants and who had/hadn’t received funding). The survey asked for basic demographic information including race/ethnicity, gender, and the option to include any other identities that were important to them.
To maintain anonymity of participants, we do not specify which awards they applied for and/or won. After recruitment and screening, we completed 17 semi-structured interviews during the summer of 2022. From our interview pool, 76% applied for grants; 58% received grants; 24% were URM; and 18% were male. The qualitative data will allow us to answer our questions about factors associated with successful grant writing and which students are feeling supported.
Interviews included two separate protocols for the two populations: those who applied and those who did not. Interviews with students who applied included the following questions: What led you to apply for that funding opportunity? Can you tell me more about your experience in navigating the application process? Can you tell me about any sources of support or mentorship that were particularly helpful in this process? Were there other opportunities that you wanted to apply for but decided not to? If so, what were they and what went into your decision not to apply? The interviews with students who did not apply included the following questions: In your screener survey, I saw you did not apply to any external funding opportunities. I’d like to hear more about your experience and how you went about navigating your decision not to apply. Were there any influential factors that went in your decision not to apply? Did you have any support or resources available to you when you were making the decision? What could have been helpful for you in applying? What kind of support or resources could help you apply?
The semi-structured interviews were transcribed and then analyzed using an inductive framework. After transcribing the interviews, we conducted a six-step thematic analysis (Braun & Clarke, 2006) to understand how student support could lead to positive grant writing experiences. The first stage of analysis included reading through the transcripts several times in order to become familiar with the data. During this initial stage, we also noted things of interest that could potentially become themes at later stages. The second stage included creating codes for the data, these codes captured recurring concepts from the interviews such as degree goals, degree progress, field of study, specialized area, relationships, support, mentorship, identity, motivation, and feelings. Next we began to generate themes that would help us understand more about our research question which was why graduate students applied or did not apply to grants. These themes became three major cluster areas: support (recurring examples included support from: family, peers, department, programmatic, mentor) obstacles (recurring examples including lack of: writing support, psychological safety, resources, emotional support, interest) and miscleaneous (themes that didn’t seem lead to a decision either way). The next step was to refine the themes which we decided would just be the two larger themes of support and obstacles. We then reviewed the data from these themes to decide if we wanted to expand or refine the themes. Since our data became clear, we decided to stick with the two overarching themes of the data which were support and obstacles. The final step was to analyze the data to produce a report of what was found. In this step, the strongest examples of support and obstacles came from the type of iterative support that grant writing students received. It became clear that this was the most critical resource for students, as those who did not have this support from their mentors did not apply.
Pairing the quantitative and qualitative analyses gives us a more holistic perspective on the relationship between grant writing and time to degree among biosciences PhD students. Though we do not make any claims to generality or causality, we aim to encourage researchers at other institutions to investigate their own data and adapt a similar mixed methods approach to also capture the multiple perspectives we share here. Further, if a nationally representative dataset were to be created to explore factors affecting time to degree, such as grant writing, we would encourage investigation into such data using our approach but also standard tools for causal inference.
Results
Quantitative Results: Longitudinal Data
Among all students in the longitudinal dataset, the average time to degree was 5.86 years; the median time was 5.80 years; and the range was 3.0 to 11.5 years. See Figure 1 for a density plot of the years to degree. Although the range is wide, 68% of the PhD students in our data completed their programs in six or fewer years, similar to (though higher than) a national study of biosciences PhD students that reported 49% of students complete their degrees in 6 or fewer years (Ostriker et al., 2010). Next, we compared average times to degrees for different groups of students with respect to their identity. The first two analyses do not include the four Ford Predoctoral Fellowship winners in the “winner” groupings. The Ford Predoctoral winners had a higher average time to degree than other students (6.80 years) and, unlike the other funding programs considered, the program specifically targets underrepresented minorities in academia.

Density plot for years to degree, including the mean time to degree (5.86 years). The median time to degree (5.80 years) is not included to make the figure easier to interpret.
Our initial comparisons were based on student gender, using sex as a surrogate, or URM status. In our data, students could only select Male or Female. To be inclusive and accurately represent the distinction between sex and gender, future studies might consider non-binary students, but this is a limitation of our statistical analysis on student gender. None of the comparisons we tested based on student gender and winning grants were statistically significantly different. For example, there was no significant difference between women who won grants compared to women who did not (5.90 and 5.84 years on average respectively; data not shown), nor was there a difference between men who won grants and women who won grants (5.71 and 5.90 years on average respectively; data not shown).
This was not the case for student URM status, however. URM students who won grants graduate on average 0.53 years faster than non-URM students who also won grants (Figure 2A). And although gender in isolation was not strongly associated with faster or slower degree completion times, the intersection of URM status and gender did show a strong association. URM women who won grants graduate significantly faster than URM women who did not receive grants (5.15 and 6.00 years median respectively, p = .00008). Figure 2B shows a boxplot in which the fastest quartile of URM women who did not win grants graduated at around the same time as the slowest quartile among URM women who won grants. This result is also noteworthy when compared to average time to degree (5.86 years; Figure 1) for all the students in the dataset.
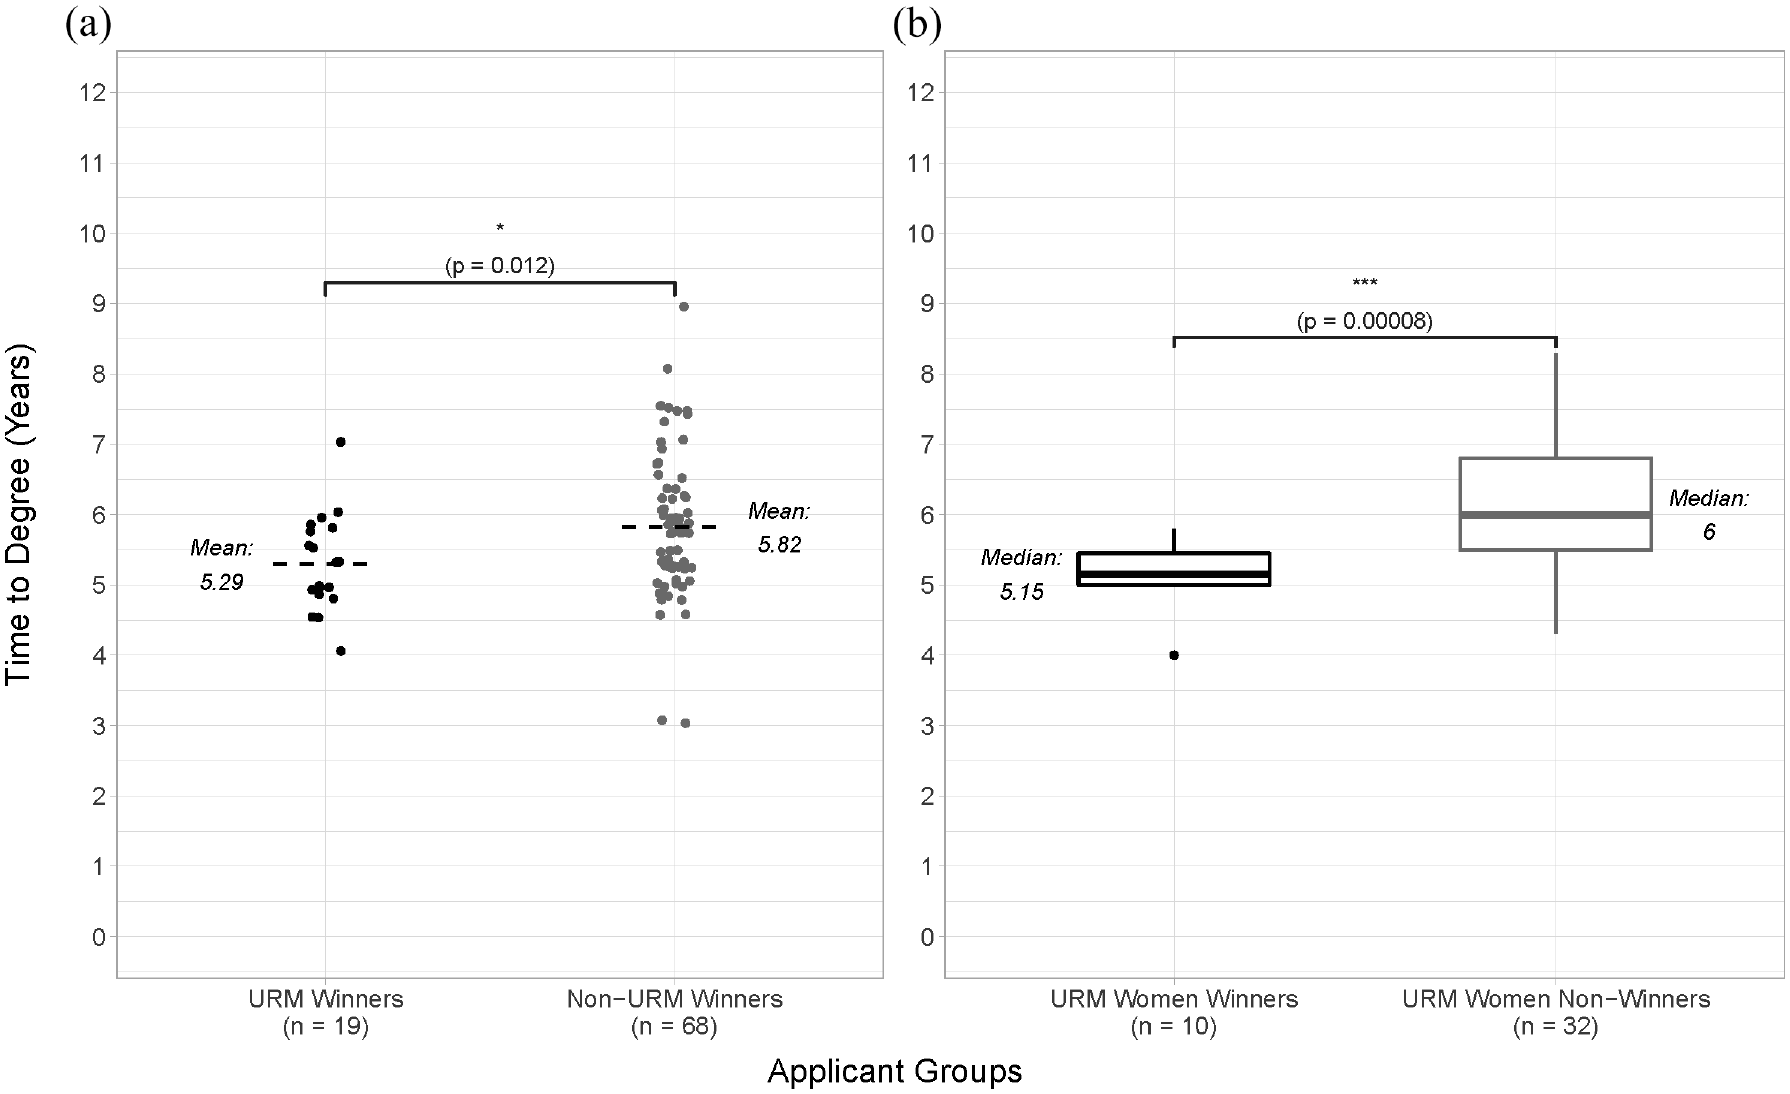
(a) URM students who won grants (black dots) graduated faster than non-URM students who won grants (gray dots). The mean time to degree for each group is indicated by the dashed lines and the p-value is indicated by the asterisk at the top of the figure (p < .05) and (b) boxplot showing that URM women who win grants (black) graduate nearly 1 year faster on average than URM women who do not win grants (gray). The p-value is indicated by the asterisk at the top of the figure (p < .001).
We find URM winners graduated a full academic year (0.74 calendar years or about 9 months) faster on average than URM non-winners (Figure 3). The time to degree for the Ford Fellows ran counter to the other trends we found by taking an average of 6.80 years to complete their PhD. This was also on average 0.77 years (a full academic year) longer than URM non-winners and 1.51 years (more than two academic years) longer than URM winners (Figure 3). In our data set, the four students who won the Ford Fellowship did not also win NSF or SeRA-tracked funding. We included them within the URM non- winner group (see dark gray triangles) given the unique expectations for the Ford Fellowship on “sustained personal engagement with communities that are underrepresented in the academy” (Ford Foundation Predoctoral Fellowship Fact Sheet 2023). Results show a strong relationship with time to degree and winning competitive awards but in the opposite direction for the Ford Fellowship: longer as opposed to shorter average times to degree. A significant aspect to participation in the Ford programs is service and volunteering, and the longer time to degree for these students might reflect the realities of trying to balance the work of advancing in a doctoral program with competing service goals. Although the Ford Foundation is ending their doctoral fellowship programs, this finding highlights that the relation between time to degree and winning competitive awards might not be purely transactional but also dependent on the nature and expectations that come attached to the funding.

URM students who won grants (left) graduated faster than URM students who did not win grants (right). The Ford Fellowship winners (triangles) did not also win NSF or SeRA-tracked funding, were included within the URM non-winner group. The mean time to degree for each group is indicated by the dashed lines and the p-value is indicated by the asterisk at the top of the figure (p < .001).
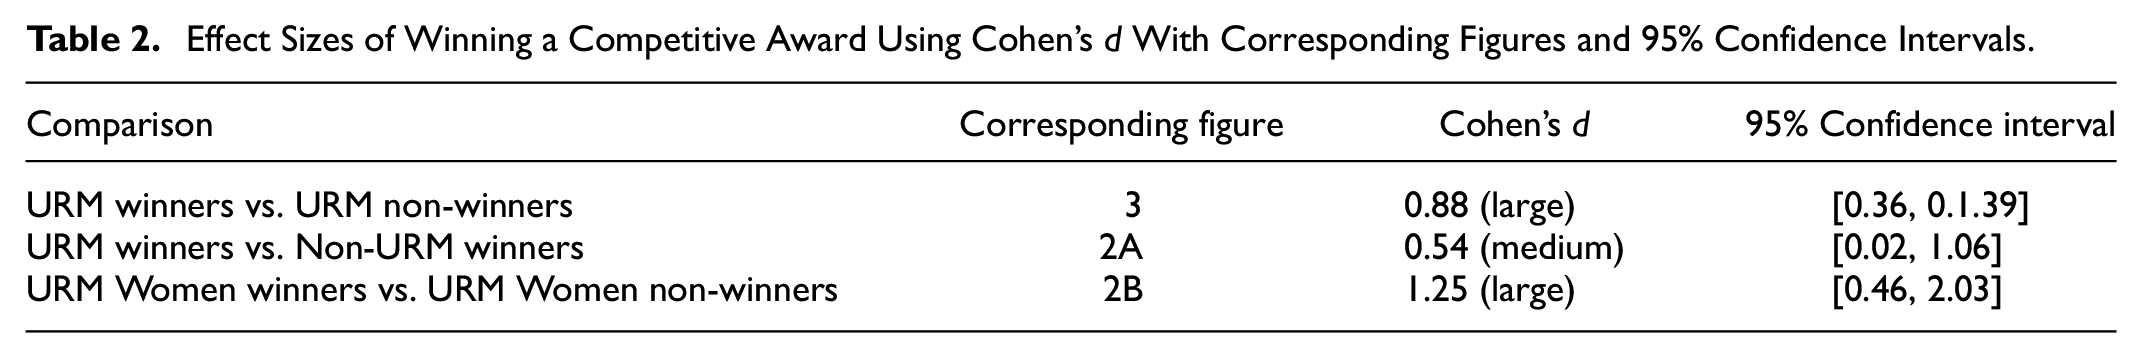
The effect sizes of winning grants ranged from medium to large (using Cohen’s d). See Table 2 for a breakdown of the analyses and results with respect to winning grants. The largest effect was seen in the comparison between URM women who won awards and URM women who did not (1.25), once again highlighting that the relationship between time to degree and winning awards has a strong intersectional component, though in this case URM status (the second largest effect size, 0.88) is also an important dimension. Comparing URM and non-URM students yielded a medium effect size, suggesting that the stronger effects might be concentrated among just URM students.
Effect Sizes of Winning a Competitive Award Using Cohen’s d With Corresponding Figures and 95% Confidence Intervals.
In the following section, we describe the results from our analysis of survey and interview data collected from current biosciences PhD students.
Qualitative Results: Survey and Interviews
We present the results for the qualitative analysis in two ways: proportions of responses to certain types of questions and with excerpts highlighting both broad themes and specific nuances in student experiences. Presenting the findings in this way will allow us to understand students’ decision-making processes with whether they apply for grants as well as ways they feel supported or not. “Support from advisors and mentors” was a key theme that emerged across the interviews, something we incorporate into the presentation of our results. Finally, because of identification risk and some of the interview participants representing very small populations, we limit the amount of detail we can share about the participants.
Among the 17 students interviewed, those who report having a more supportive advisor were more likely to apply for external funding (92%) than students who did not have supportive advisors (40%). See Figure 4 for a visualization of these disparities. All four URM women in the sample reported limits with the amount of support they received from advisors when it came to applying for awards; this was only the case for 14% of the rest of the sample who were not URM women. In fact, the only URM woman who applied and won an award participated in a supplemental mentorship program specifically designed to support URM students which she reported as an alternative source of support during her grant writing process. It should be noted that all the participants experienced the Covid-19 lockdowns early in their doctoral studies, yet 71% of the participants still reported having supportive advisors and the majority of the 29% who did not were URM women. Descriptively, these statistics indicate disparities in the quality of mentorship among biosciences doctoral students that are strongly correlated with whether or not they apply and eventually win competitive awards and funding. Given our longitudinal findings that URM women who secure awards graduate nearly a year faster than URM women who do not receive awards, it becomes something of concern if, as the interview data suggest, URM women are not receiving the same type of supportive mentorship that their peers receive which discourages them from applying.

Students who did not have supportive mentors (left column) were less likely to apply for grants and other awards (top row). Students who identified as URM (stars) were less likely to have supportive advisors than other students (rings). 1: Had grant writing support outside of advisor. 2: Part of marginalized identity group not relating to race/ethnicity. 3: Student reported being unable to find relevant funding opportunities.
In the interviews, the participants went into fine detail about how they understood and defined “support” in the context of grant writing as well as pointed to its crucial role in their academic successes. Table 3 presents examples of students describing the exact ways they were supported in grant writing and how they connect this support to the entire grant writing process. What became clear in the interviews is that students felt supported when advisors gave them direct, concrete feedback and attention.
Excerpts of Students Describing How They Feel Supported.
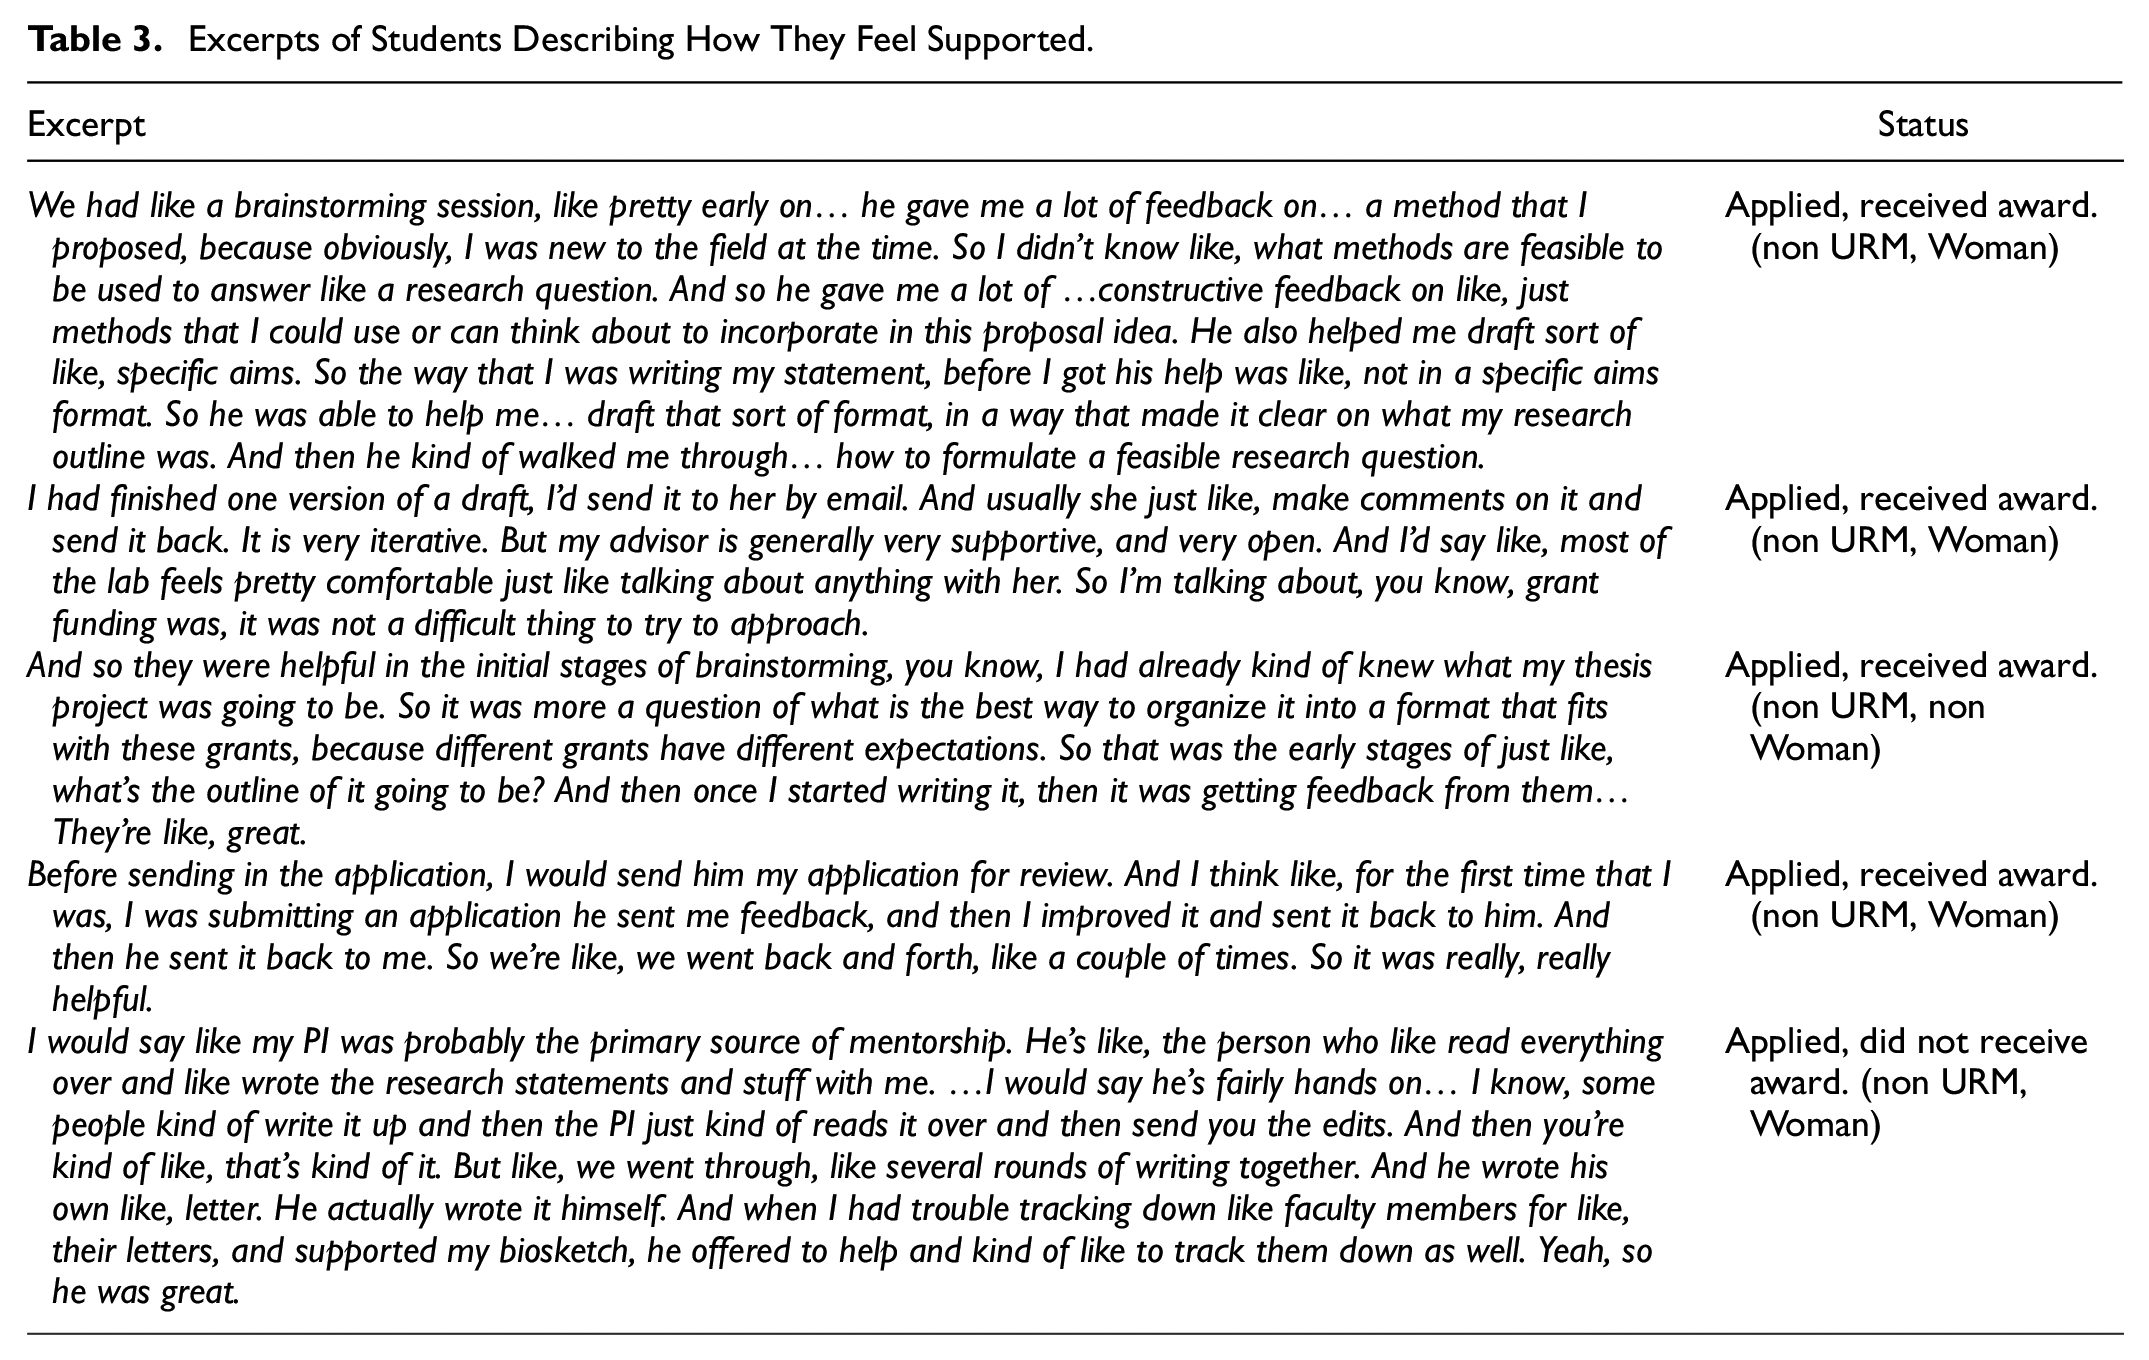
For example, students describe “iterative” processes where they go back and forth with advisors at the “initial stages of brainstorming” all the way through going “back and forth” leading up to a submission. Even a student who ultimately did not win reported a similar intensive, iterative experience with their advisor. Collectively, these types of responses are examples of when doctoral students in the biosciences feel supported when their advisors are giving them sustained feedback and attention as they work through the grant writing process. In all of their answers, repetition and rewriting were also clear themes, pointing to another potentially positive way that advisors support their students with grant writing: encouraging revision and persistence. These students also had a higher likelihood of winning grants in the sample and were less likely to identify as URM. The clear examples and descriptions of support and their positive association with applying and winning awards contrast with students who felt less supported in their grant writing (see Table 4).
Excerpts of Students Describing How They Do Not Feel Supported.

Where the supported students describe the benefits of having an advisor who provides hands-on guidance, the students who did not feel supported noted how this was explicitly missing in their doctoral experiences. This includes instances where students reported being in a “big lab” and unable to find direct support from their PI to feeling actively discouraged due to their PI “not liking” them to the point of “unconsciously sabotaging” them. While we do not make any claims about the quality of mentorship nor the veracity of these claims, these quotes nevertheless highlight how feeling unsupported is a powerful influence of both perception and experience in doctoral education. Students also described not knowing where or how to even begin the process of writing a grant, “psyching” themselves out of beginning, and their PIs not alerting them to any relevant opportunities. Unsurprisingly, these students were also less likely to even apply for grants so much as win them. This, coupled with the fact that most of these students identified as either URM, women, or URM women points to a unique form of educational inequality to investigate further. Given that students identifying as URM women completed their PhD significantly faster when they also win research awards further justifies other institutions looking into their own data.
Discussion and Future Directions
We report on lessons learned from our longitudinal case study using 10 years of quantitative data and recent interview data. Using statistical (t-tests and Cohen’s d) and qualitative methods (thematic analysis), we found that faster times to degree are associated with winning competitive grants for specific groups of students, including URM students and URM women. Specifically, URM students who won research awards graduated faster than non-URM students who also won research awards. Likewise, we found that URM winners graduated faster than URM non-winners. When it comes to winning competitive research awards, the stakes are higher for URM women: when they won, they graduated almost a year faster (see Figure 2B). In the qualitative analysis, we found that currently enrolled students who identify as URM and/or women described feeling less supported in their grant writing. Conversely, students who described feelings of support were more likely to apply and win grants but also not identify as URM. Our case study points to important trends in graduate training at our study site (Stanford University) but also highlights the need for a cross-institutional study to see if these patterns are unique or pervasive.
While we do not make any causal claims about the relationship between winning competitive awards and time to degree, there are nevertheless important implications to consider for doctoral students in the biosciences. For URM and URM women students, the strength of the relationship between time to degree and awards as well as feelings of less advisor support necessitates further investigations to determine causality. It is possible that winning competitive awards serves as a strong validation of the research goals and interests, and scientific identity (Committee on Effective Mentoring in STEMM, Board on Higher Education and Workforce, Policy and Global Affairs, & National Academies of Sciences, Engineering, and Medicine, 2019) for URM and URM women, which was shown to directly influence persistence in the sciences (Estrada et al., 2011). Furthermore, the hands-on support, such as iterative feedback during the grant writing process, may also validate scientific identify and shorten time to degree. However, the trend with the Ford winners shows that service and community engagement might delay times to degree. This delay is consistent with a common and well-studied phenomena often referred to as a cultural tax, minority tax, or invisible labor. This tax, while valuable to institutions, negatively impacts academic progress for individuals from marginalized identity groups (Cleveland et al., 2018; Padilla, 1994; Reid, 2021; Rodríguez et al., 2015). Likewise, other studies have suggested that racialized and gendered minorities seeking grants tend to propose research projects which directly address public health and community needs, topics which are less likely to get funding (Kolev et al., 2019). Future studies are needed to draw conclusive and generalizable results in order to tie such findings to ours.
Since many students are never formally trained in how to write proposals despite the practical benefits (Kulage et al., 2020; Mackert et al., 2017; von Hippel & von Hippel, 2015), these results point to practical ways to streamline the student experience by providing grant writing training (Botham et al., 2020). Doing so could have practical benefits, such as reducing time to degree. Because obtaining a first grant is associated with successfully acquiring future grants, an example of an academic Matthew effect (Bol et al., 2018), it would be interesting to investigate if grant writing successes as a graduate student correlate with future successes at the faculty stage. Future studies could take a deeper dive into these relationships and even analyze the types of grants that students are writing and submitting. Other follow-up studies may include tracking students who win competitive awards beyond their PhD to see if there is variation in career outcomes and filter the data and analysis by URM status and gender. The statistical and computational tools we utilized could be adapted for these analyses and help departments and institutions reconsider how they measure success and identify who benefits most from specific interventions.
While future studies could compare our findings with data from other university contexts, it is still the case that grant writing as an activity for graduate students does not come without costs. Specifically, time spent on grant writing is time not spent on other things, such as research, coursework, and even down time from the typical duties of students in graduate school. Faster time to degree is an important cost-saving consideration for universities, but focusing on the effects of the students could yield fruitful insights that could inform policy, practice, and future studies of this topic.
The multiple methods approach which guided our analysis could also be used to compare the patterns in our dataset with other data across systems and organizations to improve educational outcomes and programing. These analyses could extend other educational practices and research experiences that have positive relationships between specific graduate experiences and career trajectories (Brazas & Ouellette, 2016). Beyond comparing data and patterns within them, future studies could also create interactive data dashboards to disseminate broadly. The potential use of these findings outside of purely academic research shows one way that researchers across titles and departments could participate in institutional analysis and improvement. For example, this work could become integral to other activities intended to improve educational experiences and outcomes for computational bioscientists (Attwood et al., 2015; Gurwitz et al., 2020). If the patterns we describe in our dataset mirror patterns at other schools, these findings could be important information that the entire discipline should consider and address (Blank et al., 2017). Such work would be of interest to other researchers but also to other educational stakeholders.
Conclusion and Limitations
Considering the professional benefits of grant writing and our analysis showing its relationship with time to degree, we encourage URM and especially URM women to pursue competitive research awards. Of course, grant writing entails not just the act of writing a proposal but the entire process of designing a project and executing a research plan. Thus, grant writing is an important skill to develop earlier rather than later. Advisors should encourage their students to write grants as well as provide supportive, iterative feedback throughout that experience. In addition, it is important to ensure PhD advisors utilize effective research mentoring strategies, especially as their students are writing grants. For example, the Center for the Improvement of Mentored Experiences in Research has developed curricula specifically to accomplish this and has had some success (Handelsman & Handelsman, 2005). Advisors need to be informed about the impact grant writing (and potentially other skills often deemed as “peripheral” for biosciences PhD students) may have on time to degree in order to provide advisee-specific advice that will advance their training and development into an independent and successful scientist.
As we previously noted, we are only able to make specified claims and arguments with respect to the one university. While this does limit the generalizability of our claims, we do hope this serves as a reference point for future work. For example, if a similar case study were conducted at another university (or multiple universities) with similar prestige, then a national study could be conducted at all elite institutions with biosciences PhD programs. Alternatively, if this trend were to also emerge in less elite universities, then the scale of these issues would warrant a national study. While our paper on its own cannot definitively show what is happening at other schools and the role of grant writing with time to degree, we do believe these results can help start important conversations about graduate training.
Footnotes
Acknowledgements
Not applicable.
Authors Contributions
AA, CP, and AM did the analysis. AA created the framing, design, and did the analysis and coding. LL led the collection of data used for qualitative analysis. CP coded and analyzed the qualitative data. CBB gathered the internal administrative data. LS and SE contributed holistic feedback and revisions to the paper. CMB oversaw each component of the paper and provided general methodological and theoretical frameworks. All authors contributed to revising and approving the final manuscript.
Declaration of Conflicting Interests
The author(s) declared no potential conflicts of interest with respect to the research, authorship, and/or publication of this article.
Funding
The author(s) received no financial support for the research, authorship, and/or publication of this article.
Informed Consent
We followed institutional IRB guidelines for our survey and interview study (IRB #65653).
Data Availability
An anonymized version of the data is available upon request to the corresponding authors.