
Abstract
Mobile device usage in online surveys has steadily increased in recent years. As mobile devices differ, for example, in their handling, from computers, device effects within online surveys are found for several data quality indicators. However, results concerning these device effects are neither comprehensive nor conclusive because existing research are often based on non-optimized designs or do not account for the type of mobile device, for example, smartphone or tablet. This study uses data from the emigrant sample of the German Emigration and Remigration Panel Study (GERPS) a probability-based online survey (n = 4,888)—which made use of a mobile-optimized design—to compare data quality between smartphone, tablet, and computer respondents. Propensity score weighting was employed to account for device choice selectivity effects. The data quality indicators showed mixed results and smaller data quality differences across computers, smartphones, and tablets compared to previous studies. Higher dropout rates on mobile devices and here especially on smartphones remain the major challenge for survey participation, especially on small screens. However, our results render mixed-device data collection via mobile-optimized online surveys as a promising data collection approach, especially for exploiting the large response potentially associated with smartphone and tablet respondents.
Plain Language Summary
More people are using mobile devices for online surveys nowadays. Since mobile devices work differently from computers, they can affect how well surveys collect information. However, past research on this is incomplete and not definitive, often using designs that aren’t suited for mobiles or not considering the specific device used, like smartphones or tablets. This study looked at data from a German survey called GERPS, which was designed to work well on mobiles, involving 4,888 people who had emigrated. They compared how accurate the data was from people using smartphones, tablets, and computers. They adjusted the results to make sure they weren’t biased by people choosing a certain device. The findings showed mixed results in terms of data accuracy across devices, with smaller differences compared to earlier studies. More people tended to stop the survey on mobile devices, especially on smartphones with small screens. Still, using surveys that work on mobiles seems promising, especially because they attract a larger number of respondents using smartphones and tablets.
Keywords
Introduction
Online surveys have become increasingly popular over the past two decades and for a long time, they were programmed to be answered using desktop or laptop computers (in the following simply computers). Usually, these are operated with mouse and keyboard and visualized on a sufficiently large screen (Schlosser & Mays, 2018; Toninelli & Revilla, 2020). Thus, the focus of survey research reflecting technical issues mainly focused on compatibility, functionality, or convenience of survey applications within different browsers and operating systems (Couper, 2008). However, due to the rapid technical developments of the last two decades, especially the increasing distribution and relevance of mobile devices such as smartphone and tablets (Décieux et al., 2019; Erzen et al., 2019), the perspective of online survey research had to be extended. Recent studies detected a steady increase in online questionnaires answered via smartphones and tablets (e.g., Haan et al., 2018; Keusch et al., 2020; Revilla et al., 2016). This has led to a shift in perspective: Mobile devices are now seen as having potential to reach hard-to-survey populations (Firchow & Mac Ginty, 2017; Lugtig et al., 2019). Therefore, previous research started to investigate the factors that explain device choice as they can lead to a selectivity bias between these modes (Gummer, Quoß, & Roßmann, 2018; Lugtig & Toepoel, 2016; Maslovskaya et al., 2019). Moreover, it is important to note that the handling of an online survey is different on a mobile device compared to a computer (see e.g., Schlosser & Mays, 2018; Toninelli & Revilla, 2020). Indeed, recent research found inconclusive results concerning differences in data quality and response properties among smartphone, tablet, and computer respondents. Although some studies found that data quality of surveys answered on a mobile device is as good as those on computers, other studies found larger differences between the devices (e.g., Andreadis, 2015; Lee et al., 2018; Schlosser & Mays, 2018). One explanation for such differences could be that classical online survey designs often were not adjusted to smaller screens, especially those of smartphones, and the different input options of mobile devices, thereby introducing user inconvenience (Cazañas & Parra, 2016; Toninelli & Revilla, 2020). With the aim of improving user experience on mobile devices, online surveys are now often provided with a so-called mobile-optimized responsive survey design. These mobile-optimized designs adapt the questionnaire presentation to the device that renders it. However, current studies point out that research is needed in order to investigate whether responsive survey designs are able to decrease differences in data quality between devices (Antoun, Katz, et al., 2017; Gummer, 2020; Schlosser & Mays, 2018).
Research presented in this paper was conducted to complement and update existing knowledge. On the one hand, this paper investigates possible data quality differences among smartphone, tablet, and computer device respondents within a mobile-optimized design. On the other hand, basing our analysis on a probability-based register sample and using an advanced preprocessing method, that is, propensity score weighting, afforded us the advantage of being able to simultaneously separate device effects (of smartphone, tablet, or computer) from selectivity effects due to device choice (Kroh et al., 2021). Hence, we gain insights into whether device usage alone has an effect on data quality, even when using mobile-optimized designs.
Thus, the research presented in this paper contributes to the ongoing debate on data quality in the fast-changing online survey environment and provides implications for the future of online surveys to be handled as mixed-device surveys.
Smartphone and Tablet Usage Within Online Surveys
Within the last 10 years, methodologists working with online surveys have increasingly faced a new phenomenon first called “unintended mobile respondents” (De Bruijne & Wijnant, 2014; Peterson, 2012). Consequently, answering the survey on a smartphone or a tablet was first misjudged as an isolated phenomenon that was handled as a measurement error (Toninelli & Revilla, 2020). However, recent longitudinal analyses of device use showed the share of smartphone and tablet respondents to be constantly increasing over time within large panel studies, for example, in the Netquest Panel (Revilla et al., 2016), the GESIS Panel (Haan et al., 2019), or the German Longitudinal Election Study (Gummer, Quoß, & Roßmann, 2018). This increased number of smartphone and tablet respondents today, however, is seen as a chance to reduce coverage errors in general population surveys and to reach classically hard-to-reach sub-populations (Firchow & Mac Ginty, 2017; Gummer, Quoß, & Roßmann, 2018; Keusch et al., 2020). Therefore, online surveys are often treated as mixed-device surveys (Callegaro, 2013; de Leeuw & Toepoel, 2018). The increasing importance and proportion of smartphone and tablets respondents within online surveys has led to a new research demand. The focus here is on the differing handling of surveys on different devices, device choice selectivity, device effects on answer quality, and improvement of response convenience on mobile devices.
Survey Participation and Survey Handling on Smartphones and Tablets
The survey situation and the handling of an online survey are different on a computer than on a smartphone or a tablet. Online surveys on computers are usually completed in a calmer environment, for example, in an office or at home, but surveys on a mobile device such as smartphones or tablets can take place anywhere and anytime (e.g., Antoun, Katz, et al., 2017; Couper & Peterson, 2017). In the past, online surveys have been programmed to be answered on computers, operated via mouse and keyboard and visualized on a relatively large screen (Toninelli & Revilla, 2020). The processing power of smartphone and tablets is usually lower than that of computers, questions are presented on smaller screens (e.g., smartphones), and the navigation takes place via a (small) touchscreen instead of mouse and keyboard (Schlosser & Mays, 2018). If the questionnaire is not adjusted to this small touch screen, web pages often extend beyond the actual size of the smaller devices’ screens, requiring users to frequently scroll horizontally and vertically in order to edit the full question (Cazañas & Parra, 2016; Toninelli & Revilla, 2020). To avoid this inconvenience on the user’s side, online surveys are now increasingly provided with a mobile-optimized version in order to achieve the highest possible practicability on all devices (Schlosser & Mays, 2018). This so-called responsive or mobile-optimized survey design provides custom layouts across multiple devices by producing a web layout that is not only resolution- and device-independent, but also adapts on the basis of the features of the device that renders it (Cazañas & Parra, 2016). According to Antoun, Katz, et al. (2017), a mobile-optimized version should consider five design heuristics: All text should be large enough to promote easy reading (readability), touch targets should be large enough to tap accurately (ease of selection), the whole content should fit the width of the screen so that horizontal scrolling is unnecessary (visibility across the page), design features should be simple to use (simplicity of design features), and questionnaires should function in a predictable way across different devices (predictability across devices). Thus, a mobile-optimized survey design aims to make the survey experience as convenient and the online survey processing as fast as possible (Gummer, 2020). Such design customizations inevitably improve the handling experience on smartphones and tablets (Andreadis, 2015), and studies have come to the conclusion that these are suitable for a large number of survey instruments (Toninelli & Revilla, 2020). Thus, more research is needed to determine whether there is a difference in data quality between survey answered on smartphones, tablets and computer devices.
Research on Device Selectivity
Previous research has studied whether specific respondent characteristics are associated with proportions of device choice. Respondents choosing a smartphone or a tablet seem to be more likely female (e.g., Gummer, Quoß, & Roßmann, 2018; Keusch & Yan, 2016; Maslovskaya et al., 2019), younger (Antoun, 2015; Couper et al., 2017; Décieux, 2021), more educated (e.g., De Bruijne & Wijnant, 2013; Keusch & Yan, 2016), and living in a household with fewer persons (e.g., Cook, 2014; Haan et al., 2019; Toepoel & Lugtig, 2014). However, there are also studies that found no or inconsistent differences of device usage in terms of age, gender, education, or household composition (e.g., Maslovskaya et al., 2019; Revilla et al., 2016; Schlosser & Mays, 2018). Some of these inconsistent findings might be explained by the different sample sizes (and thus, different statistical power to detect effects), the country of origin of the samples (e.g., Dutch, Germany, United States, Latin America), or that some studies used probability samples (e.g., Lugtig & Toepoel, 2016), while others did not (e.g., Cook, 2014). Nevertheless, to account for possible selection effects of device choice, the current study takes these respondent characteristics into account.
Research on Differences in Data Quality Between Mobile Devices and Computer Devices
Research focusing on the influence of device usage on data quality found that online surveys tend to have a significantly lower completion rate and thus higher dropout rates, especially when answered on a smartphone (e.g., Mavletova, 2013; Stapleton, 2013; Struminskaya et al., 2015). Concerning item nonresponse, the effect of devices is inconsistent (e.g., Toepoel & Lugtig, 2014; Tourangeau et al., 2018). Study results are also unclear regarding differences in the number of non-substantive answers within a survey completed on smartphone or tablet versus on computer devices (e.g., Schlosser & Mays, 2018; Toepoel & Lugtig, 2014). Moreover, most studies indicated smartphone or tablet users to need more time to complete the survey compared to computer users and found particularly large differences between the use of smartphones and computers (e.g., Antoun & Cernat, 2019; Gummer & Roßmann, 2015; Stapleton, 2013). However, other studies found the opposite, that is, shorter completion times for mobile devices compared to computers, which might be caused by mobile optimization methods (Couper & Peterson, 2017; Mavletova & Couper, 2015), or a lack of differentiation between smartphone and tablet respondents within their analysis (Mavletova & Couper, 2015). Concerning non-differentiation response behavior (e.g., within a matrix question), results are also inconclusive. Although some studies found an increased tendency for non-differentiation on smartphones and tablets compared to computers (e.g., Maslovskaya et al., 2020), others found no significant differences between the devices (Antoun, Couper, & Conrad, 2017; Revilla & Couper, 2017; Tourangeau et al., 2018).
Regarding the length of responses to open-ended questions, most studies indicated shorter responses on tablets and especially on smartphones compared to computers (Ha et al., 2020; Mavletova, 2013; Struminskaya et al., 2015) or found no differences (Antoun, Katz, et al., 2017; Schlosser & Mays, 2018). Concerning distractions or multitasking behavior that can affect data quality, research found that respondents using a smartphone or a tablet seemed to show less multitasking behavior when passively measured via paradata (data on the data collection process automatically collected by the online survey software; Décieux, 2022; Höhne et al., 2020). Most studies for example, those of Antoun, Katz, et al. (2017), Antoun, Couper, and Conrad (2017), or Antoun and Cernat (2019), found especially smartphone respondents reported being more distracted when answering a survey.
Some of this research did not implement a mobile-optimized design (e.g., Haan et al., 2019; Schlosser & Mays, 2018; Struminskaya et al., 2015; Tourangeau et al., 2018), others did not explicitly provide details as to whether they used an optimized design (Höhne & Schlosser, 2017; Roßmann et al., 2018; Sommer et al., 2017). One could argue that those designs put smartphone and tablet devices in a disadvantaged position as the online survey experience using these devices was worse than it had to be. Indeed, some studies indicated that mobile optimization enhances data quality of smartphone and tablet surveys (Andreadis, 2015; Antoun, Katz, et al., 2017; Dale & Walsoe, 2020; Zou et al., 2021). However, most of these studies based their analysis on convenience samples, or specific populations such as student or university samples (e.g., Couper & Peterson, 2017; Lee et al., 2018; Schlosser & Mays, 2018; Zou et al., 2021), experienced panel users (e.g., Höhne et al., 2020; Mavletova & Couper, 2016; Sommer et al., 2017), or focused only on specific parts of a survey such as specific question formats (e.g., Mavletova et al., 2017; Revilla & Couper, 2017).
Thus, information from probability-based samples is needed to identify the changes in general survey participation as a result of evolving mobile optimized and mobile first designs (see e.g., Antoun, Katz, et al., 2017; Maslovskaya et al., 2019; Schlosser & Mays, 2018). Studies that implemented such a mobile-optimized design point at least to an increase in data quality with regards to specific indicators due to the better user convenience (e.g., Antoun & Cernat, 2019; Couper & Peterson, 2017; De Bruijne & Wijnant, 2014; Ha et al., 2020; Lee et al., 2018; Roßmann et al., 2018).
The Problems of Device Selectivity and Forced Device Choice Within Existing Study Designs
Most studies comparing data quality of computer, smartphone and tablet respondents are based on observational (non-experimental) designs where respondents are allowed to use a device of their own choice (e.g., Couper & Peterson, 2017; Maslovskaya et al., 2020; Stapleton, 2013). Therefore, these studies were unable to adequately differentiate between device and selection effects due to device choice (e.g., Couper & Peterson, 2017; Keusch & Yan, 2016). Other studies, based on experimental designs, instructed participants to complete a questionnaire twice (e.g., Antoun, Katz, et al., 2017) or to use a specific device to participate in the online survey, even though they might not have chosen that device when given a choice (e.g., De Bruijne & Wijnant, 2013; Lee et al., 2018; Mavletova, 2013; Schlosser & Mays, 2018). Besides the general imbalance within experimental studies (e.g., Deaton & Cartwright, 2018), such instructions can be problematic. “Forcing” respondents to use a device they are not familiar with, may introduce an arbitrary bias. Respondents who have to use a device with which they are not familiar will likely have a less enjoyable user experience, lower survey satisfaction, longer completion times, and are more likely to drop out (e.g., Antoun & Cernat, 2019). Moreover, some sample members do not follow the instructions and complete the survey with a device other than the one specified (e.g., De Bruijne & Wijnant, 2013; Mavletova, 2013; Mavletova & Couper, 2015; Schlosser & Mays, 2018). Research has suggested that this occurs more often when respondents have to switch from computer to a smartphone or a tablet compared to the opposite (Mavletova & Couper, 2016; Metzler, 2020). The non-compliant respondents are usually excluded (e.g., Schlosser & Mays, 2018). However, this device-dependent exclusion and selective dropout can threaten the validity of the experiments (Shadish & Campbell, 2002).
To overcome methodological concerns in previous studies that either used an observational design without adequately accounting for differences in the composition of the groups or used an experimental design that assigned respondents to devices that they did not prefer (and with which they might not be familiar), the current study takes a different approach:
An observational design was implemented to elucidate data quality between smartphone, tablet and computer respondents. To rule out a possible selection effect, this study makes use of an advanced preprocessing method, that is, propensity score analysis with inverse probability of the treatment weighting (see section “Analytical Strategy” for details). Despite its potential to adequately reflect data quality between smartphone, tablet and computer devices (e.g., Maslovskaya et al., 2020), preprocessing methods are seldomly used when comparing computer, smartphone and tablet respondents (for an exception see Liebe et al., 2015 which however, only differentiate between mobile and computer devices).
Research Questions and Hypotheses
The central aim of this paper is to simultaneously compare data quality of online survey responses on smartphone, tablet, and computer devices within a probability-based and mobile-optimized online survey. Three levels of indicators are considered: First, traditional survey-level indicators that allow for analysis of answering behavior over the whole survey; second, indicators that reflect data quality on the question level; and third, dropout behavior. Based on the results of previous research, we developed the following hypotheses.
Survey-Level Indicators
Concerning the survey-level indicators, we made use of three data quality indicators: the prevalence of item non-response, the prevalence of multitasking behavior, and response speed.
H1: Item non-response is similar on tablets, smartphones, and computer devices.
H2: On-device multitasking rates are lower on tablets and smartphones than on computer devices.
H3: Completion time is higher on tablets and smartphones than on computer devices.
H4: Net completion time, that is, completion time corrected for on-device multitasking (see Measures section) is higher on tablets and smartphones than on computer devices.
Question-Level Indicators
Regarding the question-level indicators, we also considered three different indicators to assess data quality concerning answers to specific questions. These are: the prevalence of non-substantive answers, the level of differentiation within matrix questions (computer devices) or item-by-item questions (mobile devices), and the length of answers to open-ended questions.
H5: The prevalence of non-substantive answers is similar among all three device types.
H6: Responses to open-ended questions are longer on a computer device compared to tablets and smartphones.
H7: Non-differentiation behavior is more prevalent on tablets and smartphones than on computer devices.
Dropout-Level Indicators
Finally, dropout behavior was investigated.
H8: Respondents using a tablet or a smartphone are more likely to drop out earlier and more often than respondents using a computer device.
Materials and Methods
Data
The following analysis relies on the first wave of the emigrant sample (n = 4,928) of the German Emigration and Remigration Panel Study (GERPS; Erlinghagen & Schneider, 2020). It is a probability-based sample drawn from German local population registers (Ette et al., 2021). Participants received a postal letter with an invitation to an online questionnaire (“push-to-web approach”; see Dillman, 2017).
Tablet, smartphone, and computer usage were identified via user agent strings. We excluded 40 respondents who had blocked JavaScript functions in their browsers. Therefore, our dropout analyses were based on 4,888 cases. For the survey-level as well as for the question-level indicators, we only investigated data quality of those respondents who at least “partially completed” the survey (answered at least 50% of the questions; see AAPOR, 2019) and reached the final survey page asking for panel consent. Due to this restriction, 297 respondents were excluded from these analyses. Finally, we excluded 204 cases due to missing information in an explanatory variable (e.g., age, gender, education, single-person household) and 98 cases who had been screened out by the survey program (due to long absence times) or had to be omitted due to invalid response. Therefore, the effective sample consists of 4,163 respondents (for an overview on the sample structure, see Table 1 in the Results section). The questionnaire consisted of 74 pages with 134 questions. Respondents were allowed to skip questions as a forced answering design has been found to be detrimental in terms of data quality (e.g., Décieux et al., 2015; Sischka et al., 2022). Moreover, GERPS makes use of a mobile-optimized design, which adapted the questionnaire design to the screen of the device that renders the survey. For example, an initial matrix question on a computer device was partitioned into several single item-by-item questions when a participant accessed the questionnaire using a mobile device (see Figure 1).
Device Choice Across Different Sociodemographic Groups.

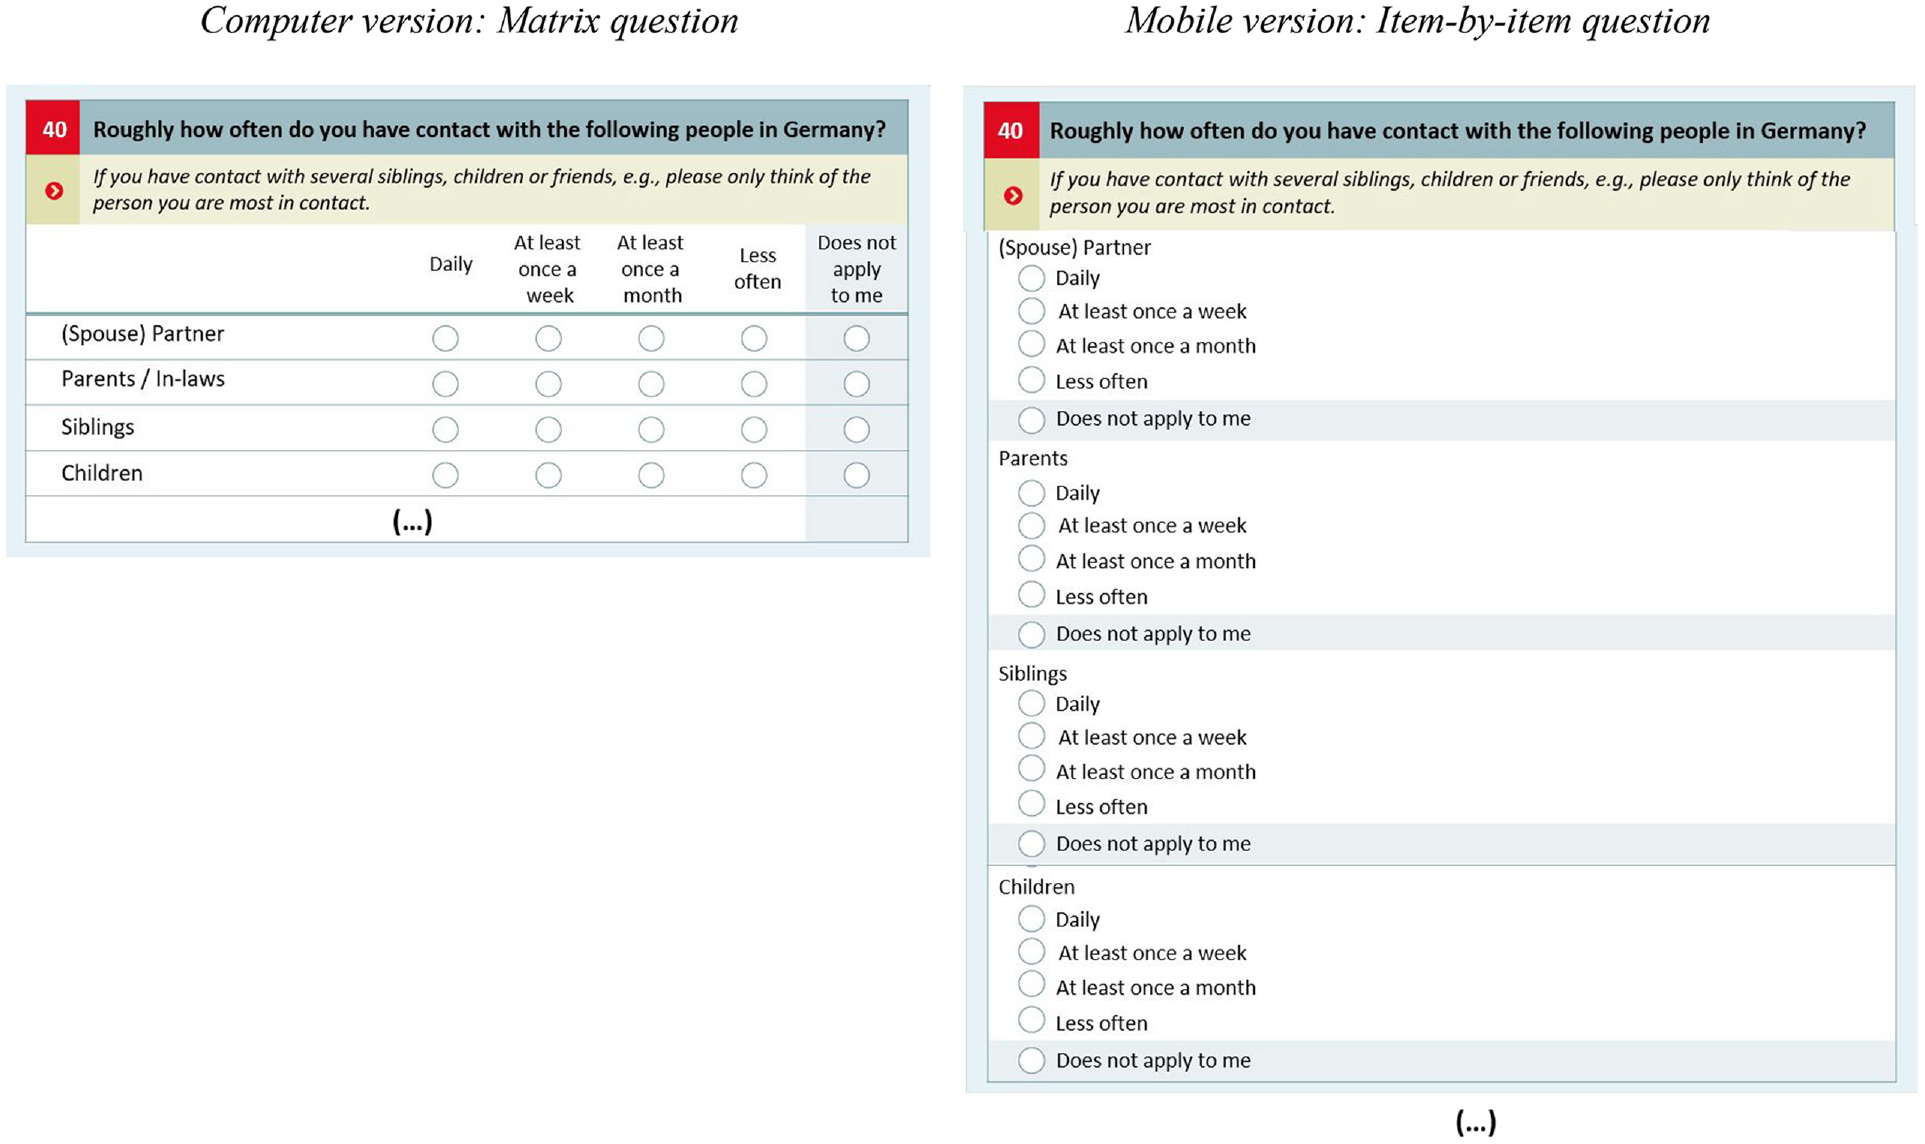
Sample question showing the versions of the responsive design.
Measures
Independent Variables: Device Usage and Respondent Attributes
The independent variable device was derived from the user agent string by using the Stata module parseuas (Roßmann & Gummer, 2016; Roßmann et al., 2020). We clustered the device types in three groups (0 = computer, 1 = smartphone and 2 = tablet).
Moreover, individual respondent attributes were used to account for possible selection effects due to device choice. Informed by our literature review on device selectivity in section “Research on Device Selectivity,” we considered age (1 ≤ 30 years, 2 = 31–41 years, 3 = 41–50 years, 4 ≥ 50 years), gender (0 = male, 1 = female), educational level (1 = no degree, 2 = intermediate level, 3 = upper level) and single-person household (0 = no, 1 = yes) as covariates for the propensity score weighting.
Dependent Variables: Indicators Measuring Survey Performance and Data Quality
We examined the relationship between device usage and seven data quality indicators. They can be categorized in three different levels concerning their analytical focus: the survey-level, the question-level, and the dropout-level. Starting with the indicators focusing on survey-level behavior, our first measure is the relative share of item non-response or the item skip rate, typically used to assess data quality in a survey (Leiner, 2019; Lugtig & Toepoel, 2016; Schlosser & Mays, 2018).
Second, we tracked respondents’on-device multitasking behavior as a measure of survey distraction and insufficient response effort: This information can be derived by online paradata tools (e.g., the Embedded Client Side Paradata tool (ECSP) provided by Schlosser & Höhne, 2018) that track all on-device multitasking events (e.g., respondents switching away from the survey window to answer an email or check another web page) in the background of the survey based on JavaScript functions, in this case the “on-blur” function. For our dependent variable, we excluded the introductory and final pages of the questionnaire as these consisted of links to external pages, (e.g., to a page providing information on how personal data would be protected) and thus promoted longer on-device multitasking events. Furthermore, since we were only interested in sequential multitasking events in this study, we also excluded shorter window switches. Since, according to cognitive theory, these typically do not indicate cognitively demanding multitasking and thus no sequential activity. Therefore, in line with experimental media multitasking research, we did not track on-device multitasking events shorter than 30 s in order to only include sequential events (for further information on that approach see for example, Décieux, 2022).
Third, speeding behavior has been observed to be one of the most reliable indicators of careless responding (e.g., Leiner, 2019; Schlosser & Mays, 2018). Therefore, in line with recommendations in data quality research (Bowling et al., 2021), an overall response speed index for each respondent on the basis of the response time on each survey page was calculated. The value of this index can be interpreted as a measure of respondents’ response speed compared to the average of all other respondents. A value of 1 means the respondent’s response speed on the survey page was equivalent to the mean of all respondents, values close to 0 indicate a very fast response speed on the page compared to all other respondents, and values close to 2 indicate a very slow response speed on the page compared to all other respondents. We computed a total of 74 page time indices, which were then averaged to one overall response speed index (this response speed index was calculated using the Stata module rspeedindex by Roßmann, 2015). However, as Höhne and Schlosser (2017), Antoun and Cernat (2019), and Décieux (2022) have already shown, it is very likely that with every longer on-device multitasking event, the response time automatically increases. Therefore the supposed effect runs the risk of being significantly biased.
Hence, we fourth also developed an overall adjusted net response speed index in which the time attributable to on-device multitasking on every page was subtracted from the response time on the page. In doing so, 74 page-adjusted indices were computed and then averaged over the total adjusted response speed index.
Concerning the indicators on the question level, the fifth dependent variable was an overall index of non-substantive answers: Non-substantive answers are also widely used as a sign of careless responding and satisficing behavior (e.g., Goldammer et al., 2020; Leiner, 2019). We computed an index counting non-substantive answers such as “don’t know” or “not specified,” which were offered in seven questions. Again, an overall index of non-substantive answers was calculated.
Sixth, we computed the length of open-ended answers to an open-ended question at the end of the survey. Here, length of the answer was defined as the number of characters in the answers.
Seventh, an overall index of non-differentiation was developed. Non-differentiation is a common measure of careless responding (Leiner, 2019) assuming that higher variation within answers is a sign of better answer quality and a more optimal response process. We computed a coefficient of variation for each survey respondent over all six matrix questions comprised of at least five items each and with at least five response options each, ignoring missing values. This coefficient is defined as the standard deviation of responses within the question matrix divided by the mean of the responses. Lower index levels indicate a lower differentiation within the matrix questions and higher levels indicate higher levels of variation (for the calculation of the coefficients of variation we used the Stata module respdiff by Roßmann, 2017). This resulted in six matrix-specific coefficients of variations per respondent. These were then averaged to one overall index of variation. Again, higher overall index values indicate lower overall differentiation of answers and higher overall values indicate higher levels of variation and by this better answer quality.
Finally, we investigated dropout behavior. We documented whether a respondent dropped out of the survey or not and additionally documented the survey page where respondents quitted their participation as the position of the dropout.
Analytical Strategy
The current study is based on an observational (non-experimental) design, where respondents could freely choose the device they wanted to use for survey completion. Thus, the response situation is similar to the real-world situations of answering an online survey. However, as already mentioned, device choice might be affected by different covariates. Within the theoretical framework of this study the relevant covariates to reflect selection effects due to device choice are gender, education, age, and household composition. We aimed to control for these covariates to obtain an estimate of the device use (treatment) effect on data quality. Most of the previous studies compensate for the different device choice probabilities by including the covariates as control variables in the regression model and treating them as “nuisance parameters” (Hünermund & Louw, 2020; Liang & Zeger, 1995). In contrast to the previous approach, the current study follows the more elaborate approach of advanced preprocessing methods to separate device selectivity from device effects. By applying propensity score weighting (PSW) simultaneously across all three device groups, it is possible to achieve a covariate balance between the two treatment groups (smartphone and tablet users) and the control group (computer users) in order to account for selectivity (Guo & Fraser, 2015; Hainmueller, 2012; Williamson et al., 2012). Compared to a propensity score matching (Park et al., 2019), applying a PSW does not sacrifice observations and by this permits retaining most study participants in the outcome analysis (Guo & Fraser, 2015).
The propensity score model was specified with gender, education, age, and household composition as covariates that were used in an iteratively applied generalized boosted models to determine the final set of main and interaction effects (McCaffrey et al., 2004, 2013). The estimated propensity scores were then used within the inverse probability of the treatment weighting approach (Austin & Stuart, 2015) to estimate the average treatment effect (ATE). After applying these weights, the control group is ideally fully comparable—based on observables—with the treatment group(s) (Caliendo & Kopeinig, 2008). To find the optimal number of iterations, the absolute standardized mean difference (ASMD) was graphically checked (McCaffrey et al., 2004, 2013; see Figure A1 in the electronical supplement [ESM]). Moreover, the overlap of the propensity score distribution between groups was evaluated to assess the positivity assumption (i.e., that each subject has a non-zero probability of receiving each treatment; McCaffrey et al., 2013; see Figure A2 in the ESM). After the estimation of the PSWs, the balance between the three device groups on the covariates (and all of their two-way interactions) were assessed (see Figure A3 in the ESM) with absolute standardized differences (Austin, 2009) whereas values of <0.1 are often deemed negligible (e.g., Haukoos & Lewis, 2015). Finally, the weight distribution (see Figure A4 in the ESM) was evaluated to check for extreme weights that can lead to variance inflation (Desai & Franklin, 2019).
Compared to the classical methods such as regression models, propensity score analysis has several technical advantages. When covariate balance is achieved, and no further regression adjustment is necessary, propensity score analysis does not rely on the correct specification of the functional form of the relationship (e.g., linearity or log linearity) between the outcome and the covariates (Rubin, 1973; Rubin & Thomas, 2000). This makes modelling of misspecifications more robust compared to multiple regressions (Williamson et al., 2012). Moreover, propensity score methods follow a multi-step approach to maximize covariate balance as measured by the minimum p-value across a set of balance tests and thereby examine the joint distribution of the predictors (in particular, of treatment assignment and the covariates; Caliendo & Kopeinig, 2008). Additionally, the diagnostics for propensity score analysis (checking for balance in the covariates) are much more straightforward than those for regression analysis (residual plots, measures of influence, etc.). They may even come to the result, that it is not possible to separate the effect of the treatment (in the present study, device) from other differences between the groups (e.g., device choice; Stuart, 2010; Zanutto, 2006). Moreover, propensity score methods are “blind to outcome status” (Williamson et al., 2012) as modeling and outcome analysis can be performed separate from each other (Zanutto, 2006). This reduces biases due to prior beliefs (Williamson et al., 2012). Following the recommendation of Guo and Fraser (2015), the treatment effects in PSW models were identified within propensity score weighted bivariate regression analyses.
Data analysis was done with R (Version 4.1.0; R-Core-Team, 2021). The propensity score weights were calculated with the twang package (Cefalu et al., 2021). Covariance balance was assessed using the cobalt (Greifer, 2021) package. Survival analysis was done with the survival (Therneau et al., 2021) and survminer (Kassambara et al., 2021) packages.
Results
Selection Effects Due to Device Choice
Table 1 provides an overview of how device choice is affected by the relevant covariates (last column). Device choice was significantly associated with respondents’ age, gender, and educational degree. Compared to the other groups, the respondents who used computers tend to be older, are more often male, have the highest educational degrees, and more often live in a single-person household. Smartphone respondents were the youngest group, were most often female, less educated, and lived less often within a single-person household. When focusing on the patterns of the tablet group, we can see that this group tends to be older than the other two groups and more often female compared to the computer group, but less often compared to the smartphone group. Respondents who used tablets also fell between the computer users and the smartphone users in terms of average education level. The same intermediate position was true concerning household composition, as computer respondents lived more often within a single-person household and smartphone users less often.
Propensity Score Evaluation
The number of iterations for the propensity score model seems to be sufficient, as all balance measures reached a plateau between 3,000 and 5,000 iterations (see Supplemental Figure A1). The positivity assumption seems to be met quite well, propensity score distributions from all three devices did mostly overlap (see Supplemental Figure A2). Applying the propensity weights lead to a much better balance of the covariates across devices. The ASMD ranged between 0.00 and 0.07 (MASMD = 0.01, SDASMD = 0.01; see Supplemental Figure A3), indicating negligible differences between devices after the weighting. The propensity weights ranged between 1.12 and 47.21 (Mweights = 2.99, SDweights = 3.57; see Supplemental Figure A4 for the weights distribution stratified by devices). None of the weights were excessive, as the largest weight accounts for only 0.38% of the total sum of the weights (McCaffrey et al., 2004). Thus, we concluded that the propensity weights effectively account for possible selection effects and could be used for subsequent analyses.
Device Effects
Table 2 shows the associations between device and the different data quality indicators within the propensity score weighted bivariate regression analyses (see Supplemental Figures A5 and A6 for the distribution of the data quality across devices before and after applying PSW).
Associations Between Device and Data Quality Indicators.

Note. n = 4,163; Constant (Computer); regression coefficients and constant are presented in italics, standard errors in parentheses.
Cox regression was calculated within a sample of 4,888 respondents, including those respondents who dropped out within the survey. Coefficients here represent the Hazard Ratios.
p < .10, *p < .05, **p < .01, ***p < .001
Survey-Level Indicators
While answering the survey on a tablet had no significant effect on the item non-response rate, answering the survey on a smartphone was significantly related to lower item non-response (model 1). Computer respondents showed on average more sequential on-device multitasking events over the whole survey than smartphone or tablet respondents (model 2). Moreover, computer respondents, on average, finished the survey significantly faster compared to smartphone respondents (model 3). For tablet respondent no significant difference concerning the average page-wise response speed was found compared to computer respondents. The more fine-grained net response speed indicator covered by model 4 showed a similar pattern. Again, computer respondents were significantly faster per page than smartphone respondents. Using a tablet to answer the survey had no significant effect on response time compared to using a computer.
Question-Level Indicators
Concerning the prevalence of non-substantive answers, smartphone respondents showed significantly higher levels of non-substantive answers (model 5). Contrary, compared to computer respondents, tablet respondents did not significantly differ with regard to non-substantive answers. Moreover, smartphone and tablet respondents gave on average significantly more differentiated answers than computer respondents (model 6). Concerning the length of open-ended answers, it was apparent that smartphone respondents provided significantly shorter responses on average. A similar pattern was observed for tablet users, who also responded with significantly shorter answers than computer users.
Dropout-Level Indicators
Figure 2 shows Kaplan-Meier survival curves for computer, smartphone, and tablet respondents. The Log-rank test indicated that the dropout curves were statistically different. The pairwise comparison revealed the dropout curves between PC and smartphone respondents (p < .001), but not between PC and tablet respondents (p = .239) to be statistically different (model 8). Moreover, the dropout curves between smartphone and tablet respondents were also statistically different (p = .011). Notably, post hoc graphical inspection of Figure 2 revealed that the dropout rate of smartphone respondents declined more steadily.

Dropout and 95% confidence intervals as a function of device and questionnaire length.
The first spread of the device-specific dropout rates appeared in all three respondent conditions (computer, smartphone, and tablet) when a longer questionnaire sequence (pages 5 and 6) asking for details about the respondents’ move abroad (country they moved to, month and year) was shown. The following significant spreads could mainly be found within the smartphone condition. The first inflection point was the first original matrix question within the survey (shown as item-by-item questions on a mobile device) shown on questionnaire page 7 and asking for migration motives. It consisted of eight items. Another inflection point, especially for smartphone users, was at page 10, where questions about the household structure appeared. Finally, a last inflection point mainly within the group of smartphone respondents was on page 77, where panel consent and permission for future contact was requested.
Cox regression analysis confirmed the results from the Kaplan-Meier survival curve analysis and showed a higher hazard ratio (HR) for smartphone respondents compared to computer respondents amounting to an 111% increase in dropout risk. In contrast, the HR for computer and tablet respondents was not statistically significant. Thus, H8 was partially supported by the empirical results, as only smartphone respondents differed significantly from computer respondents in their dropout patterns.
Discussion
Respondents participating on a smartphone or a tablet have become standard in modern online surveys (e.g., Haan et al., 2018; Keusch et al., 2020; Revilla et al., 2016) and have even become technical tools to reach hard-to-survey populations (Firchow & Mac Ginty, 2017; Lugtig et al., 2019). Therefore, it is increasingly important to learn more about this form of participation and the data quality produced in mixed-device surveys (e.g., Lee et al., 2018; Schlosser & Mays, 2018). The central aim of the current study was to compare data quality of smartphone, tablet and computer respondents who answered an online survey within a mobile-optimized design.
Using PSW (Pan & Bai, 2018) as a preprocessing method to account for device choice selectivity effects (e.g., Maslovskaya et al., 2019; Metzler, 2020; Struminskaya et al., 2015) and based on the probability-based data, we investigated seven different established indicators that reflect answer quality on different levels of the survey. We investigated three different survey-level indicators which reflect answer quality across the whole survey. Concerning item non-response, we found data quality to be similar between computers and tablets and that smartphone respondents produced lower levels of item non-response. Moreover, we found that smartphone and tablet respondents engaged in lower levels of on-device multitasking compared to computer respondents. These results are in line with results of existing research on device multitasking that have tracked on-device multitasking based on advanced paradata approaches (e.g., Décieux, 2022; Höhne et al., 2020) and contrary to the results from studies focused on respondents’ retrospective self-reports (e.g., Antoun & Cernat, 2019; Antoun, Couper, & Conrad, 2017; Antoun, Katz, et al., 2017). One reason for this difference might be a recall bias within the retrospective self-reports (Haenschen, 2019; Hopp et al., 2018), that smartphone respondents overestimate their multitasking behavior. Survey duration was reflected by two different indicators: one that focused on the actual survey duration and a second one that corrected for the time spent within multitasking behavior. However, both indicated that surveys took significantly longer on smartphones but not on tablets compared to computer devices. This finding is in line with results of previous studies (e.g., De Bruijne & Wijnant, 2013; Gummer & Roßmann, 2015; Mavletova, 2013). Thus, two survey-level indicators have no clear tendency toward one of the three devices.
At the question-level, we also investigated three different indicators. Here, we found that the number of non-substantive answers was higher on tablets and especially on smartphones compared to computers. This result is contrary to results of previous studies on devices (Mavletova, 2013; Schlosser & Mays, 2018; Toepoel & Lugtig, 2014). A potential explanation for this finding might be the motivated GERPS respondents (Ette et al., 2020), or the small number of questions where a non-substantive answer was possible. Additionally, we found that the length of answers to open-ended questions was shorter on smartphones compared to computers. This finding is in line with the results of previous studies (Ha et al., 2020; Struminskaya et al., 2015). We also analyzed the level of differentiation in specific questions. Here, we found, that respondents using a smartphone gave more differentiated answers indicating better data quality. A possible explanation might be that within the mobile-optimized survey design, matrix questions are presented as item-by-item questions, that—following psychometric research—are expected to prompt more differentiated answers than matrix questions (Liu & Cernat, 2018; Mavletova et al., 2017; Revilla & Couper, 2017).
Finally, we investigated dropout behavior. Here we found that respondents using a smartphone dropped out more often compared to respondents using a computer. These results are consistent with previous research (Mavletova, 2013; Sommer et al., 2017; Stapleton, 2013; Struminskaya et al., 2015) that also found an increased dropout risk on mobile devices. Moreover, our more fine-grained perspective additionally complements existing results by finding that this increased risk is mainly driven by smartphone users. Tablet respondents’ dropout risk did not significantly differ to those of computer respondents. See Table 3 for a quick summary of the current study results.
Data Quality Comparison Between Smartphone and Computer Respondents.

Note.+ = higher data quality, ≈ = equal data quality, and − = lower data quality; reference category is computer.
Some limitations of the present study need to be considered. Since GERPS is a general population survey that does not primarily aim to implement methodological analyses (Ette et al., 2021), we had to operate with the instrumentation offered within the questionnaire and the paradata. Thus, we had to rely our analysis on a limited number of grid questions and it was not possible to implement trap questions such as Bogus items (e.g., Goldammer et al., 2020) or instructed response items (e.g., Gummer, Roßmann, & Silber, 2018). Additionally, our respondents were emigrants originating from Germany. Even if previous studies have shown that this sample is less selective and more homogeneous than typical migrant samples (Ette et al., 2021; Ette & Erlinghagen, 2021), this may properly affect the generalizability of our findings. Moreover, since the respondents in our study were free to choose their preferred device in answering the survey, this study is based on an observational approach. Consequently, this results in a risk of a selection effect due to device choice compared to the random assignment to a device within the framework of an experimental study. In order to account for this possible selection effect and to approximate the causal effect as closely as possible, we controlled for relevant confounding variables in our analyses. These confounding variables were strongly derived from prior knowledge on respondents’ device choice (e.g., Haan et al., 2019), in order to avoid confounding bias (Elwert & Winship, 2014). By applying PSW (King & Nielsen, 2019; Pan & Bai, 2018), it was actually possible to simultaneously achieve covariate balance between the two treatment and control groups in order to account for selectivity based on the most important confounds. However, even our theory-driven preprocessing approach might be distorted, as additional characteristics might have confounded the results. For instance, research has shown ownership or access and familiarity with a specific device to determine which device will be used in the survey (e.g., Haan et al., 2019). Ideally, a preprocessing approach would include all relevant characteristics causing device choice.
Based on our results, it is possible to draw valuable conclusions for online surveys and by this to complement the existing research. In addition, our results have great added value for cross-sectional surveys, which are the standard application case, also in comparison to previous studies as our approach was based on the initial wave of a probability based online panel. Hence, the survey situation and the survey population are similar to that of a cross-sectional survey and less affected by cumulated selectivity biases of established panels (e.g., Gummer & Daikeler, 2018; Lynn, 2018; Sakshaug et al., 2019).
Conclusion
We found significant differences in several data quality indicators between computer, smartphone and tablet respondents. However, we found no clear pattern that would indicate smartphone, tablet or computer participants to produce lower quality answers. Thus, at first glance, one might conclude that the possibility of using different devices is still a potential source for biases, but with no clear pattern indicating which devices are better. However, even though no clear conclusion can be drawn, we found substantial differences in the specific data quality indicators. These differences could of course also be a source of bias. To address this issue in data analyses, we would recommend researchers to at least check for robustness of the results when additionally controlling for devices or even better including the device as additional control variable in their analyses when it is based on online survey data.
In line with other studies using a mobile-optimized design (Dale & Walsoe, 2020), we think that this may have reduced the difference in data quality between computer and mobile respondents. As the frequency of mobile respondents is growing in online surveys, ignoring them is no longer adequate. Instead, online surveys should be optimized for mobile respondents. All in all, our results showed that mobile devices, be it smartphones or tablets, do not seem to produce lower data quality in general, indicating the advantages of mobile-optimized online surveys. Hence, survey designers should continue putting their efforts in finding strategies to “optimize” questionnaire layouts to ease completion on mobile devices and especially on small smartphone screens. We agree that online surveys should be programmed as mobile first design (Haan et al., 2019) merely to benefit from increasing smartphone coverage. From our perspective, exploiting the potential of mobile respondents and thus device-specific tailoring for the survey participation (Dillman et al., 2014) is a more reasonable strategy than trying to avoid “unintended mobile respondents” (Peterson, 2012), a strategy still used within some current studies (e.g., Griggs et al., 2021).
However, the increased dropout risk on mobile devices is still a considerable challenge for mobile device participation. Here, survey researchers are required to focus on the reasons for the dropouts, for example, by doing question-level analysis, and to work on appropriate counter-measures such as adequate adaptive, split-sample, or messenger-based survey designs (Montgomery & Rossiter, 2019; Peytchev, 2020; Toepoel et al., 2020). Both approaches have the potential to provide a better response quality in their own way. Split-sample designs are a promising measure to decrease the survey time and thereby the perceived burden of survey participation, and messenger surveys might be a strategy to improve the survey experience by gamifying the survey participation.
Supplemental Material
sj-docx-1-sgo-10.1177_21582440241252116 – Supplemental material for Comparing Data Quality and Response Behavior Between Smartphone, Tablet, and Computer Devices in Responsive Design Online Surveys
Supplemental material, sj-docx-1-sgo-10.1177_21582440241252116 for Comparing Data Quality and Response Behavior Between Smartphone, Tablet, and Computer Devices in Responsive Design Online Surveys by Jean Philippe Décieux and Philipp E. Sischka in SAGE Open
Footnotes
Authors’ Note
Declaration of Conflicting Interests
The author(s) declared no potential conflicts of interest with respect to the research, authorship, and/or publication of this article.
Funding
The author(s) disclosed receipt of the following financial support for the research, authorship, and/or publication of this article: The German Emigration and Remigration Panel Study (GERPS) is funded by the German Research Foundation (DFG) [project no. 345626236] and the German Federal Institute for Population Research.
Data Availability Statement
Supplemental Material
Supplemental material for this article is available online.
References
Supplementary Material
Please find the following supplemental material available below.
For Open Access articles published under a Creative Commons License, all supplemental material carries the same license as the article it is associated with.
For non-Open Access articles published, all supplemental material carries a non-exclusive license, and permission requests for re-use of supplemental material or any part of supplemental material shall be sent directly to the copyright owner as specified in the copyright notice associated with the article.