
Abstract
Traffic congestion negatively affects the economy, human well-being, safety, and environment in both developed and developing countries. In the past, numerous studies have been undertaken to assess congestion costs. This research focuses on quantifying the individual costs incurred due to traffic congestion and the effects of socio-demographic characteristics on the individual congestion of private motorized vehicle users in the context of an urban metropolitan (Lahore) in Pakistan. Further, the study has also proposed individual traffic congestion cost (ITCC) analytics to estimate the costs related to traffic congestion. Also, statistical tests, such as the ANOVA and T-test, have been employed to determine the impact of socio-demographic characteristics on individual congestion costs. The primary data was collected from the target population by filling out a questionnaire in the study area. With a confidence level of 95% and a sampling error of 6%, this study used a sample size of 282 participants. The study findings showed that the ITCC for the respondents ranged from 17.29 rupees per day to 1136.88 rupees per day. The ANOVA and the t-test indicate that all socio-demographic variables affect the calculation of ITCC. Furthermore, this research showed that car-owning respondents faced higher individual congestion costs than motorbike-owning respondents. The anticipated contribution of this study will aid private motorized vehicle users in estimating their individual congestion costs and managing their expenses. In addition, it will encourage individuals to modify their travel habits to make more efficient use of transportation for their daily tasks.
Keywords
Introduction
As urbanization and economic growth have grown rapidly over the last few decades, many countries, specifically developing nations, have faced many hazardous global issues (Ahmed et al., 2021; Jamal et al., 2020; Osama et al., 2020). Traffic congestion on the roads is a growing concern in all major economic activity centers worldwide (Struyf et al., 2022). Since congestion is assumed to be intrinsically related to economic growth, it is considered a symbol of the economic progress of a country. Traffic congestion frequently causes activities in many cities to be delayed, hampered, or even counterproductive (Ali et al., 2014; Zahid, Chen, Jamal, & Memon, 2020). It also disrupts people’s daily lives, adds to their commute times, and raises the cost of corporate operations in the labor, supplier, and customer sectors. Furthermore, congestion in traffic has adverse effects due to an increase in vehicle occupancy and the inefficiency of public transportation, mainly in urban areas.
The challenges posed by traffic congestion studies are included in several fields, such as traffic accidents, environmental conditions, driver’s stress, etc. (Anjum et al., 2019; Hatoyama et al., 2019; Levy et al., 2010a; Samal et al., 2021; Zahid, Chen, Jamal, & Mamadou, 2020). Numerous methods are used to investigate the financial harm of traffic congestion. According to a study by Levy et al. (2010a), traffic congestion has detrimental effects on public health and also proposed a method to assess these impacts in terms of the economic costs (Levy et al., 2010b). According to a study by the Bureau of Transport and Regional Economics (BTRE, 2007), the cost of congestion in Australia was around $10 billion, mainly related to operating expenses, lost personal time, and lost business time (BTRE, 2007). Matin et al. (2012) examined the factors such as the lack of parking spaces and encroachment on the road, which are predominantly associated with traffic jams in Karachi (Pakistan). The authors also attempted to determine the effect on the city’s economic performance (Matin et al., 2012).
Another study (Ali et al., 2014) estimated that approximately 1 million pkr (approx 9,000 U.S dollars) in economic losses (comprising travel time and fuel consumption) are incurred daily due to traffic congestion in Karachi. The assessment methods were based on data gathered through socioeconomic surveys and the tracking system. It is worth noting that most previous studies have not considered the congestion costs associated with private motorized road users.
Most previous research has focused on traffic congestion and its associated expenses. However, these methodologies cannot accurately quantify the cost for individual motorized traffic users incurred due to traffic congestion because all the studies focused on the effects of traffic congestion on driver income and the total expenses of traffic congestion in the region. There is a need to examine the costs workers and business people spend due to traffic congestion and the variables impacting individual motorized vehicle users. Additionally, earlier models only estimated costs using one or two area-specific parameters. One such issue frequently ignored is that ITCC are not included in transportation costs, owing to the difficulty of accurately calculating them without a method. In prior research, only a few studies investigated the individual congestion costs for private motorized users. Consequently, this research was designed to examine the factors influencing ITCC for motorized vehicle users’ in the Lahore metropolitan, facing severe traffic-related problems.
Literature Review
Over the years, many studies on traffic congestion and estimated costs have been done around the globe. Some deal with congestion costs, which are discussed in this paper. A study was done by (Harriet et al., 2013) to assess traffic congestion and its effects on productivity time in urban areas of Ghana. The primary purpose of this research was to determine how traffic congestion affects worker productivity. The target respondents were the buses, taxis, and other vehicle drivers stuck in traffic congestion. Descriptive analysis was used to analyze the data, and the results showed that an average of 9.4% of the work time was wasted per day, which is a lot in numbers.
Transport expenses include time and distance traveled (Blauwens et al., 2002; Santos, 2004). Both studies highlight external costs like congestion, infrastructural, environmental, and accident costs. In this regard, the study (Piccioni, 2011) compares transportation conditions to economic activity. It relates road capacity to maintenance expenses and an extra cost compensating for unfavorable road externalities. Moreover, the study (Blauwens et al., 2002) distinguishes the various cost categories associated with traffic congestion. Time and travel distance are examples of direct costs. Internal congestion costs are borne by the individual directly responsible for the transportation delays. External congestion costs are borne by parties other than those who caused the congestion. Indirect expenses are those incurred by individuals not directly involved in the congestion issue. Some of these are the costs of re-planning and re-delivering and the opportunity costs of missed meetings and contracts (Golob & Regan, 2001). Lastly, social costs might be categorized as regional or global. Regional emissions, for instance, result in particulate matter, whereas global emissions result in greenhouse gas emissions. CO2 emissions are a significant factor in the latter category, increasing as speed drops (Schallabock et al., 1999).
In 2014, traffic congestion cost around $160 billion due to an increase of 6.9 billion hours spent on travel and the purchase of an additional 3.1 billion gallons of fuel in the United States (sun et al., 2018). The main reason for this increasing congestion cost is that the existing road network can not accommodate additional traffic (Afrin & Yodo, 2020). Also, the aging transportation infrastructure, for example, the conditions of roads, highways, underpasses, or bridges, are usually blamed as inherent causes of traffic congestion (Little, 2002). Afrin & Yodo (2020) Identified and quantified that traffic congestion is crucial for decision-makers to initiate mitigation strategies to improve the overall sustainability of the transportation system. Their research focused on developing a sustainable and resilient traffic management system at the policy level. However, they ignored the cost associated at the individual level.
Khan & Islam (2013) researched the traffic congestion costs in the capital city of Dhaka, Bangladesh. The authors estimated the cost of traffic congestion in monetary terms that the state is facing. This study also calculates travel time, vehicle operating, and externality costs due to travel time delays. The research results show that the annual travel time cost due to traffic congestion was USD 1499 million annually. In contrast, due to road congestion, the vehicle operating cost is estimated at USD 196 million annually. Another study on congestion cost has also been done on the roads of New Delhi, India (Davis et al., 2017). This research provides statistical evidence of the rising economic costs of congestion on major roads in New Delhi. The main factors incorporated in this research were productivity loss, air pollution, costs due to accidents, and fuel wastage.
In contrast to previous studies, the research conducted by (Davis et al., 2017) estimates the overall productivity loss due to traffic congestion. This research also calculates the total loss and productivity loss by each mode of transport. In addition, it was also concluded that public transport contributes more to total congestion costs due to productivity loss as it generates several trips and its occupancy is much higher than other modes of transport, that is, cars and motorbikes. The total cost estimated in New Delhi due to productivity loss is $ 7410 million per Annum, which is expected to increase. The total congestion costs due to air pollutants were $ 730 million per annum, and due to accidents, it was $ 64.95 million per year. In terms of fuel wastage, the study reveals that the cause of more fuel wastage was stalling at signals and long traffic jams. The total fuel wasted on New Delhi roads was approximately $ 1.3 million daily in 2010 (Davis et al., 2017). Therefore, the total congestion costs in New Delhi were $ 8,912 million per year, in which the contribution due to productivity loss was much higher than other factors.
The majority of the previous studies calculated productivity loss and excessive fuel consumption. One study has been performed in the capital of Ireland (EFEU, 2017). The transport department researched the cost of aggravated congestion and how it will grow in the coming decades. This study includes lost time, increased vehicle operating costs, and environmental impacts, but it only measures the value of time lost to commuters due to aggravated congestion. The results after analysis showed that the cost of time loss due to worsened congestion was € 358 million in the year 2012.
In contrast, it was forecasted to increase to €2.08 Billion in 2033. This research also focused on the whole region and did not calculate the individual loss of commuters; it only measured the loss of time. In addition, other indicators should be incorporated to measure the congestion cost. However, vehicle operating and environmental costs were initially mentioned, but this research only counted the time loss.
The United States is considered one of the most congested countries in the world (Jacobs, 2016). The fast-growing economy and increase in urbanization have led to more travel demand, adding Stress on major and minor roads (Burfeind, 2017). As the congestion increases, commuters spend more time on the roads, leading to high lost time, fuel waste, and carbon emissions. The average spending of drivers in metropolitan cities of the United States while sitting in traffic is about 102 hours annually, which costs the city more than $19 billion annually (Schneider, 2018). There was minimal sort of studies have been done related to stress as the majority of people focused on the other indicators of costs. A study was done by (Beland & Brent, 2018) to mainly find the psychological cost of traffic congestion and how people commit crimes due to congestion. The main data rely on the incident reports in the different police stations in Los Angeles from 2011 to 2015.
Recently researchers have developed a methodology for identifying, evaluating the cost, and prioritizing traffic bottlenecks in urban areas (Serok et al., 2022). The authors use network analysis of the entire road network to identify and prioritize traffic bottlenecks based on big data of traffic speed retrieved in near-real-time. In addition, they followed the evolution of every traffic congestion in the entire urban network and ranked all the congestion based on the cost they cause (in vehicle hours units). However, there is a significant limitation to the study in that it considers the cost of traffic congestion in terms of vehicle hours units, which may not be the only relevant measure of the cost of traffic congestion. Also, the road user and ITCC are essential to know.
Few researchers have suggested using congestion cost to reduce traffic congestion on the road. For example, Ayaragarnchanakul and Creutzig (2022) suggested charging at least $2.7 at the entrance for entering the charged zones in Bangkok, Thailand. It was argued that the total external costs burden on Bangkok’s economy is about 7% to 10.8% of the GRP, with almost half originating in congestion. Moreover, the results of the study suggested that urban mobility would benefit most from a combination of congestion and parking pricing, maintaining most of the flexibility of transport In addition, policy directions for overcoming barriers to the implementation of road network pricing as an effective strategy for addressing modern-day urban mobility challenges such as rising urban populations, emissions, and pollution (Ju et al., 2019; Munir et al., 2021).
In the case of Pakistan, a limited number of studies have been performed related to traffic congestion, that is, one study was carried out in the metropolitan City of Karachi to find out the factors that are affecting traffic jams and their impacts on the performance of the economy (Matin et al., 2012). This study shows that the significant issue of a traffic jam is the non-availability of efficient long-term planning. In addition, one study was conducted by (Shahzad, 2017) on the growing traffic congestion problem in the Metropolitan city of Lahore and its effect on the economy. The main focus of this study was economic loss and how to cope with it. The results were calculated weekly and show that the total amount lost due to traffic congestion was $7439 per week in that area.
Furthermore, two studies on public health impacts have been done, one was in the United States (Levy et al., 2010a) and the other in Pakistan (Colbeck et al., 2011). The primary purpose of these studies was exposure to particulate matter (PM) and its impacts on health. The PM is made up of solid and liquid particles that are in the air. It can also be called as dust or dirt. However, the above-mentioned studies were done at the macro level and are not related to traffic congestion at the micro level. The pollution can be connected to other sources, like industrial wastes and emissions. This study is rooted in the realization that previous traffic congestion cost estimation models or methods have primarily been focused on the macro level. These studies focus on broad outcomes such as economic impact at the city level, operating expenses of traffic congestion, loss of personal time, public health or environmental effects. However, previous studies have often overlooked the specific impact of traffic congestion on individual private motorized users. Impacts on them need attention because they form a substantial proportion of road traffic. Our research tries to fill this gap by focusing on private motorized vehicle users and the costs they incur due to traffic congestion. As mentioned, prior research has studied the effects of traffic congestion on aggregate. Also, previous studies often used one or two area-specific parameters to estimate congestion costs, providing a somewhat simplified view of a complex issue. However, this research, in contrast, will undertake a more comprehensive approach, aiming to capture the variety of factors that can influence individual motor vehicle users. Moreover, by researching, we hope to better understand the personal economic burden of traffic congestion. As a result, we can put forward suggestions to alleviate the personal cost burdens that individual road users experience.
Study Area
Two corridors were chosen in Lahore, Pakistan as a case study for this research, in these corridors, individuals are frequently and severely impacted by traffic congestion. These are the selected corridors:
Mall Road Corridor from Canal Junction to Secretariat (5.1 km) (Figure 1)
Circular Road Corridor from Data Darbar to Dehli Gate (2.8 km) (Figure 1)
These two significant roads were the city’s main arteries, connecting residents to its commercial and business centers. The Mall Road is located in the center of Lahore, which becomes quite congested during the morning and evening rush hours. The portion of mall road selected for the study starts from the canal intersection to the civil secretariate (See Figure 1). Eight major traffic jam points are along the chosen part of Mall Road. Similarly, Circular Road has a high volume of traffic because it is surrounded by commercial areas and some of the city’s largest markets.

Traffic jam points map.
Additionally, there is no designated parking on Circular Road. As a result, local commerce is frequently disrupted by traffic jams. The section of the circular road that was investigated extends from the Ek Moriya pull to the Bhatti Chowk (see Figure 1).
This study identifies four factors that can affect private motorized vehicle users during traffic congestion: lost productivity time due to traffic delays, extra fuel consumption while stuck in traffic, increased maintenance costs due to slow movement of the vehicle, and constant foot on the brake exerting pressure on the engine, and Stress caused by environmental pollution, which reduces the productivity of an individual.
Materials and Methods
The methodology mainly consists of four steps starting with the literature review. This is done to identify the congestion cost indicators affecting motorized vehicle users. After identifying indicators, the next step is to propose particular cost estimation methods. In this step, the ITCC equation is proposed to estimate the congestion cost for individual using private motorized vehicles to commute in the city. The collected data is then analyzed in step four using proposed formulas for each indicator and then summarizing all those estimated costs in ITCC equations. Also, some statistical tests were performed to find the effect of socioeconomic factors on individual costs, like ANOVA and T-test. Finally, the findings and conclusion are drawn based on the results.
Identification of Traffic Congestion Costs Indicators
There is minimal research on finding the stress cost, especially in developing countries. However, a developed country like the United States (Beland & Brent, 2018) has studied the psychological cost of knowing the relationship between traffic and crime. Gee & Takeuchi (2004) conducted a study to examine whether health is associated with individuals perceiving traffic stress or not using multilevel analysis. The result shows that the person facing traffic congestion was more stressed than those who faced less vehicular burden. These stresses were associated with lowered health status and more significant depression symptoms. Although stress is critical and can reduce productivity, studies have rarely been performed to calculate that. After reviewing the literature, productivity time, fuel consumption, maintenance cost, and stress level were selected to estimate the individual cost of private motorized vehicle users due to traffic congestion. Table 1 summarizes the literature review to extract the indicators.
Traffic Congestion Indicators.

Proposed Cost Estimation Method
After identifying the indicators, the next stage is to propose a technique for estimating the individual traffic congestion costs for users of private motorized vehicles. The ITCC equation (See Equation 1) incorporates the cost of each of the four recognized variables identified in step 1. Since each of the four identified indicators impacts ITCC differently, assigning specific coefficients to them necessitates formulating the ITCC model as demonstrated in Equation 1. Previously established models for similar research inspire this method (Ahmed et al., 2021; Anjum et al., 2019; Asadi-Shekari et al., 2015; Labdaoui et al., 2021). The Coefficients of each indicator demonstrate their significance since each one will have a different impact on the calculation. This method is provided for estimating the cost incurred by those impacted by traffic congestion. The proposed ITCC is shown in Equation 1.

Where
ITCC = Individual traffic congestion cost
RCt = Related cost of productivity time
Ct = Coefficient of productivity time
RCf = Related cost of fuel consumption
Cf = Coefficient of fuel consumption
RCs = Related cost of stress level
Cs= Coefficient of stress level
RCm = Related cost of maintenance
Cm = Coefficient of maintenance level
Descriptive analysis was used to find the Coefficient of each indicator related to an individual’s motorized vehicle users. The coefficients state the importance of each factor that affects the people working in the study area. The mean of each indicator was the Coefficient after normalization. As the coefficient values are between 1 and 4, the mean of each value increases the cost dramatically if added to the ITCC equation. This method of defining the Coefficient for the indicator from the questionnaire has been utilized in previous research; for example, Ahmed et al. (2021) used the mean of each indicator as the Coefficient (Ahmed et al., 2021). The current study also follows the same approach and adds a questionnaire to estimate the importance of the indicators. However, we also normalized the coefficients for each indicator. Also, the Coefficient normalization was used to see the effects of costs to justify which is more related and which is less. In the normalization of the Coefficient, the highest mean value is written as 1, and all the remaining values can be calculated based on the ratio of each indicator’s mean value to the highest mean value. All Coefficient values were between 0 and 1, so the value closer to reality was extracted.
After weighing the congestion costs, the congestion costs are calculated through some proposed mathematical formulas and ITCC equation (refer to Equation 1). The formulas are Productivity time cost (refer to Equation 2), Fuel consumption cost (refer to Equation 3), Maintenance cost (refer to Equation 5) and Stress level cost (refer to Equation 4).


After estimating all the costs and Coefficient of each indicator, the values are then put in the proposed cost estimated Equation (refer to [Equation 1]) and sum all these values to find the ITCC effect due to traffic congestion.
In addition to the descriptive analysis, inferential statistical analyses (ANOVA and the t-test) were also utilized. Preliminary evaluations justified using the equal variance t-test in our analysis. Before applying this test, we conducted Levene’s test to assess the variance between groups, which confirmed that the variances were equal. Furthermore, we also ensured that data was normally distributed for the samples with the Shapiro-Wilk test through the visual inspection of histograms.
Sampling and Sample Size
The sampling method used in this study is the purposive sampling method. This technique shows the total target population and the objectives of this study. In this case study, the target population includes those working in the study area. They are mainly employed by private sectors, business people, and some government officials who own private vehicles and are stuck in traffic congestion. The authors personally administered the questionnaire to participants to ensure the collected data’s credibility. The respondents directly interacted with the surveyors, which was helpful since they could clarify any ambiguities in the questions and ensure that the respondents understood them correctly.
However, in order to calculate the sample size for this research, Krejcie and Morgan sample size method is used. It is an efficient method of determining the sample size of a given population. The Equation below calculates a given area’s sample size (Krejcie & Morgan, 1970).

Where
n = sample size
N = population size = 11,126,285 (Lahore city in 2017)
e = sampling error = 6%
X 2 = chi-square with degree of freedom 1 and confidence level 95% = 3.841
p = proportion of the population (if unknown, 0.5)
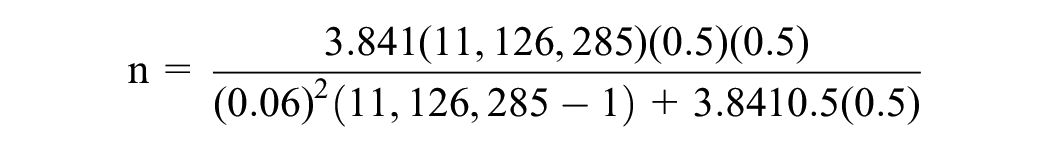


So the sample size with a 6% sampling error and 95% confidence level is 266. This study aimed to collect 300 samples, but due to half-filled questionnaires, the total number of samples collected during the survey was 282. The questionnaire distribution in the target areas was equally balanced so that maximum responses could be gathered from both study areas. Moreover, the study mainly targets the employed who owned a private vehicle working along the selected corridors and stuck during traffic congestion. The reason for getting a sampling error of 6% is due to time constraints as there is limited time to complete this study, so the optimum sampling error for this study is 6%.
Effect of Socioeconomic Factors on Congestion Costs
The effect of socioeconomic factors on individual congestion costs was found by performing T-test and ANOVA tests. Both tests are a statistical analysis mainly used to find significant differences among different groups. A T-test compares two variables and their mean and tells you if they are different from each other. Similarly, the ANOVA test compares the means of more than two groups or levels of independent variables.
Likewise, in this study, to find the effect of gender on congestion costs, a T-test is used. However, an ANOVA test is employed to examine their effects when comparing socioeconomic factors with more than two groups for individual congestion costs. An ANOVA test is used to see whether there is a significant difference between the means of the groups. If a significant difference is found, it does not provide information on which specific pairs of groups differ significantly. In addition, several post hoc tests can be performed on the ANOVA results to identify the pairs of groups that are not equal. It is important to note that these post hoc tests are conducted after the completion of the ANOVA and are only performed if the null hypothesis is rejected. The post hoc Tukey test was used in this study for multiple comparisons. The p-value used in this study is .05, representing the probability of obtaining the observed results assuming no difference or association (null hypothesis) between the compared groups or variables. It is crucial to emphasize that the null hypothesis refers to the absence of a difference or association rather than being a statement of truth. The primary objective of this study is to apply these statistical techniques to determine the impact of demographics on traffic congestion costs.
Analysis and Results
Individual Congestion Cost Calculations
Table 2 shows the Coefficient of each indicator. The mean productivity cost is 3.649, which is the highest, and the stress cost place with 3.248. Furthermore, the mean for fuel cost comes third with 2.0567, whereas the maintenance cost secured the last spot with 1.032 mean. This means stating the importance of each indicator for the people. It was asked from the respondents during a survey to prioritize their significant individual costs. All these means are then normalized to get the value closer to reality. As a result, the Coefficient of productivity cost is considered the most crucial indicator in terms of individual congestion cost for private motorized vehicle users, so it is given the value of 1.00.
Coefficient of Individual Cost Indicators.

The rest of the Coefficients are calculated based on the highest mean value is 3.649 (productivity cost). For instance, fuel consumption cost with a mean of 2.057 is normalized by dividing it by the highest mean value, 3.649, resulting in a normalization value of 0.56 (2.057/3.649 = 0.56). The process is followed for maintenance cost and stress level cost, resulting in the normalized values of 0.28 and 0.89, respectively. After productivity cost, the second most important indicator for the respondents is stress level cost. During the survey, the respondents replied that due to these daily congestions, their stress level increases, affecting their efficiency and leading them to different diseases, that is, blood pressure, diabetes, and heart diseases. Figure 2 shows the range of Coefficients for individual cost indicators.
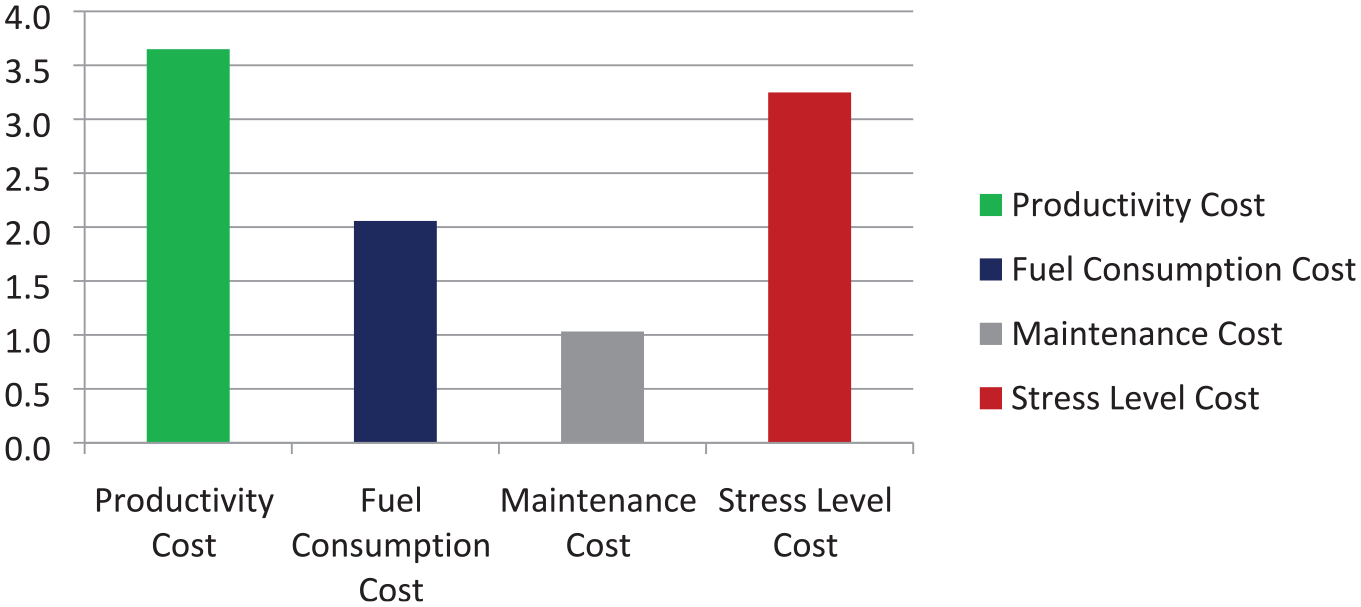
Coefficient of individual cost indicators.
To calculate that cost, the proposed formulas congestion costs have been used (Equations 2–5). After calculating the individual costs of all indicators, it is then added in ITCC equation (Equation 1). In this way, ITCC values can be estimated for each individual.
Based on the above calculations, Table 3 represents the minimum, maximum and mean costs for all four individual traffic congestion costs indicators and ITCC value for private motorized vehicle users. The ITCC value ranges from 17.29Rs to 1136.88Rs per day, which is enormous. These values showed the private vehicle owned by the respondents, that is, the value inclined toward minimum value represented the respondent having a motorbike which consumes less fuel than other vehicles. Its maintenance cost is also very low, whereas the value towards maximum resulted in the ownership of the car by the respondent who consumes more fuel and maintenance cost is high. Figure 3 represents the lowest and highest individual congestion costs incurred by private motorized vehicle users.
Individual Traffic Congestion Costs.

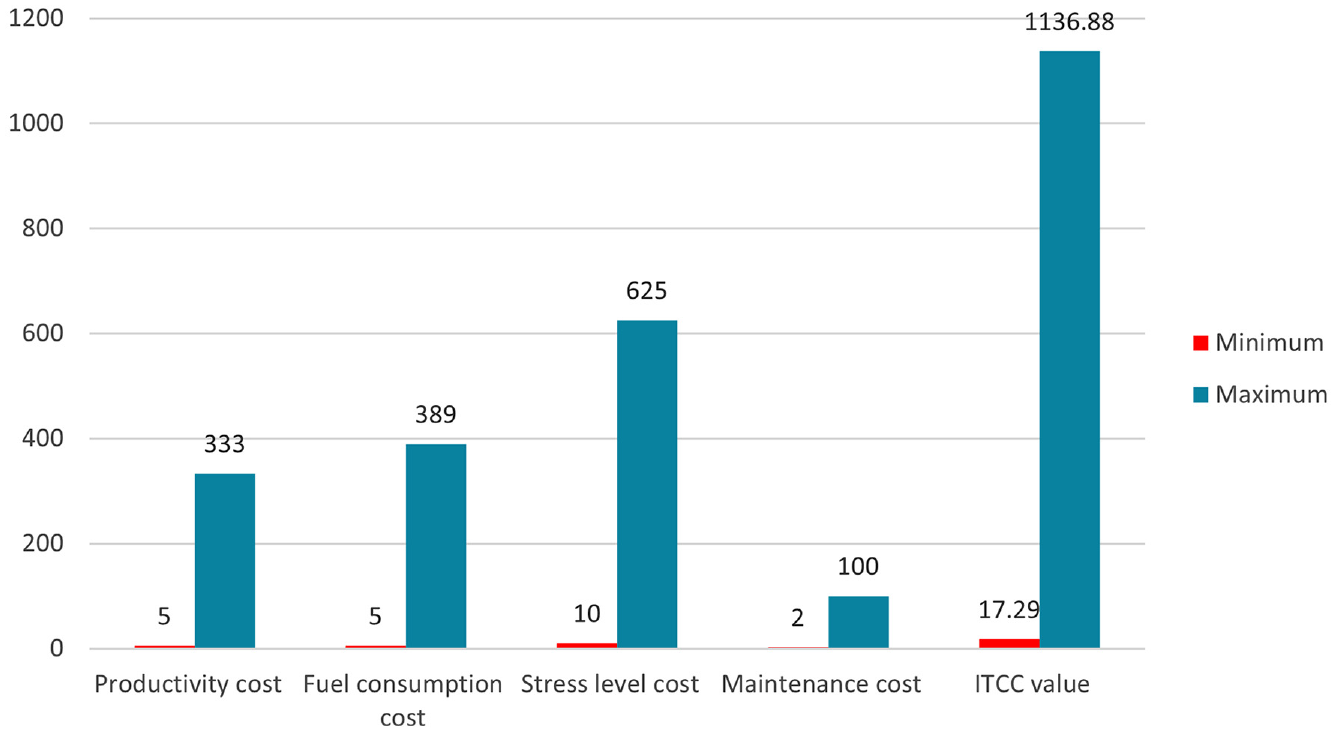
Individual traffic congestion costs.
Effect of Socio-Demographic Factors on Individual Costs
Effect of Gender
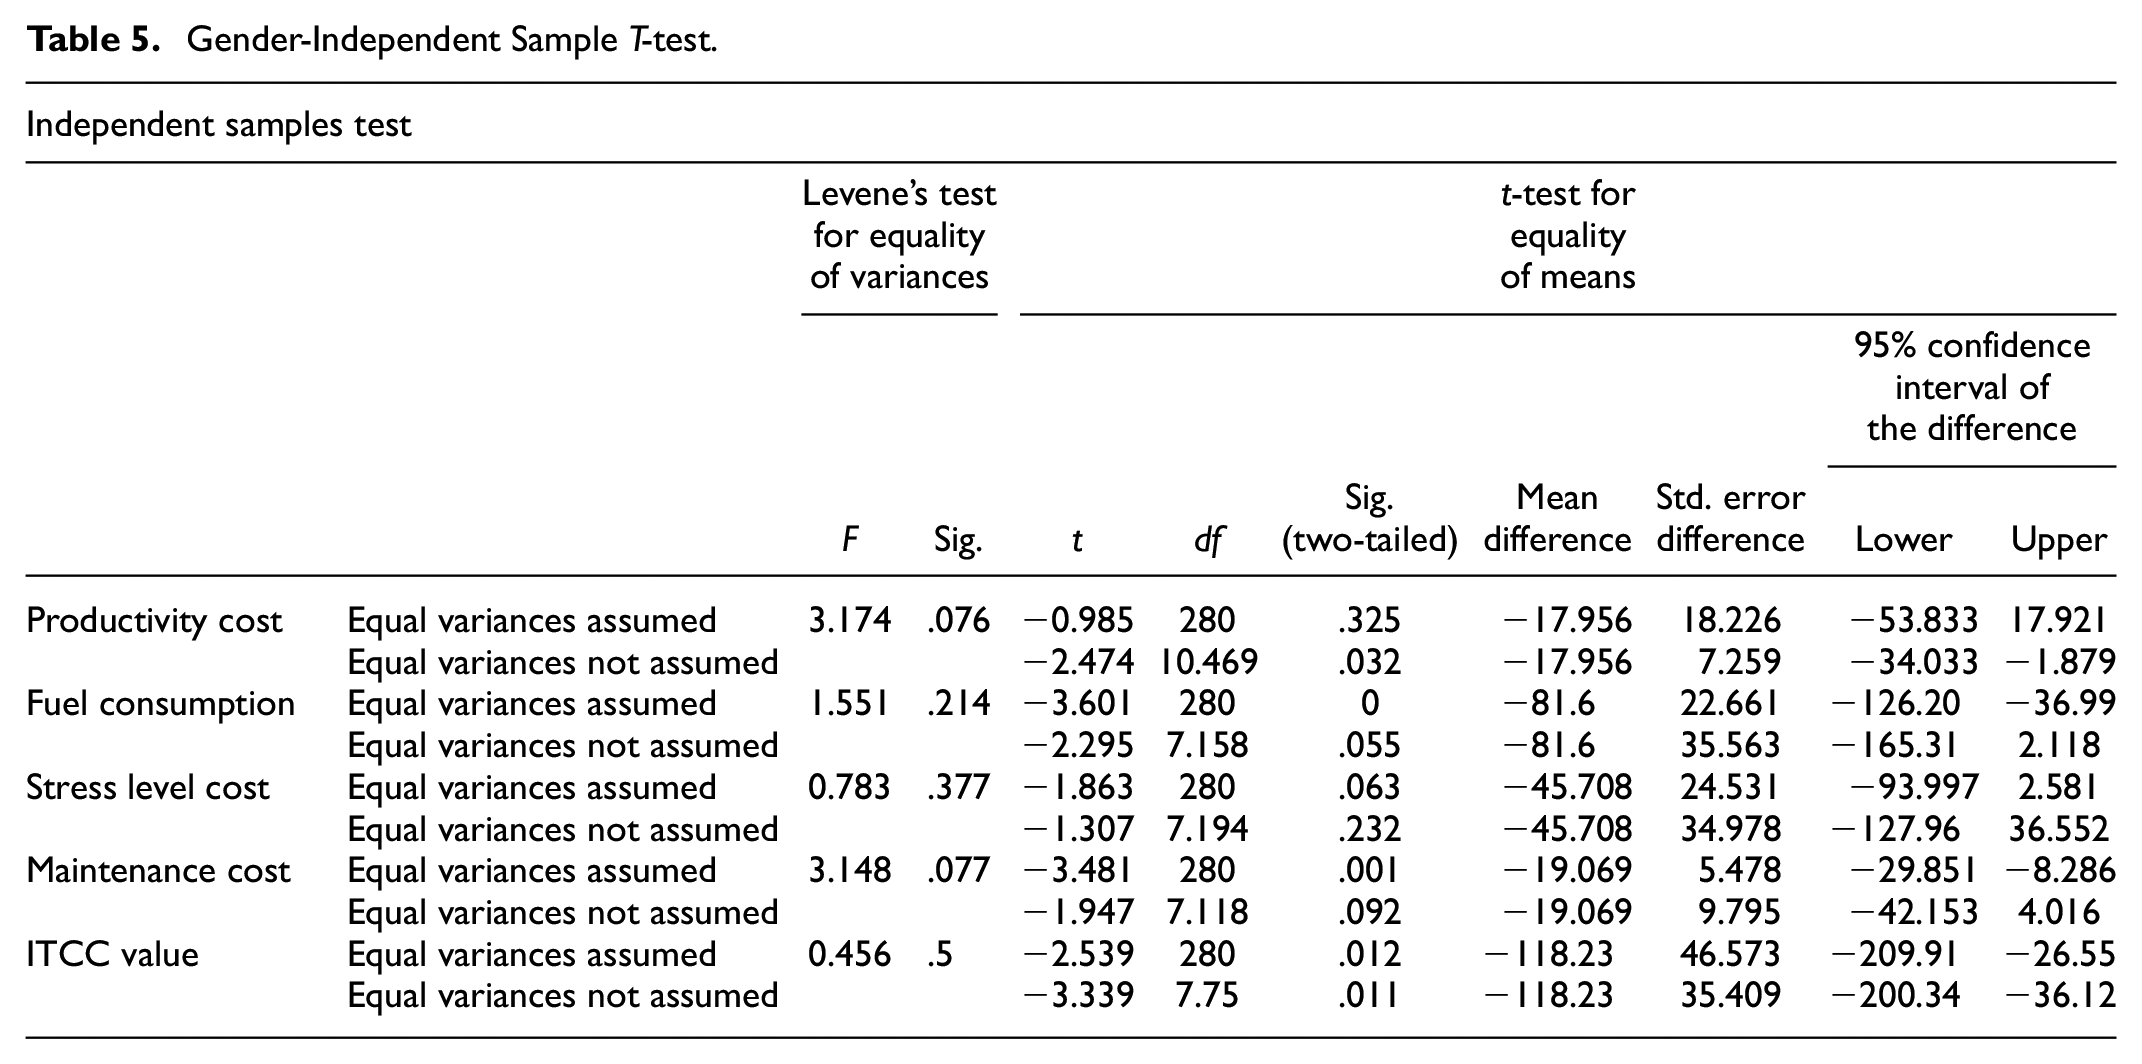
An independent T-test was conducted on all estimated costs to know any significant difference between males and females. As the p-value is .32, which is higher than .05, it suggests that there is no effect on productivity cost due to males and females. Similarly, for fuel consumption, the p < .001 indicates that it is affected due to gender differences. Female respondents have more fuel consumption costs due to car usage than males, who use motorcycles frequently, which consumes less fuel.
Furthermore, the result shows no effect on stress level cost due to gender differences, as the p-value is more significant than .05. The test revealed a statistical difference in the male and female scores for maintenance costs, suggesting that female respondents have more maintenance costs than male respondents due to car usage. Lastly, on ITCC cost, the test revealed that it is affected due to gender differences and female respondents have more ITCC costs than male respondents as they used cars with more fuel and maintenance costs. Tables 4 and 5 show the detailed T-test results.
Gender Group Statistics.

Gender-Independent Sample T-test.
Effects of Age Limits
ANOVA test was performed to find the effect of age limits on individual costs. There was a significant effect of different age groups on productivity cost at the p < .05 level for the three conditions. The results suggest that the effect of the age group >40 is higher on productivity cost than the remaining age groups <20 and 20 to 40. The reason is that the respondents, having more than 40 years, owned a car and their salary was also very high, so they consume more time in traffic congestion than a motorbike. Therefore their effect on productivity cost is more than other age groups. Similarly, the fuel consumption one-way ANOVA test revealed that the effect of the age group >40 on fuel consumption cost is much higher than other age groups. The reason is that the age group >40 owned a car, so they consume more fuel when stuck in traffic congestion than other age groups.
Furthermore, the test revealed that the effect of the age group >40 on Stress and maintenance cost is much higher than the other age group. The reason is that they are older than other age groups, and most suffer from diseases, that is, blood pressure, diabetes, etc. So they cannot bear the traffic congestion nuisance, resulting in increased stress levels, affecting efficiency and reducing work productivity. Also, the age group >40 owned a car, and when they are stuck in traffic congestion, it exerts extra pressure on the engine due to the continuous slow movement of the vehicle, which increases the maintenance cost. Lastly, the ANOVA test was conducted to compare the effects of different age groups on ITCC value. The result suggests that the impact of the age group >40 is higher on ITCC value than the remaining two age groups <20 and 20 to 40. The reason was that the age group >40 owned a car, and their salary was high, so they had higher ITCC value than other age groups. Tables 6 and 7 show the detailed results.
ANOVA Test for Age Limits.

Post Hoc Tukey Method for Age Limits.

Effect of Income Level
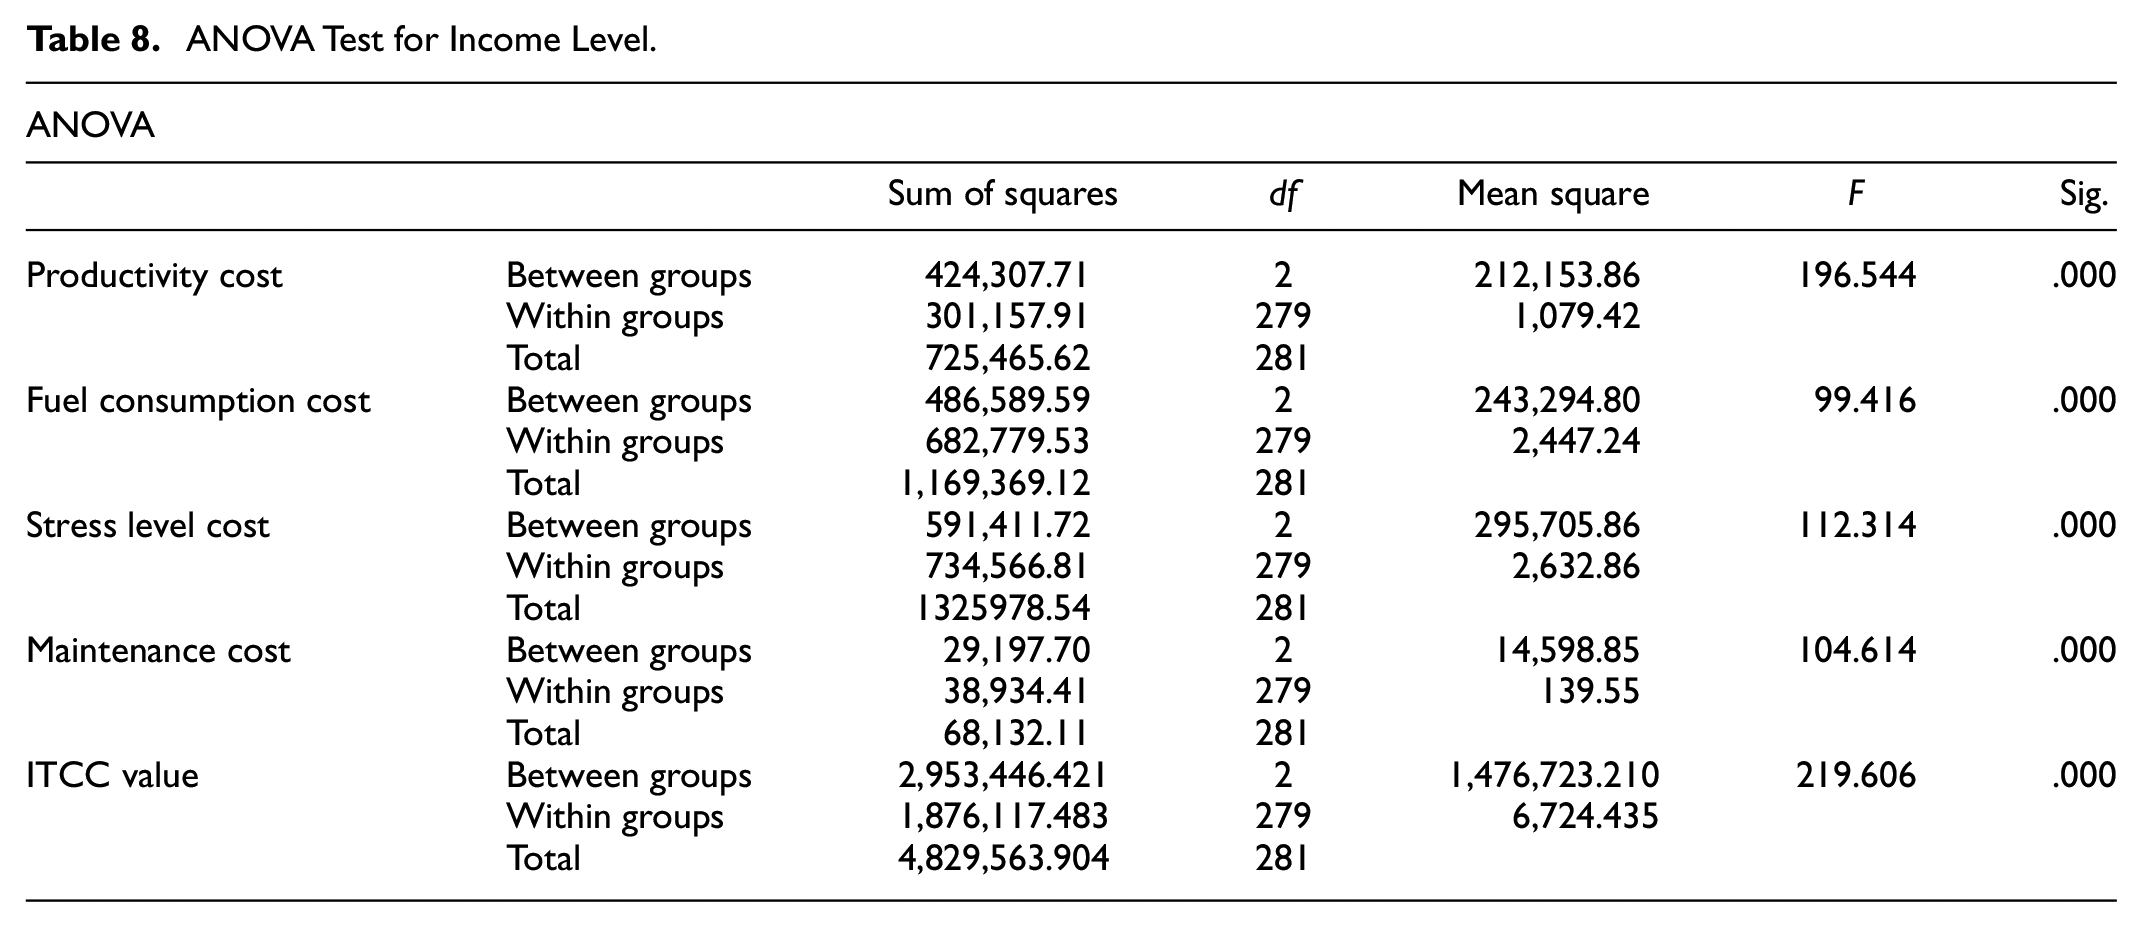
ANOVA test was performed to find the effect of income level on all individual costs. The results suggest that the income level >45,000Rs has a high impact on all individual cost indicators compared to other income groups <15,000Rs and 15,000Rs – 45,000Rs. The reason behind the high effect was that the income group >45,000Rs owned a car and got stuck for more time in traffic congestion due to more width and slow movement, which increased productivity and fuel consumption. Furthermore, the income level >45,000Rs are, mostly falling in age more than 40 years and they own a car so when traffic congestion occurs, their stress level increases and also, mostly respondents of this group is suffering from different diseases, that is, blood pressure, diabetes, etc. So these acts as a catalyst for increased stress levels during congestion. Lastly, the ITCC value for income group >45,000Rs is higher than other income groups. The high value is because they own a car and consume more fuel and consumption costs. Also, their productivity cost is higher due to more time in traffic congestion. Tables 8 and 9 shows the detail of the ANOVA test.
ANOVA Test for Income Level.
Post Hoc Tukey Method for Income Level.

Effect of Marital Status
The effect of marital status on individual costs was discovered by using the T-Test. The result suggests that married respondents have a higher impact on all congestion cost indicators than single respondents. This is because they owned a car that stuck them more in traffic congestion due to slow movement, increasing productivity time loss, fuel consumption and maintenance costs. Moreover, the stress level among married respondents is also high due to family problems and traffic nuisances. Lastly, the ITCC value of married respondents is also higher than single respondents due to the abovementioned reasons. Tables 10 and 11 show the detailed results.
Group Statistics of Marital Status.

Independent Sample T-test for Marital Status.

Effect of Vehicle Type
The T-test was performed to reveal the effect of vehicle type on all individual costs. The result suggests that the respondents who owned a car have a higher impact on traffic congestion cost indicators than motorbike respondents. This is mainly due to more time spent by car respondents in traffic congestion, increasing their productivity time loss and fuel and maintenance costs. Also, car respondents are primarily married and suffering from some disease, which increases their stress level cost when stuck in traffic congestion. Lastly, the ITCC value for car respondents is higher than for motorbikes due to the abovementioned reasons. Tables 12 and 13 shows the detailed results.
Group Statistics of Vehicle Type.

Independent Sample T-test for Vehicle Type.

Effect of Job Type
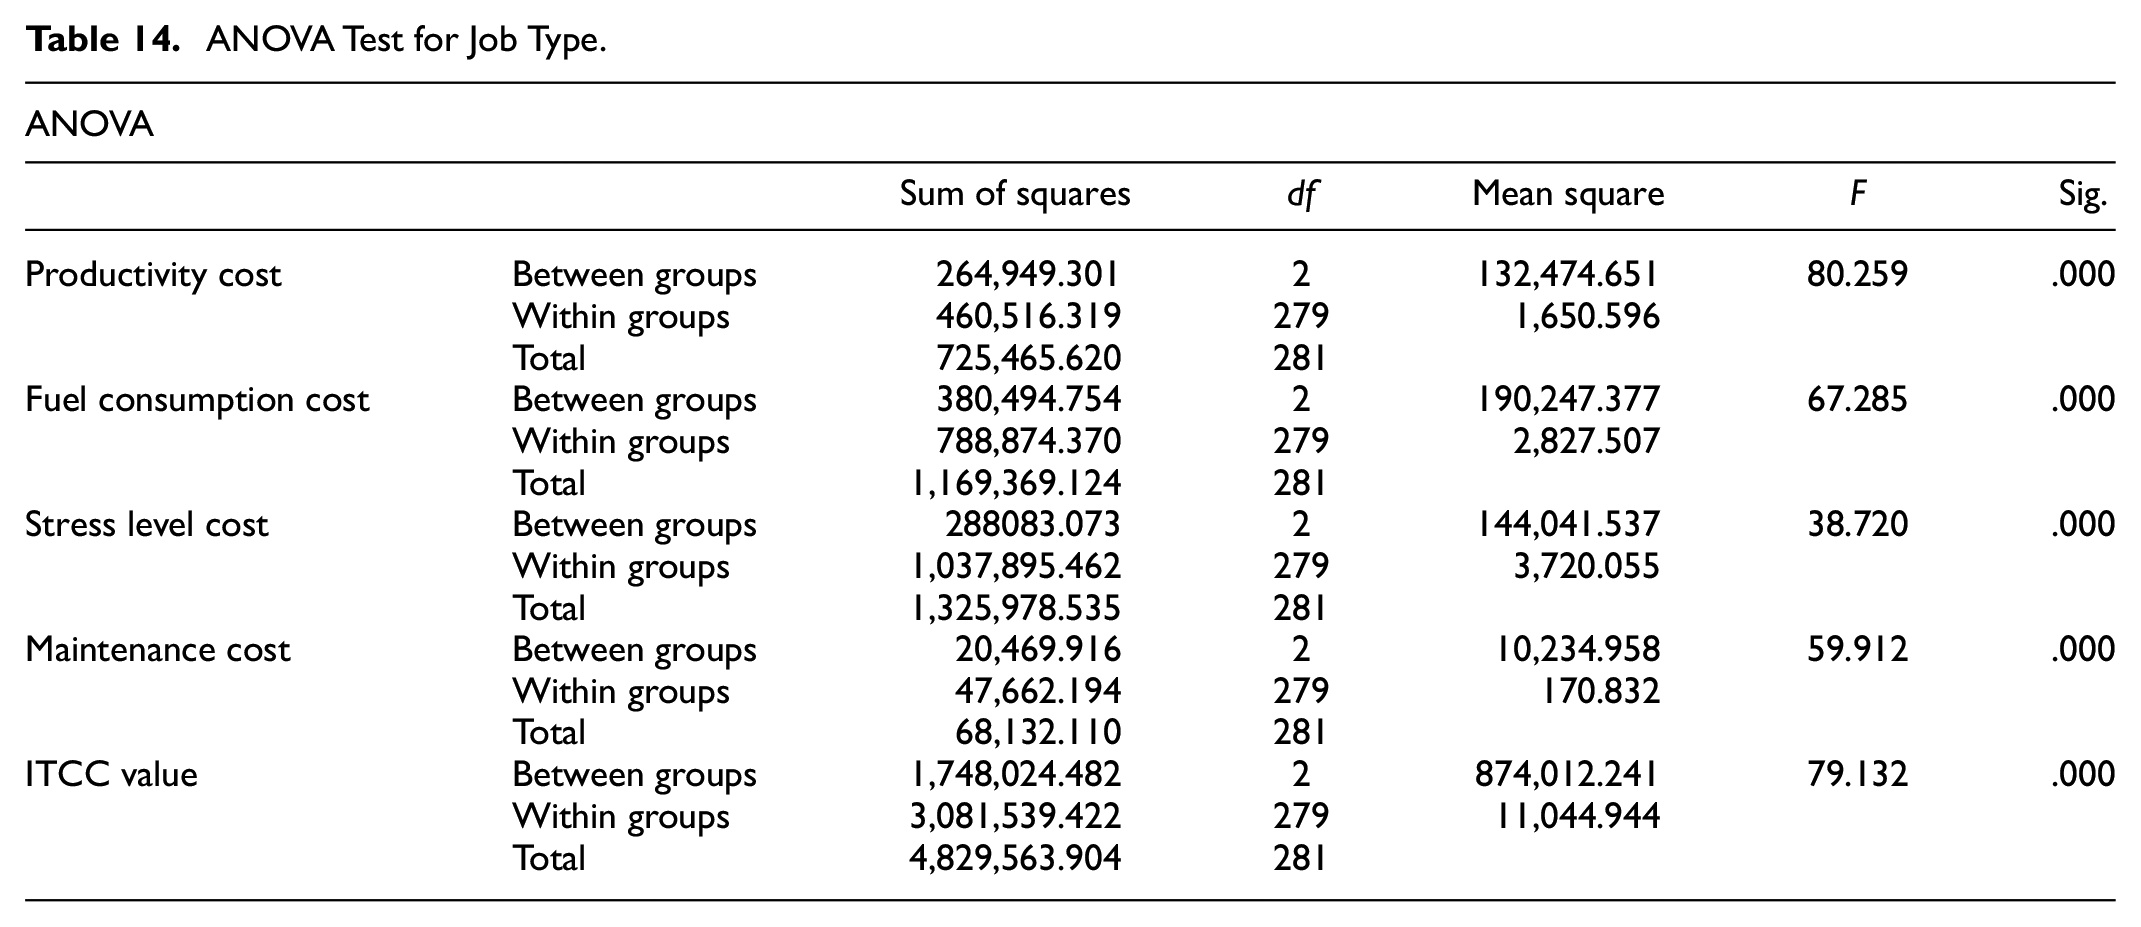
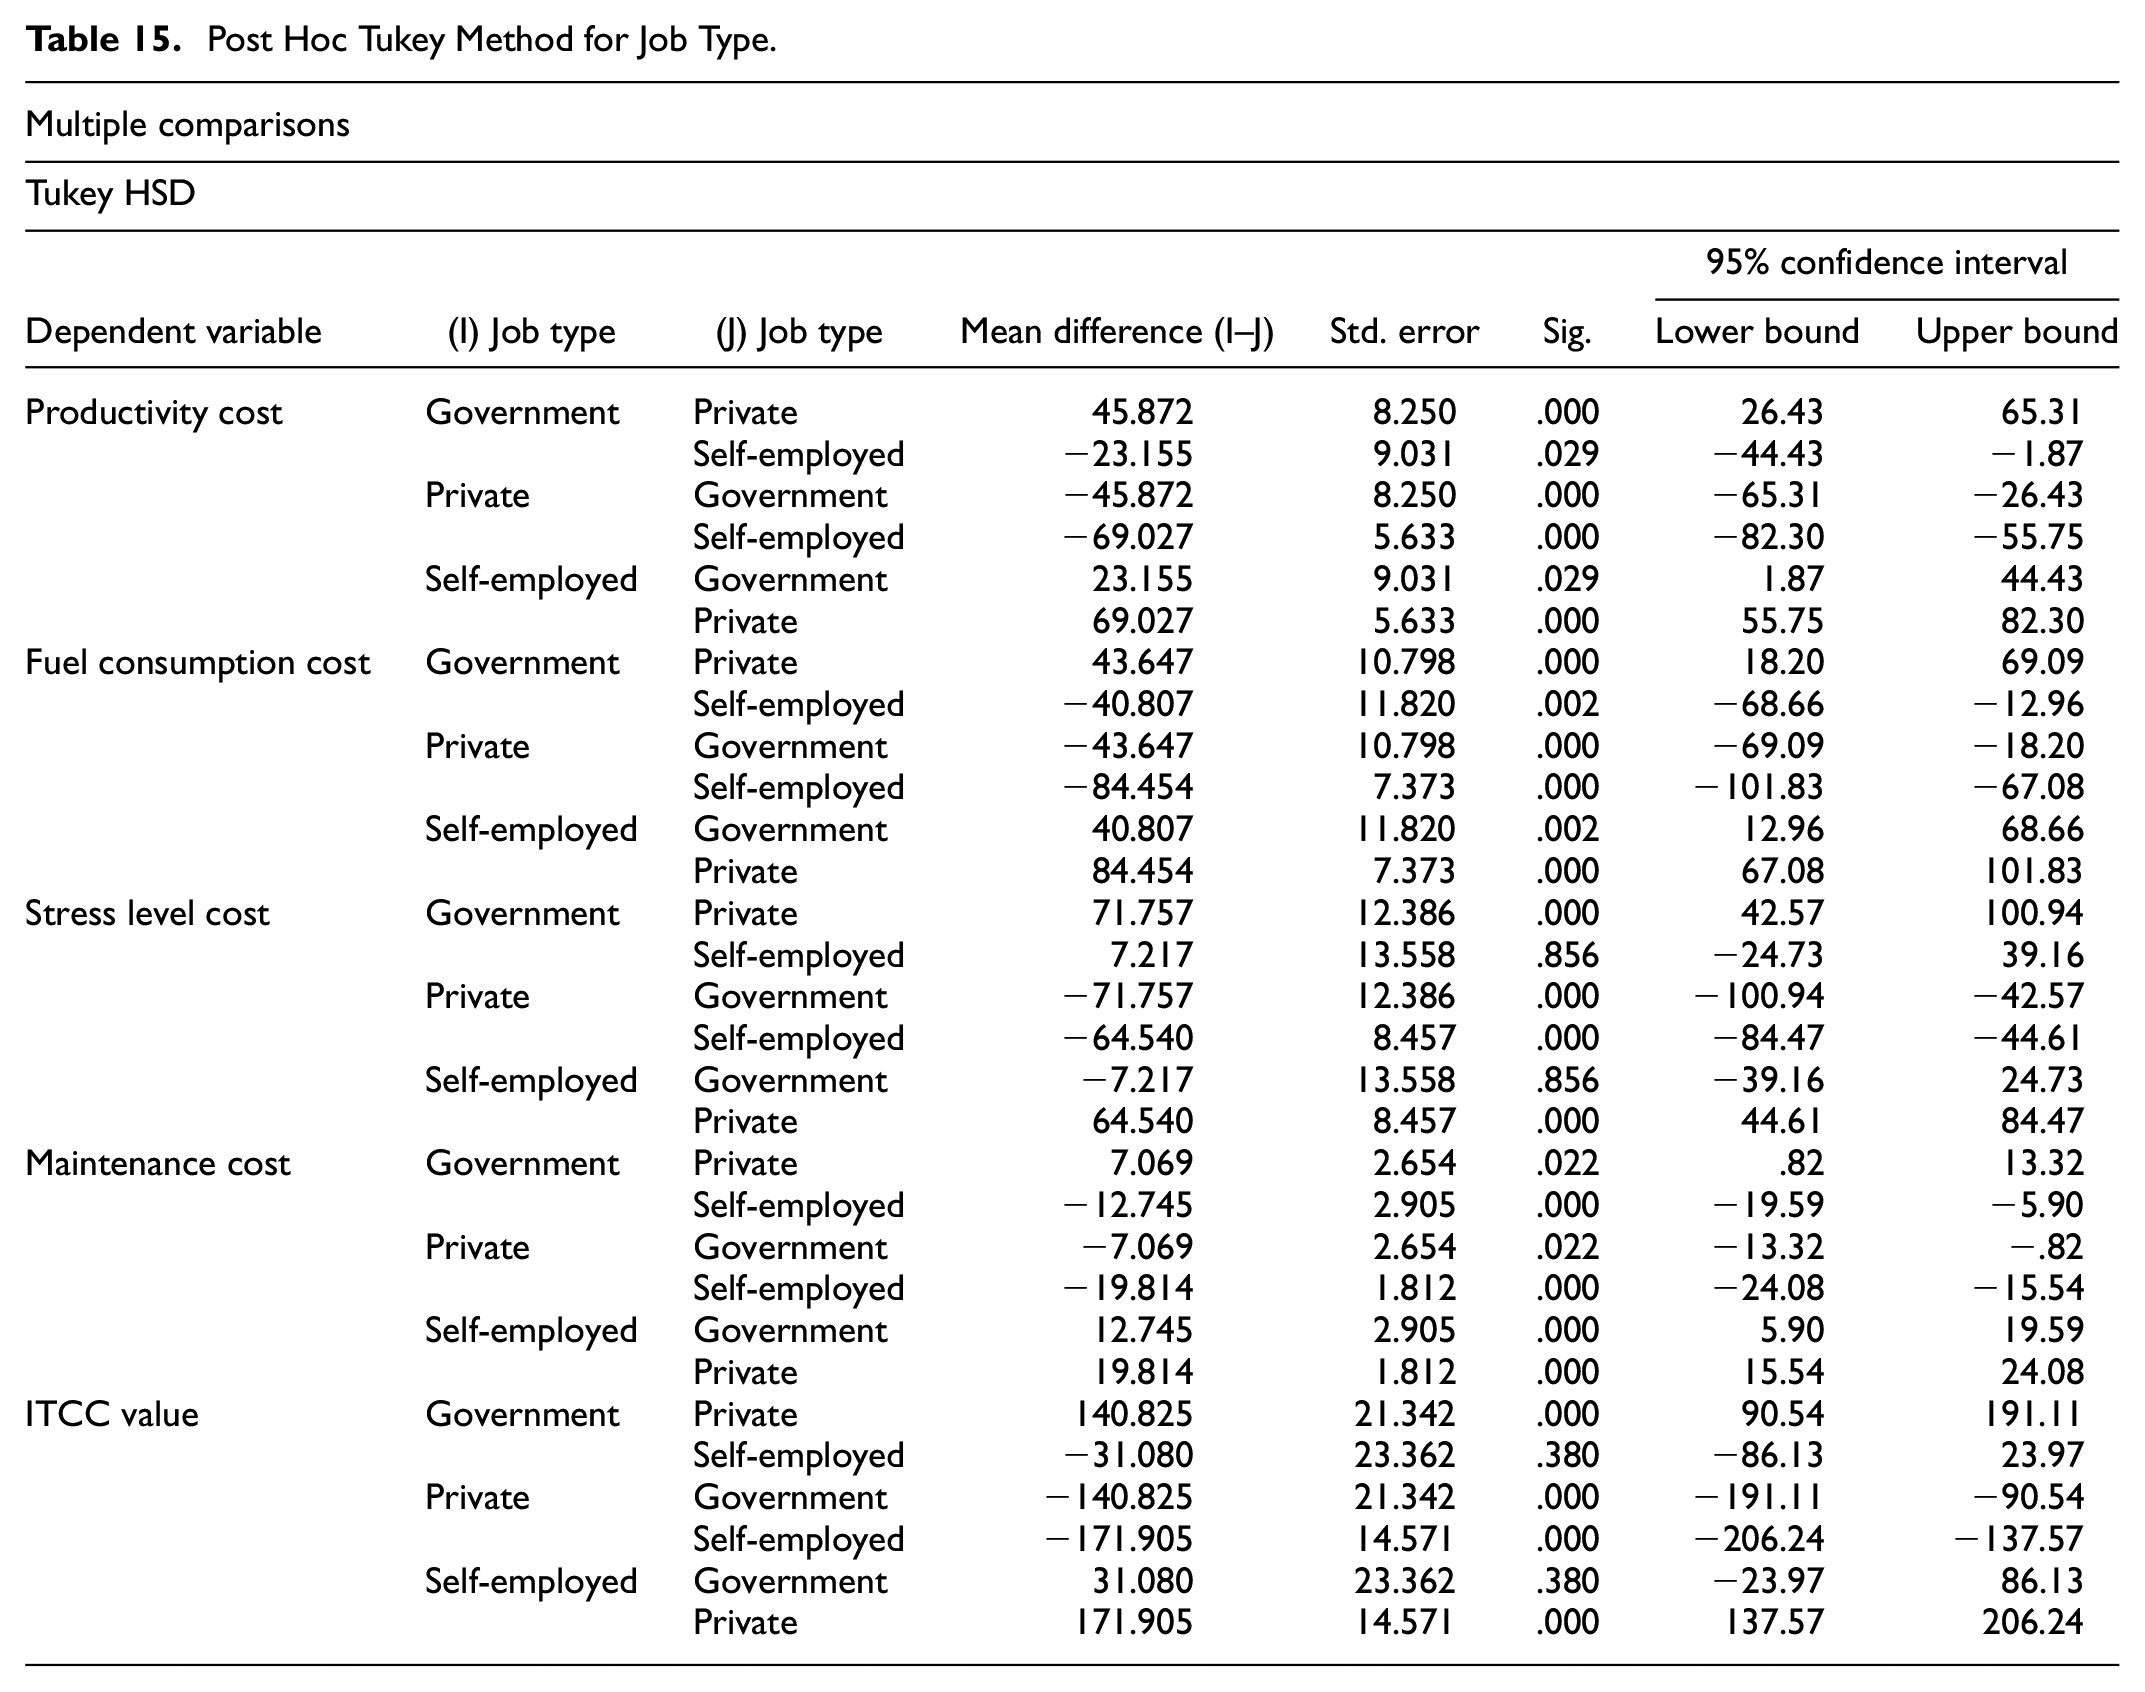
ANOVA test was performed to find the effect of job type on individual congestion costs. The result suggests that the self-employed affect congestion cost indicators more than the private and government sectors. The reason is that they owned a car stuck for a longer time during traffic congestion, decreasing production time and increasing maintenance and fuel costs. Also, due to business stress and other issues, self-employed people suffer from different diseases, which increase their stress levels during traffic congestion. The ITCC value is also higher for self-employed respondents than for the other two job types. Tables 14 and 15 shows the detail of the results.
ANOVA Test for Job Type.
Post Hoc Tukey Method for Job Type.
Discussions and Conclusions
Traffic congestion is a prevalent problem in urban areas around the world. It usually occurs when the demand for transportation exceeds the capacity of the road infrastructure, resulting in slower speeds, longer travel times, and increased frustration for drivers (Ye et al., 2013). Although traffic congestion and air pollution costs may overlap, as most previous research has studied, there are still significant differences (Ju et al., 2019). Congestion costs refer to the delays in travel time caused by traffic congestion, including both opportunity costs and intrinsic costs compared to smooth driving. Moreover, traffic congestion costs can significantly impact individuals who use private motor vehicles (Ju et al., 2019)—the present paper aimed to quantify the congestion cost for private motorized vehicle users.
Previous studies agreed that traffic congestion has various costs, that is, travel time delay, environmental cost, air degradation cost, PM 2.5 particulate, etc. (Arnott & Small, 1994; Ye et al., 2013). However, all these indicators cannot be used to estimate the individual cost; for example, environmental damage can be done due to industrial pollution, human waste, and traffic pollution (Anjum et al., 2019). Measuring how much the individual contributes to environmental damage due to traffic congestion is pretty impossible. Measuring the mentioned cost, that is, environmental damage or economic cost of traffic congestion, is essential. Vast studies in the literature have already undertaken this (Chin, 1996; Singh et al., 2023; Wang et al., 2023).
Nevertheless, we must also consider the individual suffering most from it. Past research has indicated that four variables directly affect an individual cost. Productivity, fuel consumption, stress level, and maintenance cost were these indicators (Beland & Brent, 2018; BTRE, 2007; Jayasooriya & Bandara, 2017). Our study validates previous research findings, confirming that an individual’s costs are directly influenced by four primary variables: productivity, fuel consumption, stress level, and maintenance cost. For example, The productivity cost ranged from a minimum of Rs 5 to a maximum of Rs 333, with a mean of Rs 67.68. On the other hand, the fuel consumption cost had a broader range for the study area, ranging from Rs 5 to Rs 389. These costs reflect the financial implications of traffic congestion for individuals using private vehicles to commute.
It is often observed that higher productivity can result in decreased costs, given that it can lead to improved efficiency and potentially higher income. Fuel consumption, as another factor, obviously impacts cost, particularly for individuals who depend on vehicles for their livelihood or personal transportation. Furthermore, our research echoes prior studies that show a correlation between stress level and congestion cost. These indicators are previously less considered. Stress can lead to several associated costs, such as healthcare expenses or decreased productivity, resulting in financial strain. Lastly, maintenance costs for vehicles, homes, or other personal or professional equipment directly influence an individual’s overall expenditure. Regular upkeep and unexpected repairs contribute to these costs and can significantly impact an individual’s budget. Therefore, our study substantiates previous findings by emphasizing the impact of these four variables on individual costs, underlining the importance of considering these elements in personal and professional cost management strategies.
The study results indicate that productivity time was considered the most critical indicator for respondents in monetary terms, as reaching the office late reduced their work time and increased their costs. It should be noted that this has been studied widely but at a broader level, for example, city level. Jayasooriya & Bandara (2017) has proposed an analytical method to calculate the value of time and additional fuel consumption cost in the context of Srilanka (Cvetek et al., 2021). In our study, we, however, have considered it for individuals. Calculating such costs at an individual level can provide personalized insights for individuals to make more informed transportation choices and decisions, which could ultimately lead to potential cost savings. The stress, fuel consumption, and maintenance come in descending order after productivity time. In addition, nuisance and other things created during congestion affect the commuter mentally, disturbing them automatically and increasing their stress level. Also, extra fuel is wasted due to the slow traffic movement and constant running of the engine. Additional maintenance costs are incurred due to the driver’s constant foot-on break during congestion, which applies unnecessary load on the vehicle engine. A study conducted in Karachi, Pakistan, estimates that Pakistani Rs. 1 million are lost daily due to traffic congestion on a selected arterial route, which is extrapolated for the entire city (Ali et al., 2014). The research considered the total amount is determined by a combination of the costs incurred due to excessive congestion-related delays and the expenses associated with fuel consumption at the city level. We, however, estimated extra fuel costs due to congestion for individuals. It was achieved by surveying the respondents in the target area.
The study proposes an individual congestion costs for private motorized users were then estimated by proposing mathematical formulae and ITCC equations. The minimum values show the respondents who owned a motorbike and their salary was low compared to the maximum value respondents who owned a car, and their pay was more. In addition, the population proportions for all socio-demographic factors have been identified through descriptive analysis. The analysis revealed that most respondents were male because most females use public transport to reach their office or their relatives drop them off. Similarly, most respondents were between 20 and 40 years old, meaning that most are young and married. This analysis also revealed that most of the respondents used a motorbike as their mode of transportation compared to a car. It shows that the income level in the study area is not very high. Furthermore, the people doing private jobs were in excess compared to the government employed and those doing their business. This population proportion shows the socio-demographic characteristics in the study area.
Lastly, the statistical test (ANOVA and T-test) revealed that almost all the socioeconomic factors affect the individual cost indicators and ITCC values. For example, in gender, the result showed that females were more affected as they used cars that consumed more fuel and got stuck in traffic. Similarly, for different age groups, the result revealed that people over 40 years have a higher ITCC value than other age groups due to their high income and use of cars as a mode of transportation. The survey also revealed that this age group’s high-stress level leads them to different diseases, that is, blood pressure, sugar, etc. Furthermore, higher-income respondents owned a car, and their ITCC value increased due to more stuck in traffic and wasting time. Overall, it can be seen that the socio-demographic factors are very effective for individuals in monetary terms.
Recommendations for Further Studies
We have derived an analytical method to calculate ITCC. The study has successfully calculated the values for traffic congestion costs for individuals. However, to improve the accuracy and scope of future research on the topic, more traffic corridors and extreme weather situations could be considered, as this study cannot represent extreme weather situations because the information gathered during the survey is limited to normal weather circumstances. Also, we considered two traffic corridors. In addition, increasing the sample size and incorporating alternative data sources such as traffic data and maintenance reports would be interesting to see. Also, it can help in validating the study results. Additionally, the study cannot determine the exact cost of individual congestion for two primary reasons. (1) Since fuel costs constantly fluctuate on the market, the cost of fuel usage will also change. (2) Calculating the maintenance cost due to congestion is impossible because the damage might be caused elsewhere. So it is crucial to address the fluctuations in fuel costs by regularly updating fuel cost calculations. Future studies should conduct a comprehensive examination on a larger scale to achieve more precise results. Because due to time constraints, the study was conducted on a small scale and covered a small area; therefore, a comprehensive examination is required for more precise results. In addition, a comparison can also be made with the results of this study.
Footnotes
Acknowledgements
The researchers would like to thank the Deanship of Graduate Studies and Scientific Research at Qassim University for financial support (QU-APC-2024-9/1).
Declaration of Conflicting Interests
The author(s) declared no potential conflicts of interest with respect to the research, authorship, and/or publication of this article.
Funding
The author(s) received no financial support for the research, authorship, and/or publication of this article.
Data Availability Statement
The datasets used and/or analyzed during the current study are available from the corresponding author on reasonable request.