
Abstract
We aimed to estimate and compare networks of work addiction among Norwegian and Polish working individuals. The Bergen Work Addiction Scale was used to measure work addiction in four samples, two comprising responses of working Norwegians (n1 = 16,426; n2 = 764) and two comprising responses of working Poles (n3 = 719; n4 = 711). The networks were estimated jointly with the fused graphic lasso method. Additionally, we estimated symptoms’ centrality, symptoms’ predictability, and networks’ stability, as well as quantitatively compared the four networks. The results showed highly similar networks across the four samples. There were several strong direct relationships between symptoms. The most and the least central symptoms were Relapse and Mood modification, respectively. Mean symptom predictability varied between 22.6 and 28.3% across samples. We discussed the possible intervention strategies based on the obtained results.
Plain Language Summary
Purpose: The aim of this study was to investigate direct relationships between symptoms of work addiction. Methods: We used a novel analytical approach (i.e., network analysis) and applied it to previously gathered responses of working individuals from Norway and Poland to investigate relationships between symptoms of work addiction. Conclusions: We found two groups of symptoms of work addiction. The first group included salience, mood modification and withdrawal. The second group included tolerance, relapse, conflict, and problems. It seems that the first group includes symptoms which could be considered as less pathological or early signs of work addiction, while the second group includes more pathological symptoms responsible for the strongest deterioration of well-being of individuals addicted to work. The two groups were connected through relationships between relapse and withdrawal, and between salience and tolerance. Implications: The identified groups of symptoms as well as the connections between those groups might be used to design new prevention programs and therapeutic interventions. Limitations: The study had cross-sectional design, which means that individuals’ responses were collected at a single point in time. Consequently, causal inference based on the results of this study is limited.
Introduction
Work addiction (often called workaholism) is a worldwide mental health problem with estimates of a prevalence rate of up to 10% (Atroszko et al., 2020). Work addiction deteriorates the private, occupational, and family life of those addicted to work and people around them (Clark et al., 2016; Griffiths et al., 2018; Patel, 2011). Moreover, work addiction is related to long working hours and stress which in turn leads to cardiovascular disease (Pega et al., 2021), cancer (Cohen et al., 2007), diabetes (Kivimäki et al., 2015), substance use and abuse (Virtanen et al., 2015), as well as depression and anxiety (Bannai & Tamakoshi, 2014). Taking that into consideration, grasping the processes of development and maintenance of work addiction is an important goal in mental health research.
Understanding the processes behind work addiction is necessary to develop effective prevention and intervention programs. Unfortunately, despite a growing number of research on this subject, work addiction is still considered a syndrome, a set of symptoms correlated with each other, whose etiology is not fully understood (Atroszko et al., 2019; Clark et al., 2016; Cossin et al., 2021; Kun et al., 2021; Morkevičiūtė et al., 2021). This gap in knowledge of its underpinnings may be related to the theoretical framework used to study work addiction. So far, work addiction has been investigated in the latent variable framework in which symptoms of work addiction are assumed to be effects of a common cause. In this framework, a common cause resembles a black box in which modes of operation are secret, but its consequences are visible as symptoms (Hoffart & Johnson, 2020). Consequently, a different theoretical model might be needed to discover the processes responsible for the development and maintenance of work addiction. Recently, Borsboom (2017) postulated the network theory of mental disorders in which the development and maintenance of mental disorders are explained by direct relationships between their symptoms. Thus changing the role of symptoms of mental disorders from passive indicators of latent variables to pivotal elements of the processes responsible for the existence of mental disorders. During the past decade, the network theory of mental disorders has become a popular framework for studying mental disorders (Contreras et al., 2019; Robinaugh et al., 2020), and produced a few promising hypotheses for the etiology and maintenance of mental disorders (for examples, see Elliott et al., 2020; Rodebaugh et al., 2018; Tejada-Gallardo et al., 2022). Therefore, a conceptualization of work addiction within the network theory framework might allow moving forward the research on its etiology and regulatory mechanisms.
To investigate work addiction within the network theory framework, we estimated four undirected partial correlation networks based on data from Norway and Poland. The estimated networks allowed us to identify processes, which may be responsible for the development and maintenance of work addiction. We identified the processes by investigating (a) pairwise relationships between symptoms of work addiction, (b) groups of tightly connected symptoms that may synchronize their states easily (i.e., clusters of symptoms), (c) the strength of potential influence of a symptom on other symptoms, and (d) probability that a state of a symptom may be influenced by other symptoms. Moreover, we compared the networks of work addiction among Norwegians and Poles of diverse sociodemographic backgrounds to evaluate how replicable the results are.
The remainder of this section is structured as follows. First, we provide the background for this study by describing (a) the definition and symptoms of work addiction (as network analysis is tightly connected with the operationalization and measurement of symptoms), (b) the assumptions of the network theory of mental disorders, and (c) the cultural and sociodemographic differences which could lead to differences in the estimated networks. Second, we review the existing literature on (a) work addiction in the latent variable framework, (b) work addiction in the network theory framework, and (c) the replicability of psychological networks in general (to evaluate how likely we are to observe similar networks). Finally, we synthesize previous research and form hypotheses for the present study.
Background
Definition and Symptoms of Work Addiction
Work addiction has been defined as “a compulsion to work and preoccupation with work activities leading to a significant harm and distress of a functionally impairing nature to the individual and/or other significantly relevant relationships (friends and family). The behavior is characterized by the loss of control over the working activity and persists over a significant period of time. This problematic work-related behavior can have varying intensity from mild to severe” (Atroszko et al., 2019, p. 9).
In the addiction framework, work addiction is measured with the Bergen Work Addiction Scale (BWAS; Andreassen et al., 2012), which is an instrument developed based on a common addiction components model (Brown, 1993; Griffiths, 2005). The model includes seven addiction symptoms: (1) salience (“the activity dominates thinking and behavior”; Andreassen et al., 2012, p. 266), (2) tolerance (“increasing amounts of the activity are required to achieve initial effects”; Andreassen et al., 2012, p. 266), (3) mood modification (“the activity modifies/improves mood”; Andreassen et al., 2012, p. 266), (4) relapse (“tendency for reversion to earlier patterns of the activity after abstinence or control”; Andreassen et al., 2012, p. 266), (5) withdrawal (“occurrence of unpleasant feelings when the activity is discontinued or suddenly reduced”; Andreassen et al., 2012, p. 266), (6) conflict (“the activity causes conflicts in social relationships and other activities”; Andreassen et al., 2012, p. 266), and (7) problems (negative outcomes of excessive working; Andreassen et al., 2012; Griffiths, 2011).
The Network Theory of Mental Disorders
The network theory of mental disorders has been developed by Borsboom (2017). The theory’s core assumption is that it is impossible to isolate one central disease mechanism in mental disorders. Instead, the author believes that causal interactions between symptoms generate feedback loops, and the activation of certain constellations of symptoms manifests itself as what is phenomenologically recognized as a mental disorder.
The symptoms in this theory are represented by nodes, and the direct relationships between pairs of symptoms are represented by edges. A network is a graph of nodes connected by the edges. The nodes can be connected to one another directly or indirectly via intermediary symptoms. The theory assumes that the single symptoms can be activated by the external field (factors outside the network, e.g., adverse life events may trigger salience), but also that one symptom can activate the other (e.g., salience may activate tolerance). The network is highly synchronized if all the symptoms interact with one another with similar strength. However, the symptoms can also form clusters, which are groups of symptoms within the network that have stronger relationships with one another. In that case, the symptoms within the cluster highly influence themselves and thus may remain active while other symptoms in the network are not. Tightly related symptoms can cause self-sustainable loops that are difficult to break and cause a considerable challenge in therapy.
Analyzing a network is a multistep process that aims to find patterns of edges (Epskamp et al., 2018). Firstly, it is necessary to examine which edges connect nodes, whether they are positive or negative, their strength, and search for clusters of nodes in the network. The next stage includes investigating the stability of estimated networks, indicating if a third stage, network inference, is warranted. The following step is an investigation of node centrality, meaning how strongly a node could influence and/or be influenced by other nodes in the network (Epskamp et al., 2018), and node predictability, which examines to what extent a node can be predicted by all the other nodes in the network (Haslbeck & Waldorp, 2018). The last step can only be performed when several networks are estimated since it explores the differences between them.
The major asset of this theory is its high suitability for clinical practice. It may be applied in both diagnosis and therapy. Recognizing which symptoms are present and what interactions within the network sustain them is vital for comprehensive diagnosis. Consequently, effective treatment of the disorder should involve modifying or reducing connections between the symptoms. This assumption seems congruent with a clinical practice in which intervention strategies focused on particular symptoms and relations between them, for example in cognitive-behavioral therapy, are usually successful in work addiction treatment (Andreassen, 2014; Atroszko, 2022; Cossin et al., 2021; Robinson, 2014). Therefore, the network approach to work addiction could constitute a bridge between the results of quantitative studies of work addiction and intervention strategies applied in clinical practice.
Borsboom (2017) in his work points to three types of interventions that are based on network theory. First is symptom intervention that aims to change the symptom directly. For example, a person experiencing anxiety after reducing the amount of time and effort devoted to work may take medication to ease withdrawal. The second are interventions to the external field, which stem from the assumption that in some cases the network will not self-sustain if the external trigger is removed. The author describes such networks as resilient, meaning that the dynamics between the symptoms are not strong enough to create feedback loops; therefore, they fade after the external factor is gone. For example, a person may be involved in excessive work in one organization and not in another organization, as the organizations differ in terms of organizational culture; thus, a change of organizational culture is a successful intervention. The third case is network interventions directed at changing the relationships between symptoms and reducing the feedback loops. This can be done, for example, by therapy, where a patient suffering from work addiction can learn how to deal with unpleasant feelings and tension which are typically modified through excessive work.
Cultural and Sociodemographic Differences
In this study, we aimed to investigate whether work addiction networks will replicate across samples of working individuals from different countries (Norway and Poland) and of diverse sociodemographic backgrounds (recent university graduates and individuals from the general working population). The most important work-related differences between Norway and Poland include, but are not limited to, gross domestic product (GDP) per capita, labor laws, social care regulations, and cultural differences (Poles score higher on power distance, masculinity, and uncertainty avoidance, Norwegians score higher on indulgence, and both nations score similarly in terms of individualism and long-term orientation; Hofstede et al., 2010). Taken together, these factors are reflected in considerable differences in the socioeconomic uncertainty between Norway and Poland, and these were found to affect work-related compulsive behaviors in previous studies in the two countries (Atroszko & Atroszko, 2021; Atroszko et al., 2017; Atroszko & Pallesen, 2014). The socioeconomic status of recent university graduates and individuals from the general working population differ due to age (recent graduates are younger), stage of career (recent graduates are at an early stage of career), education (not all working individuals are university graduates), job position (recent graduates are less likely to have managerial positions), and salary and wealth (recent graduates have lower salaries and are less likely to accumulate wealth). These differences also co-occur with work motivation, which substantially changes during a lifetime (Kooij et al., 2010), and thus may influence the tendency to compulsive overworking. Nevertheless, Hu et al. (2014) showed that while European countries differ in terms of work addiction levels, they are rather homogeneous when compared to Asian countries (as they are more similar to each other than to Asian countries and differ less than Asian countries). Therefore, it is possible that the differences between Norwegian and Polish networks may not be as pronounced despite all the differences between the two countries.
Literature Review
The BWAS has been developed as a measure of a single latent factor of work addiction, which showed an acceptable fit to the data in the original study in Norway (RMSEA = 0.077; Andreassen et al., 2012) and a recent study in China (RMSEA = 0.063; Sun et al., 2023). However, other studies showed that there are some non-trivial relationships between the symptoms of work addiction, which could not be explained by a single latent variable of work addiction. While a few authors reported that they obtained RMSEAs above the acceptable threshold and stopped there (Bereznowski & Konarski, 2020; Lichtenstein et al., 2019; Orosz et al., 2016), others investigated which residual correlations between symptoms were needed to be allowed to obtain acceptable fit (see Table 1). The correlation between salience (1) and tolerance (2) was required in Poland (Atroszko et al., 2017), Greece (Bellali et al., 2023), and Italy (Falco et al., 2022). The correlation between salience (1) and mood modification (3) was required in Poland (Atroszko et al., 2017) and Greece (Bellali et al., 2023). The correlation between salience (1) and withdrawal (5) was required in Poland (Atroszko et al., 2017), Greece (Bellali et al., 2023), and Turkey (Denizci Nazlıgül et al., 2022). The correlation between salience (1) and problems (7) was required in Italy (Molino et al., 2022) and Turkey (Denizci Nazlıgül et al., 2022). The correlation between tolerance (2) and conflict (6) was required in Italy (Falco et al., 2022). The correlation between mood modification (3) and withdrawal (5) was required in Turkey (Denizci Nazlıgül et al., 2022). The correlation between conflict (6) and problems (7) was required in Turkey (Denizci Nazlıgül et al., 2022) and Lebanon (Fekih-Romdhane et al., 2022). In this paper, we hypothesize that these relationships may indicate the inadequacy of the latent variable framework to capture the direct relationships between symptoms postulated by the network theory of mental disorders (Borsboom, 2017).
Correlations Observed Between Residuals of the BWAS Items in Previous Research Grounded in the Latent Variable Framework.

Note. 1 = Salience; 2 = Tolerance; 3 = Mood modification; 4 = Relapse; 5 = Withdrawal; 6 = Conflict; 7 = Problems.
To the best of our knowledge, there have been three studies investigating work addiction using the network theory framework. Two of them were direct extensions of this work (Bereznowski, Atroszko, & Konarski, 2023; Bereznowski, Bereznowska, et al., 2023) and, as such, do not constitute a valid source of hypotheses for the present study; thus, they will not be discussed here. The third study was conducted by Sun et al. (2023) and investigated the network of symptoms of work addiction and general anxiety in Chinese white-collar workers. Sun et al. (2023) showed that the five strongest edges in the estimated network were (a) Salience (1)—Tolerance (2), (b) Tolerance (2)—Problems (7), (c) Mood modification (3)–Withdrawal (5), (d) Salience (1)—Conflict (6), and (e) Mood modification (3)—Relapse (4), consecutively. Some of these connections resembled the correlations observed in previously discussed studies (i.e., a and c; see Table 1) and others did not (i.e., b, d, and e). Considering that Sun et al. (2023) reported an adequate fit of the single factor model to the data (RMSEA = 0.063) among the previously discussed research and did not investigate modification indices of the single factor model, it was unclear whether the differences are an indication that the structure of the work addiction network cannot be directly derived from the results of studies grounded in the latent variable framework or that the diverging results stem from cultural differences. Therefore, we decided to be cautious when formulating hypotheses.
When it comes to the replicability of estimated networks, previous research demonstrated that similarities of estimated networks depend on data and measurement instruments (Birkeland et al., 2020; Fried, 2017; Malgaroli et al., 2021). The networks are more likely to be similar when data is gathered in the same country (or culture) or among the same population (for example, the general population or clinical population). Moreover, similar demographics of the populations, such as similar age, the ratio of women to men, or educational background, also favor the estimation of similar networks. Estimating similar networks is also more likely to happen when the same set of symptoms is measured with identical wording of items, which indicates the use of the same instrument (Fried, 2017). Previous studies showed a satisfactory level of replicability of networks, especially when the same measurement tool was used in each sample (e.g., Bőthe et al., 2020; Fried et al., 2018; Hirota et al., 2020; Huang et al., 2020), even though the generalizability of such networks still has some limitations (Birkeland et al., 2020; Malgaroli et al., 2021). Therefore, the use of the same psychometric instrument in samples from populations of similar sociodemographic backgrounds decreases the chances of observing differences in estimated networks.
Present Study
Based on the addiction framework, it can be assumed that the process of increasing involvement in a behavior that is central in one’s life (salience) is related to the development of compulsion because it gradually serves more and more mood modification purposes, which, in turn, increases tolerance, withdrawal, and relapse and leads to negative consequences in the form of conflicts and problems (Shaffer et al., 2004). Taking into account feedback loops, it can be expected that increasing problems may increase mood modification needs and aggravate tolerance, withdrawal, and relapse symptoms. These assumptions seem to find support in previous research (Atroszko et al., 2017; Bellali et al., 2023; Denizci Nazlıgül et al., 2022; Falco et al., 2022; Fekih-Romdhane et al., 2022; Molino et al., 2022; Sun et al., 2023). Therefore, we argue that work addiction could be conceptualized as a network of direct relationships between its symptoms. However, the support for each of the assumptions seems to be scattered across the literature. Out of the five strongest edges found by Sun et al. (2023), only two were found in the latent variable framework studies, and only one of these was found in more than a single study (i.e., the edge between salience and tolerance). While acknowledging the necessity for a confirmatory approach in behavioral sciences (Wagenmakers et al., 2012), we argue that, in the case of a complex network of interrelationships, imposing specific predictions in the context of vague and heterogeneous premises from previous studies as well as lack of solid theories may be impossible. Taking into account previous research, we expect to observe the edge between salience and tolerance to be among the strongest edges in the four estimated networks, but do not form any expectations with respect to other edges as we consider previous research inconclusive on that matter.
Considering similarities between European cultures in terms of work addiction intensity (Hu et al., 2014) as well as similarities of networks estimated based on data gathered with the same psychometric instruments (Bőthe et al., 2020; Fried et al., 2018; Hirota et al., 2020; Huang et al., 2020), we expect that four networks of work addiction estimated in this study would show a high level of replicability. Nevertheless, some differences are likely to be observed, and we expect that the most considerable differences would be observed between samples, including individuals with simultaneously different nationalities and sociodemographic backgrounds (e.g., Norwegians from the general working population and recent Polish university graduates).
Hypotheses
Based on theoretical considerations and previous research, we formulated the following hypotheses. Hypothesis 1: Work addiction networks would have a non-trivial topology, in which certain symptoms would be more tightly connected than others (the edge between salience and tolerance will be among the strongest edges). Hypothesis 2: Work addiction networks would replicate across samples, including working individuals from different countries and of diverse sociodemographic backgrounds.
Method
Participants and Procedure
The four samples used in this study were collected during previous research (Andreassen et al., 2016; Atroszko et al., 2016, 2017). Sample 1 and Sample 2 were gathered among working Norwegians, and Sample 3 and Sample 4 were gathered among working Poles. Individuals from Sample 1 and Sample 3 were from the general working population, and individuals from Sample 2 and Sample 4 were recent university graduates of younger age and different sociodemographics. Table 2 presents detailed characteristics of the four samples. Information about participants’ compensation and deleted observations are presented in Supplemental Materials.
Sociodemographic Characteristics of the Four Samples.

aThese individuals completed a 1 year programme at a university (Årsenhet), which is incomparable with categories in other studies. To make their education level comparable, their highest completed level of education was recoded to high school.
bSeventeen individuals completed some kind of postgraduate studies, which is possible both after Bachelor’s degree and Master’s degree. To make their education level comparable, their highest completed level of education was recoded to Bachelor’s degree.
cPast year personal annual income before tax in Norwegian and Polish currencies (i.e., NOK and PLN).
dCategories for gross income varied across samples. Sample 1: C1 = 0–99,999 NOK, C2 = 100,000–199,999 NOK, C3 = 200,000–299,999 NOK, C4 = 300,000–399,999 NOK, C5 = 400,000–499,999 NOK, C6 = 500,000–599,999 NOK, C7 = 600,000–699,999 NOK, C8 = 700,000–799,999 NOK, C9 = 800,000–899,999 NOK, C10 = 900,000–999,999 NOK, C11 = 1,000,999 NOK or more. Sample 2: C1 = 0–150,000 NOK, C2 = 150,001–300,000 NOK, C3 = 300,001–450,000 NOK, C4 = 450,001–600,000 NOK, C5 = 600,001–750,000 NOK, C6 = 750,001–900,000 NOK, C7 = 900,001–1,050,000 NOK, C8 = 1,050,001–1,200,000 NOK, C9 = 1,200,001–1,350,000 NOK, C10 = 1,350,001–1,500,000 NOK, C11 = 1,500,001 or more. Sample 3: The responses to the open-ended question were recoded to match the categories in Sample 4. Sample 4: C1 = 0–17,000 PLN, C2 = 17,001–34,000 PLN, C3 = 34,001–51,000 PLN, C4 = 51,001–68,000 PLN, C5 = 68,001–85,000 PLN, C6 = 85,001–102,000 PLN, C7 = 102,001–119,000 PLN, C8 = 119,001–136,000 PLN, C9 = 136,001–153,000 PLN, C10 = 153,001–170,000 PLN, C11 = 170,000 PLN or more.
Measures
The BWAS (Andreassen et al., 2012) measures each of the seven symptoms of work addiction with a single item (Brown, 1993; Griffiths, 2005; Leshner, 1997). Respondents rate how often during the past 12 months they experienced a given symptom. They provide responses on a 5-point Likert-type scale from 1 (never) to 5 (always). The measure does not have a skip-structure, and the obtained responses were not preprocessed. In Sample 1 and Sample 2, the Norwegian version of the scale was used (Andreassen et al., 2012). In Sample 3 and Sample 4, the Polish version of the scale was used (Atroszko et al., 2017). Both versions of the measure showed good validity in previous research (Andreassen et al., 2012; Atroszko et al., 2017). The Cronbach’s alpha reliability coefficients were .86 for Sample 1, .85 for Sample 2, .84 for Sample 3, and .85 for Sample 4.
Additionally, participants from each sample reported their sex, age, marital status, work status, and gross income. In Sample 1, Sample 2, and Sample 4, gross income was measured with a closed-ended question with categories of different ranges (see Table 2). In Sample 3, gross income was measured with an open-ended question, which we recoded to categories from Sample 4 (see Table 2). Moreover, in Sample 2, Sample 3, and Sample 4, participants reported the number of children and the number of working hours per week. In Sample 1, Sample 2, and Sample 4, participants reported the highest completed level of education. In Sample 2 and Sample 4, the MacArthur Scale of Subjective Socioeconomic Status (Adler et al., 2000) was used to measure subjective socioeconomic status. This measure showed good validity and reliability in previous research (Operario et al., 2004).
Statistical Analyses
The analyses were performed using R version 4.0.5 (R Core Team, 2021) and the obtained networks were visualized using the qgraph 1.6.9 package (Epskamp et al., 2012). We divided the network analysis into the four steps introduced by Fried et al (2018): (1) network estimation, (2) network stability, (3) network inference, and (4) network comparison. For describing methods and results, we followed the guidelines for reporting psychological network analyses in cross-sectional data (Burger et al., 2023). The R code for all analyses and the Supplemental Materials are available at https://osf.io/76kpw.
Network Estimation
We jointly estimated the four network of work addiction. The estimation was performed with a fused graphic lasso (FGL) method (designed for polychoric correlations) implemented in the EstimateGroupNetwork 0.3.1 package (Costantini & Epskamp, 2017). The optimal values of tuning parameters were selected sequentially via k-fold cross-validation. A seed was set to 1. We averaged the layouts of the four individually estimated networks to obtain a single layout for visualizations. We used a spin-glass algorithm implemented in the igraph 1.2.6 package (Csardi & Nepusz, 2006) to search for clusters of work addiction symptoms.
Network Stability
We investigated the stability of the four networks using the bootnet 1.4.7 package (Epskamp et al., 2018). To do so, we performed nonparametric bootstrapping and case bootstrapping based on 1,000 bootstrap samples. We evaluated the stability of the estimated networks based on the correlation stability coefficient, which represents “the maximum proportion of cases that can be dropped, such that with 95% probability the correlation between original centrality indices and centrality of networks based on subsets is 0.7 or higher” (Epskamp et al., 2018, p. 200). The network is described as acceptably stable when the correlation stability coefficient exceeds .25 and as stable when it exceeds .50 (Epskamp et al., 2018).
Network Inference
We estimated symptom centrality based on node strength. Node strength is the sum of absolute values of all edges connecting a node with other nodes in a network. To compare the four networks in terms of symptom centrality, we calculated Spearman correlation coefficients between node strength for each pair of networks.
We estimated the average predictability of symptoms using the mgm 1.2-11 package (Haslbeck, 2019). As this study comprises only ordinal data, node predictability indicates how much a node “can be predicted by all other nodes in the network, beyond what is trivially predicted by the marginal distribution” (Haslbeck & Waldorp, 2018, p. 856).
Network Comparison
We compared pairs of networks by calculating Spearman correlation coefficients of edge weights for each of the pairs and by using methods implemented in the NetworkComparisonTest 2.2.1 package (van Borkulo et al., 2017). We calculated and compared the global strength of each network (“the weighted absolute sum of all edges in the network”; van Borkulo et al., 2017, p. 16). Moreover, we investigated whether all edges of the two networks were identical. We always started with an omnibus test, and when the omnibus test was significant, we continued with the post hoc test (with the Holm-Bonferroni correction for multiple testing) which allowed us to identify the edges which were different between the two networks.
Results
Descriptive Statistics
Table 3 presents means, standard deviations, skewness, and kurtosis of the symptoms of work addiction in each sample. The levels of symptomatology differed across the four samples (see Table 3).
Overview of the Seven Symptoms of Work Addiction.

Network Estimation
The four networks estimated jointly for the four samples are visualized in Figure 1. The four networks were fully connected (i.e., all edges were different from zero). The mean absolute edge weights were equal to .13 in each of the four samples. The four networks featured many consistent edges, for example, Conflict (6)—Problems (7), but also some edges that considerably differed across the networks, for example, Withdrawal (5)—Conflict (6). The spin-glass algorithm showed that there were two clusters of symptoms, the first included Salience (1), Mood modification (3), and Withdrawal (5), and the second included Tolerance (2), Relapse (4), Conflict (6), and Problems (7).
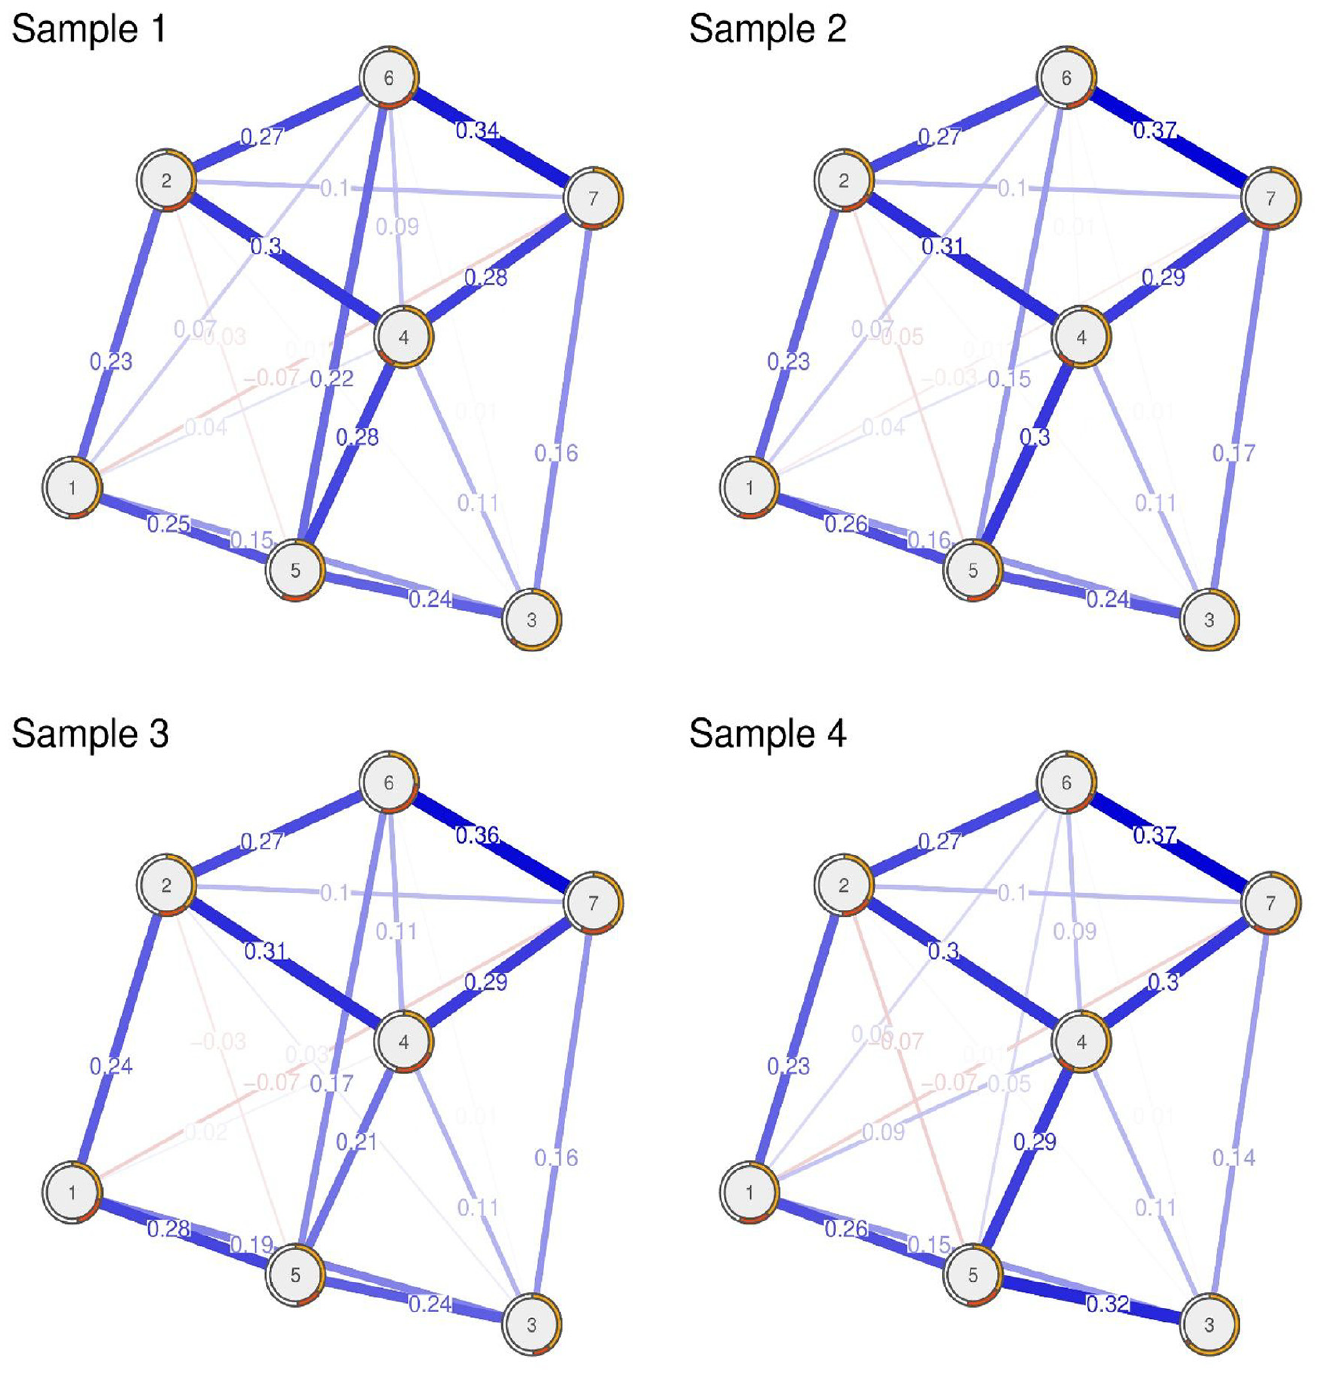
The four regularized partial correlation networks estimated jointly for the four samples. Positive edges are represented by blue lines and negative edges are represented by red lines. The strength of the relationship is represented by line thickness and darkness. Node predictability based on the marginal distribution of a node is represented by the orange area in the ring around a node. Node predictability based on the variance of a symptom explained by all of its neighbors is represented by the red area in the ring around a node. 1 = Salience; 2 = Tolerance; 3 = Mood modification; 4 = Relapse; 5 = Withdrawal; 6 = Conflict; 7 = Problems.
Network Stability
Stability analyses indicated that all four networks were accurately estimated (the width of the confidence intervals around the edge weights was small to moderate). The correlation stability coefficients exceeded the recommended threshold of .50 for stability estimation for Network 1 (.75), Network 3 (.52), and Network 4 (.52), and exceeded the minimal threshold of .25 for Network 2 (.44; Epskamp et al., 2018).
Network Inference
Centrality analysis showed that Mood modification (3) had the lowest node strength and that Relapse (4) had the highest node strength in all networks (see Figure 2). Additionally, Salience (1) had systematically low node strength, Tolerance (2), Withdrawal (5), and Problems (7) had systematically high node strength, and Conflict (6) had relatively high variability of node strength across the networks. The node strength was substantially related across the four networks, with correlations ranging between .71 (Network 1 and Network 3) and .96 (Network 2 and Network 4).

The standardized node strength of the seven work addiction symptoms in the four samples.
Average predictability in the four networks ranged from 22.6% (Sample 2) to 28.3% (Sample 4) of variance remaining after excluding marginals. Whereas on average, marginals accounted for from 34.1% (Sample 3) to 44.1% (Sample 1; see Figure 1) of the whole variance. The most predictable symptom was Conflict (6), with an average value of 31.7% in the four networks, and the least predictable symptom was Mood modification (3), with an average value of 12.7% in the four networks. Average values of predictability for all other symptoms varied between 24.8 and 28.6%.
Network Comparison
Spearman correlation coefficients of edge weights for each pair of networks ranged from .93 (Networks 2 and 3) to .98 (Networks 1 and 2), indicating strong similarities between the networks (see the comments in the analytical code for details of all results related to network comparison). Global strength did not differ (p > .05) across the four networks, and its values were 2.99, 2.91, 2.83, and 2.86 for Network 1, Network 2, Network 3, and Network 4, respectively. In the omnibus tests of the six possible pairwise comparisons, four pairs of networks did not differ significantly from each other. Only Network 1 differed from Network 4 (p < .001), and Network 2 differed from Network 3 (p = .030), implying that these pairs of networks did not feature exactly the same 21 edge weights. The comparison of Network 1 and Network 4 revealed that of all 21 edges, only four edges (19.0%) differed significantly: Salience (1)—Relapse (4), Mood modification (3)—Withdrawal (5), Withdrawal (5)—Conflict (6), and Relapse (4)—Problems (7). The comparison of Network 2 and Network 3 revealed that of all 21 edges, only three edges (14.3%) differed significantly: Relapse (4)—Withdrawal (5), Salience (1)—Conflict (6), and Relapse (4)—Conflict (6).
Discussion
This study aimed to conceptualize work addiction as a dynamic system of symptoms that are in direct relationships with each other. We estimated the four networks based on the four samples that differed in terms of cultural background, age, sociodemographic background, and severity of symptomatology. The results showed that networks were stable and replicated across the four samples. While we observed differences between pairs of samples, including working individuals with simultaneously different nationalities and sociodemographic backgrounds, there was no clear pattern of differences in edge strengths across the two samples.
Strongest Edges and Clusters of Nodes
In each of the four networks, there were eight edges whose weights were greater than .20. These were: Salience (1)—Tolerance (2), Salience (1)—Withdrawal (5), Tolerance (2)—Relapse (4), Tolerance (2)—Conflict (6), Mood modification (3)—Withdrawal (5), Relapse (4)—Withdrawal (5), Relapse (4)—Problems (7), and Conflict (6)—Problems (7). These edges (along with weaker ones) were responsible for the existence of two clusters of work addiction symptoms, which may represent two partially independent self-sustaining processes. The first cluster included Salience (1), Mood modification (3), and Withdrawal (5). The second cluster included Tolerance (2), Relapse (4), Conflict (6), and Problems (7). The two clusters seem to partially resemble a distinction between core (“conflict, withdrawal symptoms, relapse and reinstatement and behavioral salience”; Charlton & Danforth, 2007, p. 1531) and peripheral (“cognitive salience, tolerance and euphoria”; Charlton & Danforth, 2007, p. 1531) symptoms previously identified in the case of gaming addiction (Charlton & Danforth, 2007).
The symptoms in the first cluster seem to represent the internal experiences of an individual, which are not easily observable by a bystander. This cluster may represent a process responsible mainly for the initial stage of work addiction. The process may start with the occurrence of negative states that an individual wants to escape. To escape the negative states, the individual develops a constant preoccupation with work (for example, constantly thinking about work). During short periods when the individual is not preoccupied with work, the initial negative states return, or the individual experiences withdrawal symptoms related to not working. These negative states once again activate salience, and the vicious cycle repeats. An intervention which may be helpful in breaking this cycle should focus on restructuring coping mechanisms used by the individual by reducing the role of work and increasing the roles of adaptive coping skills (Cossin et al., 2021).
The second cluster seems to represent a process responsible for the maintenance of work addiction. The process seems to start when an individual starts to feel the need to increase the “dosage.” The increasing tolerance leads to the development of interpersonal and intrapersonal conflicts, which in turn result in health-related problems forcing the individual to reduce the amount of work. An attempt to reduce the amount of work is successful only for a short period and the whole cycle starts once again. To break this cycle, the possible interventions should focus on reducing the need to work longer. The interventions may involve cognitive restructuring of thoughts about work and/or encouragement to spend more time on leisure activities such as hobbies. These interventions may require support in the form of changes in labor laws and organizational culture such as mandatory vacation policy or limits on overtime work (Cossin et al., 2021). Moreover, it seems that a vicious cycle may be broken when the individual receives appropriate support when they find out about the health-related problems resulting from excessive work.
These two clusters of symptoms were connected mainly through the three edges: Salience (1)—Tolerance (2), Mood modification (3)—Problems (7), and Relapse (4)—Withdrawal (5). These edges seem to indicate that the two processes are not two completely independent and that while interventions on one of the clusters may break the vicious cycle for that cluster, the presence of symptoms from the other cluster may reinstate them. The activation of the second cluster seems to be possible mainly through the edge Salience (1)—Tolerance (2), which indicates that being preoccupied with work may lead to an increasing need to devote more time to work (the opposite direction seems possible as well). The activation of the first cluster seems to be also possible when an individual experiences withdrawal symptoms due to reducing the amount of work or when an individual experiences negative mental states because of health-related problems. The already mentioned interventions seem to address these paths adequately.
In light of previous research, it is important to point out that eight of the strongest edges in this study overlap with two out of the five strongest edges observed by Sun et al. (2023), and five out of seven correlations between residuals in previous research grounded in the latent variable framework (two of them overlapping with Sun et al., 2023; see Table 1). These results seem to indicate that both previous network studies and latent variable studies may constitute a valid source of hypotheses for future network studies of work addiction. However, while cross-cultural differences may explain some of the observed differences, additional investigations are needed to fully understand why two out of the eight strongest edges were not observed in either of the previous studies (please note that Relapse (4)—Withdrawal (5) was the sixth strongest edge in Sun et al., 2023, with edge weight equal to .16). Moreover, future studies should investigate the utility of residual correlations as indicators of partial correlations in psychological networks as the former seems to be a potentially useful approximation of the latter.
Centrality and Predictability of Symptoms
The centrality and predictability of symptoms were rather similar across the four networks. The centrality indices of symptoms were ordered in a similar manner and the average predictabilities in each network were approximately 25%. However, there were meaningful differences between the centrality and predictability of symptoms.
Mood modification (3) showed the lowest centrality and predictability in the four networks. The low centrality may seem unexpected as addiction is often conceptualized as a result of a pathological mood modification strategy, and it could be argued that mood modification is crucial as an initial cause for other symptoms to occur (Atroszko, 2019a; Shaffer et al., 2004; Sussman, 2012). However, the low centrality may indicate that this symptom is present in the early stages of work addiction when it activates other symptoms. Still, it does not play such an important role when work addiction is fully developed and perpetuates. The low predictability may indicate that activation of mood modification is more dependent on external factors (e.g., adverse life events) than other symptoms of work addiction, which seems congruent with the addiction theory (Shaffer et al., 2004). Consequently, external factors with the highest probability of triggering mood modification symptoms may become targets of future prevention programs (Borsboom, 2017).
Relapse (4) showed the highest centrality in the four networks. It was measured as a response to a question of whether an individual was “told by others to cut down on work without listening to them” (Andreassen et al., 2012, p. 269). The high centrality and relatively high predictability indicate that this symptom is the most visible consequence of work addiction. In light of studies showing that more than 90% of addicted individuals do not recognize their problem or seek help (Goldstein et al., 2009), this result seems to indicate that the problem of individuals addicted to work is best identified when people close to them recognize and communicate their overinvolvement in work. As such it has implications for monitoring and studying work addiction, suggesting that observer ratings could be particularly useful in measuring work addiction in family settings, and in the workplace (Atroszko & Atroszko, 2020).
Different symptoms had the highest predictability in different networks, and in all networks, the symptoms had predictability between 20 and 40% (except for mood modification, whose predictability varied between 5 and 20%; see Figure 1). These results seem to indicate that the conceptualization of work addiction as a dynamic system of interacting symptoms is feasible. However, these results also indicate that while direct relationships between symptoms of work addiction may partially explain processes of development and maintenance of work addiction, they cannot be the sole reason for work addiction symptoms’ existence and onset. This indicates that there most likely exists a common cause of work addiction symptoms (i.e., a latent variable) that co-exists with direct relationships between symptoms. Consequently, the use of statistical models accounting for the effects of latent variables and direct relationships between symptoms at the same time may be required to fully understand the processes responsible for the onset and maintenance of work addiction (see Epskamp et al., 2017).
Strengths and Limitations
We investigated four large samples comprising individuals of diverse cultural and sociodemographic backgrounds. The same instrument (the BWAS) was used in each sample. We jointly estimated the four networks and compared them quantitatively and qualitatively. Consequently, this study contributes to the still scant literature on the replicability of psychological networks; however, the generalizability of work addiction networks, based on different measures of work addiction, needs to be further investigated (Borsboom et al., 2017; Forbes et al., 2017a, 2017b).
In terms of limitations, the generalizability of the results needs to be considered as respondents represented general working populations from just two European countries, and females were overrepresented in each of the four samples. The validity of the results could have been influenced by the use of single-item measures of work addiction symptoms, which might have biased the estimates of networks’ parameters. The causal inference was limited as the study design was cross-sectional. Finally, direct relationships between symptoms of work addiction could have been influenced by a lack of other important variables in the networks (e.g., work engagement or job burnout; Bereznowski, Atroszko, & Konarski, 2023; Bereznowski, Bereznowska, et al., 2023).
Conclusions and Future Studies Directions
This study showed that the network approach constitutes a promising framework for studying work addiction, as it may allow to identify processes responsible for the development and maintenance of work addiction. However, the network approach’s impact on work addiction research should not be overestimated. The network framework allows to investigate direct relationships between symptoms of work addiction easily, but a careful examination of previous research grounded in the latent variable framework may lead to somewhat similar observations (Atroszko et al., 2017; Bellali et al., 2023; Denizci Nazlıgül et al., 2022; Falco et al., 2022; Fekih-Romdhane et al., 2022; Molino et al., 2022). Additionally, the moderate level of symptom predictability indicates that a substantial portion of work addiction symptoms’ variability cannot be predicted based on states of other symptoms. As a result, the latent variable framework seems to be the obvious complement of the network framework. Future research may require an integration of these two frameworks to understand work addiction fully.
The results of this study should be cross-validated by investigation of work addiction networks estimated based on other psychometric instruments, ideally comprising multiple items per each symptom of work addiction. Future studies should also investigate networks including work addiction and other work-related phenomena (and/or mental health problems), as well as networks based on longitudinal data and intensive longitudinal methods (e.g., experience sampling method). Moreover, future studies should investigate networks of work addiction among the clinical population and among populations from different cultures as well as search for sex, age, and work-related differences in networks of work addiction. Finally, the network approach may prove useful in clarifying the relationship between work addiction and anankastia/OCPD, which was suggested to be its major risk factor (Atroszko, 2019b; Atroszko et al., 2020).
Footnotes
Authors’ Contribution
Piotr Bereznowski assisted with obtaining funding, literature search, study design and concept, statistical analyses, data interpretation, generation of the initial draft of the manuscript, manuscript preparation and editing, and final editing and approval of the manuscript; Paweł A. Atroszko assisted with literature search, study design and concept, data collection, data interpretation, generation of the initial draft of the manuscript, manuscript preparation and editing, and final editing and approval of the manuscript; Roman Konarski assisted with study design and concept, manuscript preparation and editing, and final editing and approval of the manuscript.
Declaration of Conflicting Interests
The author(s) declared no potential conflicts of interest with respect to the research, authorship, and/or publication of this article.
Funding
The author(s) disclosed receipt of the following financial support for the research, authorship, and/or publication of this article: This work was supported by the Ministry of Science and Higher Education under Grant “Diamentowy Grant” DI 2017 001247.
Ethics Statement
The samples used in this study were gathered in three independent studies. All studies were carried out in accordance with the Declaration of Helsinki. In all cases, all gathered data was anonymous, and participants were informed about all the proper details about the study and their role in it, including that they can withdraw at any point. In all cases, attaining formal and written informed consent was not regarded as necessary as voluntary completion of the questionnaires was regarded as providing consent, and no medical information was gathered. The study collecting data for Sample 1 was approved by the Institutional Review Board of the Faculty of Psychology, University of Bergen, Norway. The study collecting data for Sample 2 and Sample 4 and the study collecting data for Sample 3 were approved by the Norwegian Data Protection Official for Research and the Research Ethics Committee at the Institute of Psychology, University of Gdańsk, Poland.
Data Availability Statement
Data sharing not applicable to this article as no datasets were generated or analyzed during the current study.