
Abstract
The psychological state of people during the COVID-19 pandemic has attracted significant interest from researchers and the general public alike. The aim of this study is to examine the stress, burnout, hopelessness, and depression levels of university students toward the end of the pandemic. A survey model, as a quantitative research method, was applied in this study. The analysis revealed that 70% of the participating university students had moderate to high stress levels, and levels of stress among female students were found to be higher than those among male students. When the students’ hopelessness levels were examined, it was seen that 81% of them felt hopelessness at medium or high levels. Hopelessness and burnout were seen to be associated with grade point average. A total of 61% of these students had moderate or high levels of depression symptoms, constituting an at-risk status. The results indicate that factors such as gender, year of study, and grade point average had varying effects on stress, burnout, hopelessness, and depression levels. Additionally, strong relationships were found among the four considered psychological variables, suggesting that they may influence one another and highlighting the need for further research in this area.
Introduction
The COVID-19 pandemic has severely affected global mental health, causing heightened psychological distress, especially among university students whose routines and education have been drastically disrupted (Nearchou & Douglas, 2021). Despite evidence of increased stress, burnout, hopelessness, and depression, these factors’ interrelations during the pandemic are largely understudied. COVID-19, first detected in China in 2019, escalated into a global pandemic, altering daily life significantly (AlAteeq et al., 2020; Bravata et al., 2021). These alterations, including shifts in educational routines, have compromised students’ academic and psychological welfare (Husky et al., 2021; Pfefferbaum & North, 2020; Rotas & Cahapay, 2020). University closures led to an online learning pivot, which proved insufficient for enhancing student motivation and skills (Munir et al., 2021). The pandemic also curtailed socialization opportunities, exacerbating student stress (Fruehwirth et al., 2021). Research revealed that students’ struggle to adapt to new educational methods affected their academic, social, and mental health (Charles et al., 2021). Many students grappled with anxiety and stress, and American university students reported higher depression and anxiety levels during the pandemic (Cao et al., 2020; Fruehwirth et al., 2021; Swendsen et al., 2020). As universities transition back to in-person learning following the pandemic, it’s crucial to study students’ stress, burnout, hopelessness, and depression levels. This research explores the pandemic’s impact on students’ mental health during this transition, seeking effective strategies to support their mental health amidst the ongoing pandemic.
Conceptual Framework
Stress
Stress in students is shaped by both internal factors like personality and academic stress, and external elements such as teacher influence, learning environment, and opportunities (Garcia-Martinez et al., 2021). Students confront numerous academic stressors, from heavy workloads to career decisions and time management issues (Menard et al., 2021). Balancing study, work, and personal life creates more stress, with time management being a particular challenge (Lolandes et al., 2020). The degree of stress varies with the academic program the student is enrolled in, with less satisfied students experiencing more job anxiety (Kanat, 2021). COVID-19, which led to an unexpected shift to online learning, further escalated students’ stress levels (Moawad, 2020). During the pandemic, a significant number of students reported moderate to severe stress and anxiety, with the impact appearing more pronounced among women (Lee et al., 2021; Pieh et al., 2020). The complexity of stress among students indicates the need for effective stress management strategies.
Burnout
Academic burnout, characterized by emotional exhaustion, cynicism toward studies, and decreased self-efficacy (Maslach & Jackson, 1981), has been amplified by the COVID-19 pandemic’s challenges, such as abrupt shifts to online learning and lack of interpersonal interaction (UNESCO, 2020; Zis et al., 2021). The pandemic-induced financial strains and employment uncertainties further contribute to this issue (McKay et al., 2020). “Female students, influenced by societal expectations and increased responsibilities, are found to be more susceptible to burnout symptoms (Bikar et al., 2018; Vinter et al., 2021). Among university students, about 50% experience burnout, particularly those in demanding fields like medicine (Deniz & Çam, 2014; Shanafelt et al., 2016). “The current situation emphasizes the critical role of universities in addressing burnout, suggesting strategies like promoting relaxation activities, offering mental health resources, and adopting flexible teaching methods (McKay et al., 2020; Salmela-Aro et al., 2022; Zis et al., 2021). The severity of academic burnout, especially during the pandemic, underscores the need for universities and educators to prioritize student well-being.
Hopelessness
Hopelessness, a state of mind characterized by pervasive despair, can severely affect self-worth, notably in university students (Beck et al., 1974; Tan Dat et al., 2021). The social and academic challenges faced during the transition from adolescence to adulthood can trigger mental health issues in these students (Byrd & McKinney, 2012; Cleary et al., 2011; Jda et al., 2004).” An uncomfortable campus environment and psychological stress can lead to extreme reactions, including suicidal tendencies (Eskin et al., 2016). Hopelessness, together with depression, are significant risk factors for suicidal behavior, heightened by the mental health challenges imposed by the COVID-19 pandemic (Ho et al., 2020; Qui et al., 2020; Witt et al., 2018). Studies indicate a high percentage of students considering suicide due to academic stress (Liu et al., 2019; Quiliano & Quiliano, 2020). Universities and educators, therefore, must provide access to appropriate resources, such as counseling and mental health services, and preventive measures like supportive campus environments and stress management courses (Ho et al., 2020). Addressing and supporting students struggling with hopelessness is paramount for their mental well-being and academic success.
Depression
Depression, affecting approximately one-third of university students, is a significant challenge that can impact quality of life and relationships due to social and academic pressures (Çelik & Çakmak Tolan, 2021; İbrahim et al., 2013). Factors such as test anxiety, the pressure for good grades, and self and family expectations contribute to depressive symptoms (Amutio & Smith, 2007; Lake, 2000; Salameh, 2011; Williams, 1998). Furthermore, students from disadvantaged communities experience a higher incidence of depression due to socioeconomic challenges and trauma (Barhafumwa et al., 2016; Vibhakar et al., 2019). The COVID-19 pandemic has exacerbated these issues, creating socioeconomic distress and disrupting academic pursuits, especially among students from economically disadvantaged families (Bjelland et al., 2008; Casey, 2020; Mihashi et al., 2009; Pellecchia et al., 2015). Depression can lead to loneliness and social isolation, affecting students’ social support networks (Çelik & Çakmak Tolan, 2021). Addressing depression in university students requires a comprehensive approach that includes psychological interventions, addressing socioeconomic challenges, and providing resources and support systems at the institutional level (Taremwa et al., 2023). Consequently, depression’s impact on university students requires multifaceted attention for their overall well-being and academic success.
Importance of the Study
The COVID-19 pandemic has induced significant emotional distress and anxiety among individuals globally, particularly for those population subsets highly susceptible to mental health issues (Debowska et al., 2020). University students represent such a vulnerable group (Wang et al., 2020). On March 27, 2020, the World Health Organization (WHO, 2020) cautioned that stress, apprehension, and fear would surge due to COVID-19. Concurrently, another research indicated an increase in suicide, domestic violence, mental disorders, anxiety, and depressive disorders globally as a consequence of COVID-19 (Sifat, 2020). During the pandemic, many studies have been conducted to measure the depression, stress, hopelessness, and burnout levels of students. It is clear that mental and behavioral disorders among university students are serious problems that should be addressed just as in the general population. The COVID-19 pandemic has contributed negatively to these problems for students as they have experienced increased stress, anxiety, and depressive thoughts (Son et al., 2020), and Wang et al. (2020) suggested that levels of depression, stress, hopelessness, and burnout be considered in the context of sociodemographic variables. However, as the pandemic began to wane and universities resumed face-to-face education, no further research was conducted to determine the depression, stress, hopelessness, and burnout levels of university students. The purpose of this study is to investigate the levels of perceived stress, burnout, hopelessness, and depression among university students as they transition back to face-to-face education during the later stages of the COVID-19 pandemic. Additionally, this study explores the differences in these psychological variables based on demographic characteristics and assesses the relationships among these variables. By examining the current mental health status of university students, this research seeks to contribute to the existing body of knowledge on the psychological impact of the pandemic and to provide valuable insights for educators, policymakers, and mental health professionals to support and promote the well-being of students during and after the pandemic. The aim of this study is to answer the following questions: Are the stress levels of university students significant according to their demographic characteristics? Are the burnout levels of university students significant according to their demographic characteristics? Are the hopelessness levels of university students significant according to their demographic characteristics? Are the depression levels of university students significant according to their demographic characteristics? What are the degrees of the relationships among perceived stress, burnout, hopelessness, and depression?
Method
Design
This study was conducted employing a quantitative research approach and a relational survey design. Survey models are research strategies intended to depict a historical or current condition as it was or is (Karasar, 1984). Quantitative research uses inquiry strategies such as experiments and surveys and collects data with predetermined tools that facilitate statistical analysis (Creswell, 2003). This method helps researchers identify correlations or relationships between variables and then use this information to assess current situations, predict future trends, or improve policy and practice. Among the advantages of relational screening models, the ability to collect and analyze large datasets in large sample groups provides statistical advantages in generalizing results to larger populations and identifying relationships and correlations (Fraenkel & Wallen, 2008). This study was a cross-sectional study. A cross-sectional study is a type of observational study that involves collecting data from a population or a representative subset at a given time. It is commonly used to investigate the prevalence of certain traits, behaviors, or conditions in a population.
Sample
The research universe or target population for this study consisted of associate degree and undergraduate students studying at the university level in Turkey. Eleven participants out of the initial 710 students were not included in the analysis because they filled out some parts of the demographic information form incorrectly. The sample of this research thus consisted with a total of 699 students at four different state universities in Turkey. The decision to choose these universities was based on several factors including geographical distribution, accessibility, and willingness to participate in the study. These universities represent a diverse range of institutions in terms of size, location, and academic programs, allowing for a more comprehensive understanding of the research questions across different university settings. This approach was taken to ensure that the research findings would be generalizable across different fields of study and to enhance the external validity of the findings. Students from a total of eight different departments (social work, child development, emergency medical services, physical education and sports, anesthesiology, culinary arts, office administration, and coaching) participated in the research, representing various larger fields of study, such as the social sciences and natural sciences. The stratified random sampling method was used for this study. Stratified random sampling involves dividing a population into homogeneous subgroups or tiers based on specific characteristics (e.g., university, department, or year of study) and then randomly selecting a sample from each subgroup. This method helped ensure that the sample represented various subgroups within the population and reduced the sampling error. An online form was created and sent to the participants, who all voluntarily participated in the research. Demographic information about the participants in terms of gender, age, year of study, and other variables is presented in Table 1.
Demographic Characteristics of the Participants.

Note. M = mean; SD = standard deviation; TL = Turkish Lira.
Data Collection
The data collection process for this research took place at the time of the first reopening of universities after the beginning of the pandemic. An online form was created and sent to the participants, who all participated in the study voluntarily. The data collection process consisted of five parts. First, the demographic information of the participants was collected. The Perceived Stress Scale constituted the second part, the Burnout Scale the third part, the Hopelessness Scale the fourth part, and the Depression Scale the fifth part.
Data Collection Tools
The data collection process consisted of five parts as described in detail below.
Demographic Information: This form was designed by the researchers to collect demographic data of the participants. Participants were asked to specify their gender, age, university, department, year of study, end-of-term grade point average, monthly income, and accommodation type.
Perceived Stress Scale: The original iteration of this scale was created by S. Cohen et al. (1983), and its Turkish version was later adapted by Eskin et al. (2013). The scale comprises 14 items in total, designed to gauge the level of stress an individual experiences in various life scenarios. The highest possible score on this scale is 56. In the Turkish reliability and validity studies for this scale, scores from 11 to 26 were considered as low stress, 27 to 41 as medium stress, and 42 to 56 as high stress. The reliability coefficient was found to be .85 in this study. Items 4, 5, 6, 7, 9, 10, and 13 are scored in reverse. Scores for this scale are assigned as follows: 1 point for “Never,” 2 points for “Almost never,” 3 points for “Sometimes,” 4 points for “Quite often,” and 5 points for “Very often.” The reverse-scored items follow the opposite pattern: 5 points for “Never,” 4 points for “Almost never,” 3 points for “Sometimes,” 2 points for “Quite often,” and 1 point for “Very often.” This scale doesn’t have any subcategories.
Burnout Scale: The Maslach Burnout Inventory-Student Form (MBI-SF) was employed for this study. Initially devised by Schaufeli, Martinez, et al. (2002), its Turkish version was adapted by Çapri et al. (2011). The scale is composed of 13 items categorized into three dimensions, namely “emotional exhaustion,”“depersonalization,” and “personal accomplishment.” Each subscale of the MBI-SF is individually scored and interpreted. Greater scores in the “emotional exhaustion” and “depersonalization” dimensions suggest elevated burnout levels, while lesser scores in “personal accomplishment” suggest the same. The reliability coefficient was determined to be .88 in this study. The scale items are rated from 0 points for “Never” to 6 points for “Always.” Higher scores on the exhaustion and depersonalization subscales denote increased burnout, whereas lower scores on the accomplishment subscale, which is reverse-scored, indicate reduced burnout.
Hopelessness Scale: The Beck Hopelessness Scale was originated by Beck et al. (1974), and its Turkish version was adapted by Seber et al. (1993). According to Beck and Steer’s (1988) categorization, total scores from 0 to 3 indicate no hopelessness, scores between 4 and 8 suggest mild hopelessness, scores from 9 to 14 indicate moderate hopelessness, and scores from 15 to 20 point toward severe hopelessness (as referenced by Duman et al., 2009). The reliability coefficient of this scale was computed to be .70. The scale consists of 20 items which are responded to with either a “Yes” or “No.” Each incorrect response is scored as 0, while each correct one earns 1 point. For 11 items (2, 4, 7, 9, 11, 12, 14, 16, 17, 18, and 20), “Yes” is the right answer, and for nine items (1, 3, 5, 6, 8, 10, 13, 15, and 19), “No” is the correct response, with each correct answer getting 1 point. Total scores ranging from 0 to 20, with higher scores indicating increased levels of hopelessness. In particular, scores between 4 and 8 on the scale suggest mild hopelessness, scores between 9 and 14 indicate moderate hopelessness, and scores of 15 or above denote severe or suicidal hopelessness.
Depression Scale: The Beck Depression Inventory (BDI) was formulated by Beck et al. (1961) to assess depression symptoms in teenagers and adults. The entire scale underwent a revision in 1978, eliminating duplicated severity definitions and asking patients to reflect their status over the past week, including the present day. The Turkish version of the scale was validated and its reliability was confirmed by Aktürk et al. (2005). The BDI probes for depression across seven dimensions: sadness, pessimism, past failures, self-dislike, self-blame, loss of interest, and thoughts or desire for suicide. The scoring for all items is done on a 0 to 3 scale, and the total BDI score is computed by summing the highest scores across each dimension. In the final interpretation, scores of 0 to 9 represent minimal depressive symptoms, 10 to 16 indicate mild depressive symptoms, 17 to 29 signify moderate depressive symptoms, and 30 to 63 denote severe depressive symptoms. The reliability coefficient was found to be .92 in this study. This scale does not contain any reverse-scored items.
Data Analysis
The data collected online were transferred into Excel spreadsheets and then analyzed using the free version of IBM SPSS Statistics 23. The data underwent normality tests; the Kolmogorov-Smirnov value was determined to be p < .05. The values of skewness and kurtosis were observed to vary (as shown in Table 2). According to George and Mallery (2010), skewness values within the range of −2.0 and +2.0 suggest a normal data distribution; thus, it was concluded that the data was normally distributed. As a result, parametric tests were the preferred method for analysis.
Homogeneity Test for Each Scale.

To compare the levels of perceived stress, burnout, hopelessness, and depression among the participants, means, t-tests, and ANOVA were applied for variables such as gender, year of study, age, end-of-term grade point average, monthly income, and accommodation type. In this research, the t-test was utilized to assess the average differences between two independent or matched groups (J. Cohen, 1988). ANOVA was used to evaluate the mean discrepancies among three or more independent groups. The F-statistic, which is computed by comparing the variance among groups to the variance within groups, was employed to ascertain significant differences (Field, 2013). The threshold for significant differences between two related variables was accepted as p < .05. (Gibbons, 1986; Lehmann, 1959).
Ethical Standards
Students were requested to fill out a questionnaire via Google Forms. Each participant also provided a voluntary participation form as a testament to their willing involvement in the study. The intent of the research and the usage of the collected data were clearly outlined to the students in the initial part of the online form. All other essential details about the study were also provided in this section. Furthermore, written instructions for each scale were provided at the start of the respective section within the questionnaire to ensure that the participants understood how to fill them out correctly and efficiently. It was explicitly stated that participants’ personal information would be kept confidential. The ethical approval for this research was granted on May 21, 2021, by the Ethics Committee of Muş Alparslan University, with the decision number E-43969839-044-12302.
Constraints
Limitations of Online Data Collection
The online form was accessible and facilitated data collection from a larger sample, it also came with limitations. The primary limitation of collecting data online is the lack of control over the environment in which participants complete the survey. This lack of control may lead to distractions or interruptions that could influence participants’ responses or their understanding of the survey questions. Online data collection may also exclude individuals who do not have access to the internet, smartphones, or computers, which might limit the diversity and representativeness of the sample. Additionally, self-selection bias might be an issue in online data collection as individuals who voluntarily choose to participate online may have different characteristics compared to those who do not participate.
Results
Are the Stress Levels of University Students Significant According to Their Demographic Characteristics?
In this section, the findings of the study on the perceived stress levels among the participating university students are presented. Table 3 illustrates the distribution of perceived stress levels in detail.
Levels of Perceived Stress Among Participating University Students

Note. N = number of students; M = mean; SD = standard deviation; % = percentage.
As seen in Table 3, 34% of the university students (241 students) experienced low levels of stress with a mean stress score of 21.91 and a standard deviation of 3.46. The majority of the students (61%, N = 429 students) had moderate stress with an average stress score of 30.13 and a standard deviation of 4.21. A small percentage of students (5%, N = 29 students) experienced high stress with a mean stress score of 48.63 and a standard deviation of 4.27. The mean score of perceived stress among all participating students (699 students) was 28.88 ± 6.40. This shows that, on average, the students experienced moderate stress, with a majority of the students falling into the low and moderate stress categories and only a small proportion experiencing high levels of stress.
As seen in Table 4, female students had a higher mean stress score (M = 29.23, SD = 6.22) compared to male students (M = 27.90, SD = 6.79). The t-test was applied to determine whether the difference in stress levels between female and male students was statistically significant. The t-statistic was found to be 2.437 with 697 degrees of freedom. There is a statistically significant difference in perceived stress levels between female and male university students, with female students reporting higher stress levels (t = 2.437, p < .05).
Examination of the University Students’ Perceived Stress Levels in Terms of Gender.

Note. M = mean; SD = standard deviation; df = degrees of freedom; t = t-statistic; p = p-value.
Table 5 indicates a significant difference in perceived stress levels between different years of study. Students in the first and second years reported higher stress levels compared to the third and fourth years. Demonstrating a significant difference between groups (F = 25.947, p < .05). In terms of age, stress levels varied significantly across certain age groups. Notably, 19-year-old students had higher stress levels (30.92) compared to 22-, 23-, and 24-year-old students (27.58, 26.72, and 26.66, respectively). Data indicating a significant difference between groups (F = 4.599, p < .05). Thus, both year of study and age significantly impact university students’ perceived stress levels, with lower stress levels reported by older and more advanced students.
Examination of the University Students’ Perceived Stress Levels in Terms of Year of Study and Age.
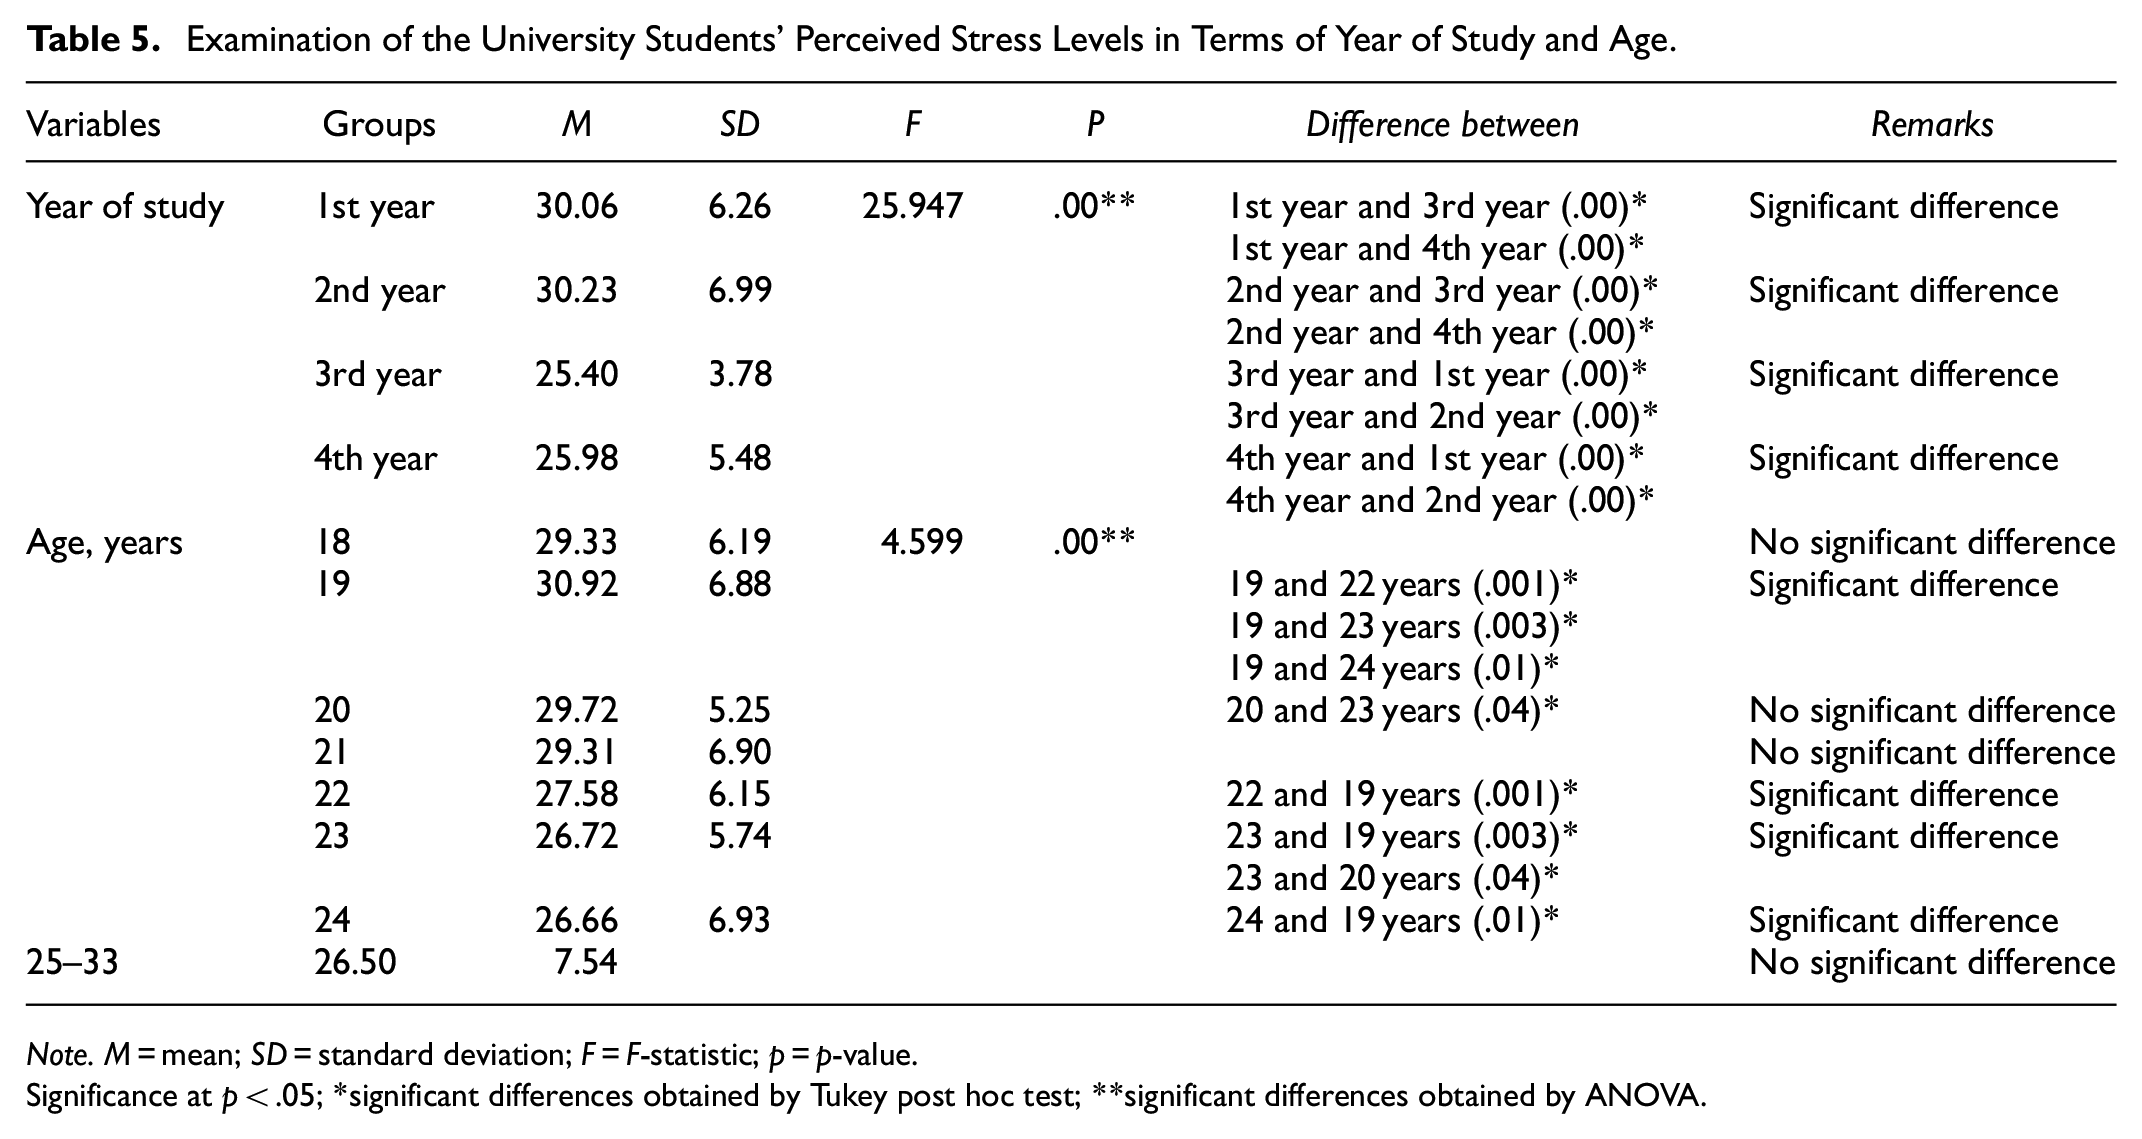
Note. M = mean; SD = standard deviation; F = F-statistic; p = p-value.
Significance at p < .05; *significant differences obtained by Tukey post hoc test; **significant differences obtained by ANOVA.
Analysis showed that there were no significant differences in perceived stress levels based on the end-of-term grade point average as seen in Table 6 (F = 1.927, p > .05). Similarly, there was no significant difference in perceived stress levels concerning monthly income (F = 1.140, p > .05). Regarding accommodation type, no significant difference was observed in perceived stress levels among students living in private homes, lodgings, or dormitories (F = 1.793, p > .05). In summary, the analysis revealed that end-of-term grade point average, monthly income, and accommodation type do not significantly impact university students’ perceived stress levels.
Examination of the University Students’ Perceived Stress Levels in Terms of Grade Point Average, Income, and Accommodations.

Note. M = mean; SD = standard deviation; F = F-statistic; p = p-value.
Are the Burnout Levels of University Students Significant According to Their Demographic Characteristics?
Table 7 presents the levels of burnout among the participating university students as reflected by the mean and standard deviation values for the overall burnout score and its three dimensions of emotional exhaustion, depersonalization, and personal accomplishment.
Levels of Burnout Among Participating University Students.

Note. N = number of students; M = mean; SD = standard deviation; % = percentage.
In Table 7, it is seen that the mean burnout score of these university students was 33.16, reflecting a high level of burnout. Examining the results on the basis of the scale’s dimensions, it is seen that the mean score for emotional exhaustion was 13.16. This score reflects the presence of emotional exhaustion. While a mean score of 9.08 in the depersonalization dimension does not indicate high levels of depersonalization, the score of 11.42 for personal accomplishment is somewhat high.
Table 8 presents the examination of university students’ burnout scores in terms of gender with the mean and standard deviation values for both female and male students. Female students had a slightly higher mean burnout score (33.67) compared to male students (33.45). However, the standard deviation for female students (9.35) was lower than that for male students (10.43), indicating a wider dispersion of burnout scores among male students. This suggests that there is no statistically significant difference in burnout scores between female and male university students (t = 0.270, p > .05).
Examination of the University Students’ Burnout Scores in Terms of Gender.
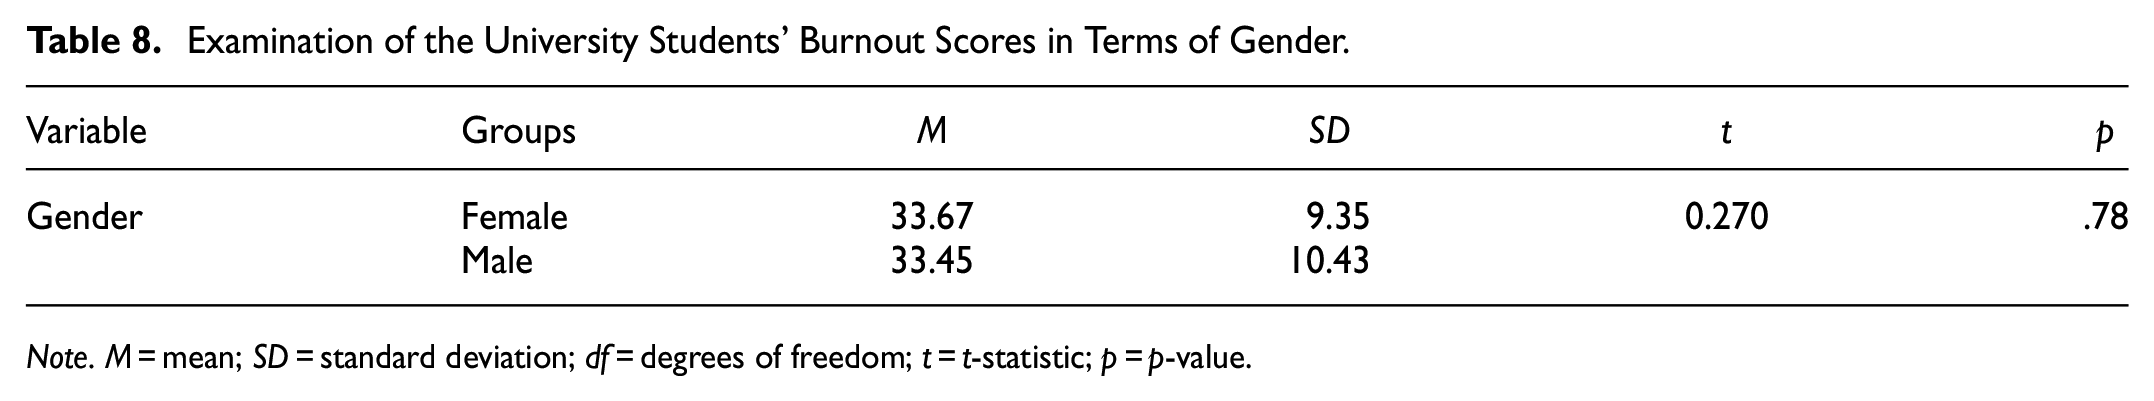
Note. M = mean; SD = standard deviation; df = degrees of freedom; t = t-statistic; p = p-value.
Table 9 presents the analysis of university students’ burnout scores in relation to their year of study and end-of-term grade point averages. These results indicate a significant difference between the burnout scores of students in the first and second years (F = 2.633, p < .05). However, there was no significant difference in burnout scores between students in the third and fourth years. The results also generally indicate significant differences in burnout scores between different groups of grade point averages (F = 4,221, p < .05). However, there was no significant difference in burnout scores for grade point averages of 0 to 1. Overall, significant differences were observed between groups for both year of study and grade point average.
Examination of University Students’ Burnout Scores in Terms of Year of Study and End-of-Term Grade Point Average.

Note. M = mean; SD = standard deviation; F = F-statistic; p = p-value.
Significance at p < .05; *significant differences obtained by Tukey post hoc test; **significant differences obtained by ANOVA.
University students’ burnout scores are presented in Table 10 in relation to age, monthly income, and accommodation type. No significant differences in burnout scores across different ages (F = 2,633, p > .05). For income, indicating no significant differences in burnout scores across different monthly income levels (F = 0.365, p > .05). For accommodation type, again indicating no significant differences in burnout scores (F = 0.503, p > .05). In summary, the analysis shows that there are no significant differences in university students’ burnout scores considering age, monthly income, and accommodation type.
Examination of the University Students’ Burnout Scores in Terms of Age, Monthly Income, and Accommodation Type.

Note. M = mean; SD = standard deviation; F = F-statistic; p = p-value.
Are the Hopelessness Levels of University Students Significant According to Their Demographic Characteristics?
In this subsection, the findings of the study on the hopelessness levels among participating university students are presented. Table 11 illustrates the distribution of hopelessness levels in detail.
Levels of Hopelessness Among Participating University Students.

Note. N = number of students; M = mean; SD = standard deviation; % = percentage.
Table 11 divides the participants into the three categories of mild hopelessness, moderate hopelessness, and severe hopelessness. Seventy-five students were classified as having mild hopelessness. They had a mean score of 3.98 and a standard deviation of 2.91. Moderate hopelessness was identified for 483 students, or 69% of the sample. The mean score for this group was 10.80, with a standard deviation of 1.76. Severe hopelessness was identified for 141 students, or 20% of the sample. These students had a mean score of 17.19 and a standard deviation of 2.27. Overall, the hopelessness status of the entire sample was represented by a mean score of 11.36 and a standard deviation of 4.12. This indicates that the majority of the participating university students experienced moderate levels of hopelessness, with a smaller percentage experiencing severe or mild hopelessness.
Table 12 examines the hopelessness scores of the university students in terms of gender. The mean hopelessness score for female students was 8.80, with a standard deviation of 4.45, while for male students it was 9.58, with a standard deviation of 4.44. There was a significant difference in the hopelessness scores of female and male students (t = 0.544, p < .05). Thus, there was a statistically significant difference between the hopelessness scores of female and male students. Based on the means obtained in this study, male students have higher levels of hopelessness compared to female students.
Examination of the University Students’ Hopelessness Scores in Terms of Gender.

Note. M = mean; SD = standard deviation; df = degrees of freedom; t = t-statistic; p = p-value.
Table 13 presents the analysis of the university students’ hopelessness scores in relation to their year of study and end-of-term GPA. Regarding the year of study, a significant difference in hopelessness scores was found between the first, second, and third year students. The first year students had a mean hopelessness score of 9.33 (SD = 4.73), while second year students had a mean score of 8.13 (SD = 4.90) and third year students had a mean score of 9.32 (SD = 2.92). Overall, there was a significant difference between these groups (F = 14.446, p < .05). In terms of end-of-term grade point averages, there were significant differences among students with grade point averages of 1 to 2, 2 to 3, and 3 to 4. Students with grade point averages of 0 to 1 had a mean hopelessness score of 11.07 (SD = 3.37). The students with grade point averages of 1 to 2 had a mean score of 10.58 (SD = 4.77), those with grade point averages of 2 to 3 had a mean score of 9.17 (SD = 4.57), and those with grade point averages of 3 to 4 had a mean score of 8.09 (SD = 4.46). Overall, there was a significant difference between the groups (F = 6.379, p < .05).
Examination of the University Students’ Hopelessness Scores in Terms of Year of Study and GPA.

Note. M = mean; SD = standard deviation; F = F-statistic; p = p-value.
Significance at p < .05; *significant differences obtained by Tukey post hoc test; **significant differences obtained by ANOVA.
Table 14 presents an examination of university students’ hopelessness scores according to age, monthly income, and accommodation type. Hopelessness scores did not vary significantly across different age groups (F = 0.536, p > .05). Similarly, there was no significant difference in hopelessness scores between students with different monthly incomes (F = 0.704, p > .05). Finally, there were no significant differences in hopelessness scores between students living in different types of accommodations (F = 0.726, p > .05).
Examination of the University Students’ Hopelessness Scores in Terms of Age, Monthly Income, and Accommodation Type.
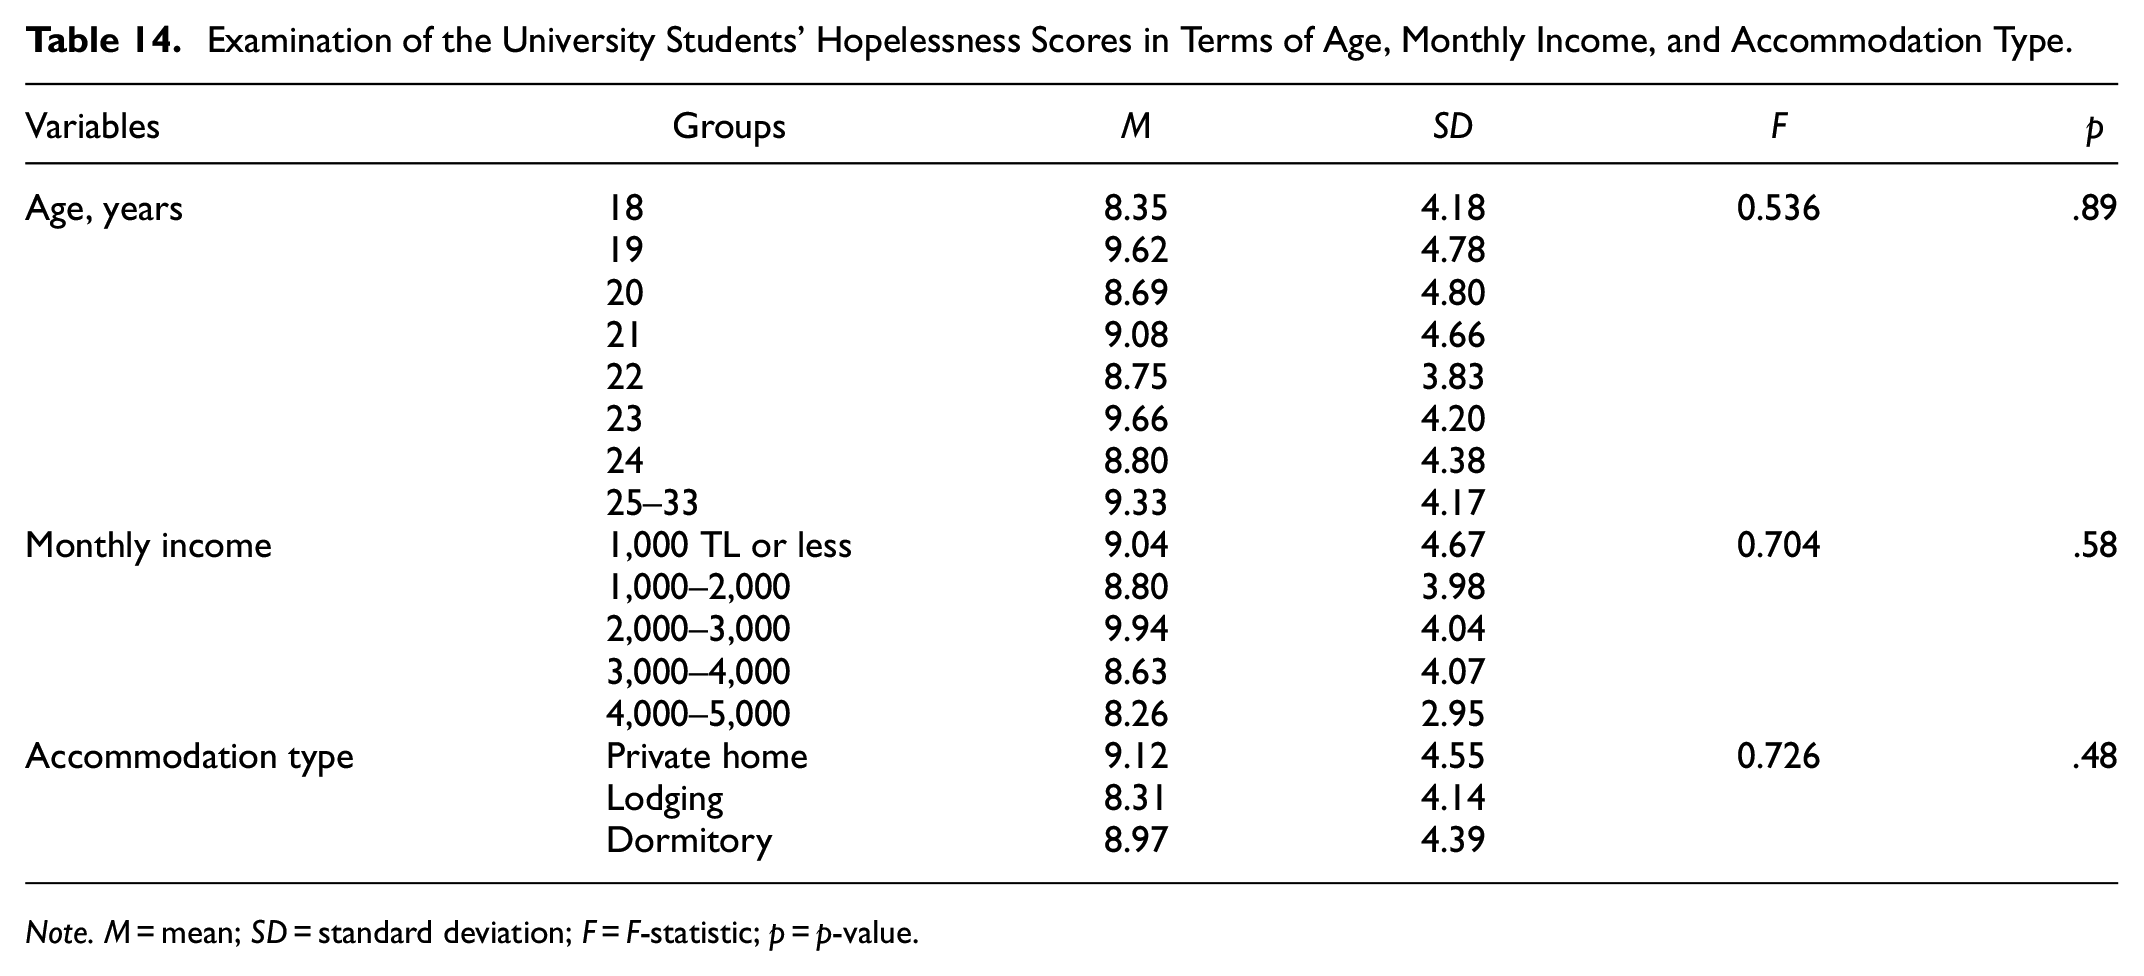
Note. M = mean; SD = standard deviation; F = F-statistic; p = p-value.
Are the Depression Levels of University Students Significant According to Their Demographic Characteristics?
Table 15 presents the levels of depression among the 699 participating university students. The categories of depression included minimal, mild, moderate, and severe depression.
Levels of Depression Among Participating University Students.

Note. N = number of students; M = mean; SD = standard deviation; % = percentage.
While 155 of the students (22% of the total population) had minimal depression with a mean score of 3.83 and a standard deviation of 3.19, 109 students (15% of the total population) experienced mild depression with a mean score of 13.22 and a standard deviation of 1.94. Moderate depression was observed for 261 students (37% of the total population), with a mean score of 22.69 and a standard deviation of 3.55. Severe depression was observed for 174 students (24% of the total population), with a mean score of 38.66 and a standard deviation of 8.24. The overall depression status of the participating students was reflected by a mean score of 21.01 and a standard deviation of 13.34.
Table 16 presents a comparison of the depression scores among university students in terms of gender. The mean depression score for female students was 20.30, with a standard deviation of 12.97. There was a statistically significant difference in depression scores between female students and male students, (t = −2.320, p < .05), with male students having higher levels of depression than female students.
Examination of the University Students’ Depression Scores in Terms of Gender.
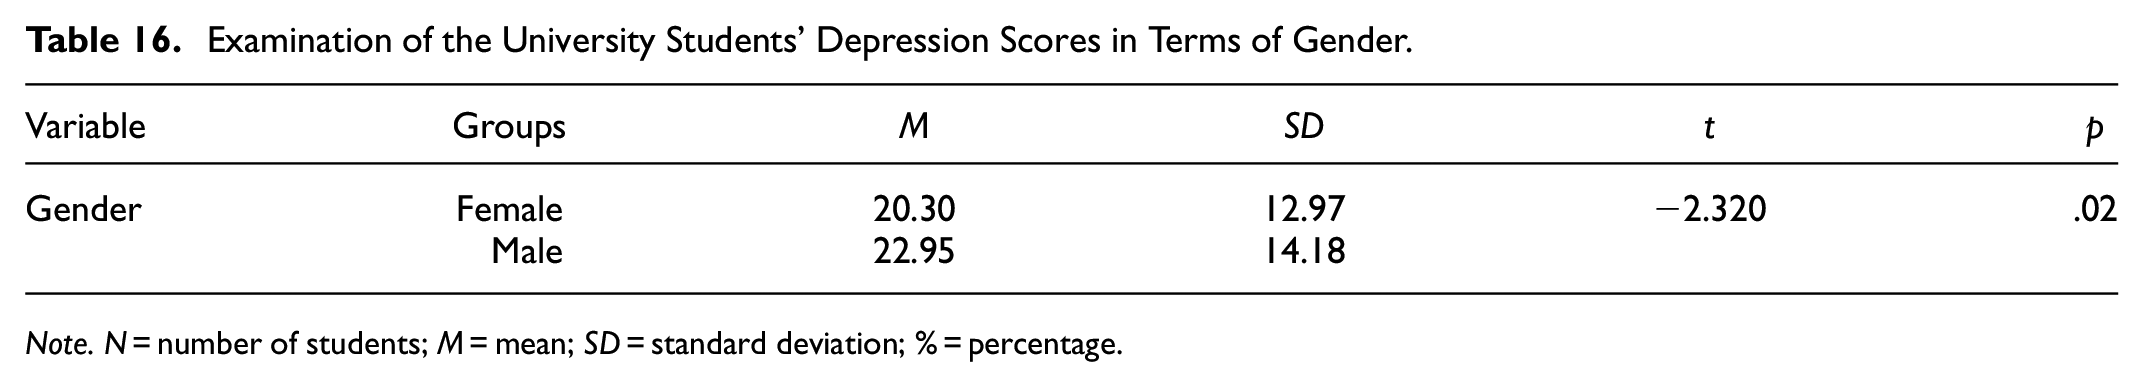
Note. N = number of students; M = mean; SD = standard deviation; % = percentage.
Table 17 presents an examination of the university students’ depression scores in terms of demographic characteristics, specifically the year of study and end-of-term grade point average. There was a significant difference in terms of year of study (F = 11.627, p < .05), with depression levels increasing as the year of study increased. The depression scores were higher for students in the third and fourth years compared to the first and second years. A significant difference was also found for GPA (F = 3.088, p < .05), with higher depression levels observed among students with lower grade point averages of 0 to 1. Students with grade point averages of 0 to 1 had higher depression scores compared to those with grade point averages of 1 to 2 and 2 to 3. Additionally, students with grade point averages of 3 to 4 had lower depression scores compared to those with grade point averages of 1 to 2 and 2 to 3.
Examination of the Depression Scores in Terms of Year of Study and End-of-Term Grade Point Average.

Note. M = mean; SD = standard deviation; F = F-statistic; p = p-value.
Significance at p < .05; *significant differences obtained by Tukey post hoc test; **significant differences obtained by ANOVA.
In Table 18, the depression scores of the university students are analyzed according to age, average monthly income, and accommodation type. There was no statistically significant difference in depression scores among students of different ages (F = 0.938, p = .50). There was also no statistically significant difference in depression scores among students with different average monthly incomes (F = 1.025, p > .05). Finally, there was no statistically significant difference in depression scores among students living in different types of accommodations (F = 2.626, p > .05). In summary, there is no significant difference in depression scores among university students according to age, average monthly income, or accommodation type.
Examination of the Depression Scores in Terms of Age, Average Monthly Income, and Accommodation Type.

Note. M = mean; SD = standard deviation; F = F-statistic; p = p-value.
What Are the Degrees of the Relationships Among Perceived Stress, Burnout, Hopelessness, and Depression?
Table 19 examines the degrees of the relationships among perceived stress, burnout, hopelessness, and depression in university students. The purpose of this analysis was to determine whether there were any significant correlations between these factors that might indicate a potential link or shared underlying causes. Table 19 presents the Pearson correlation coefficients for each pair of variables, with corresponding p-values to assess the statistical significance of the relationships.
Degree of Relationships Among Perceived Stress, Burnout, Hopelessness, and Depression.
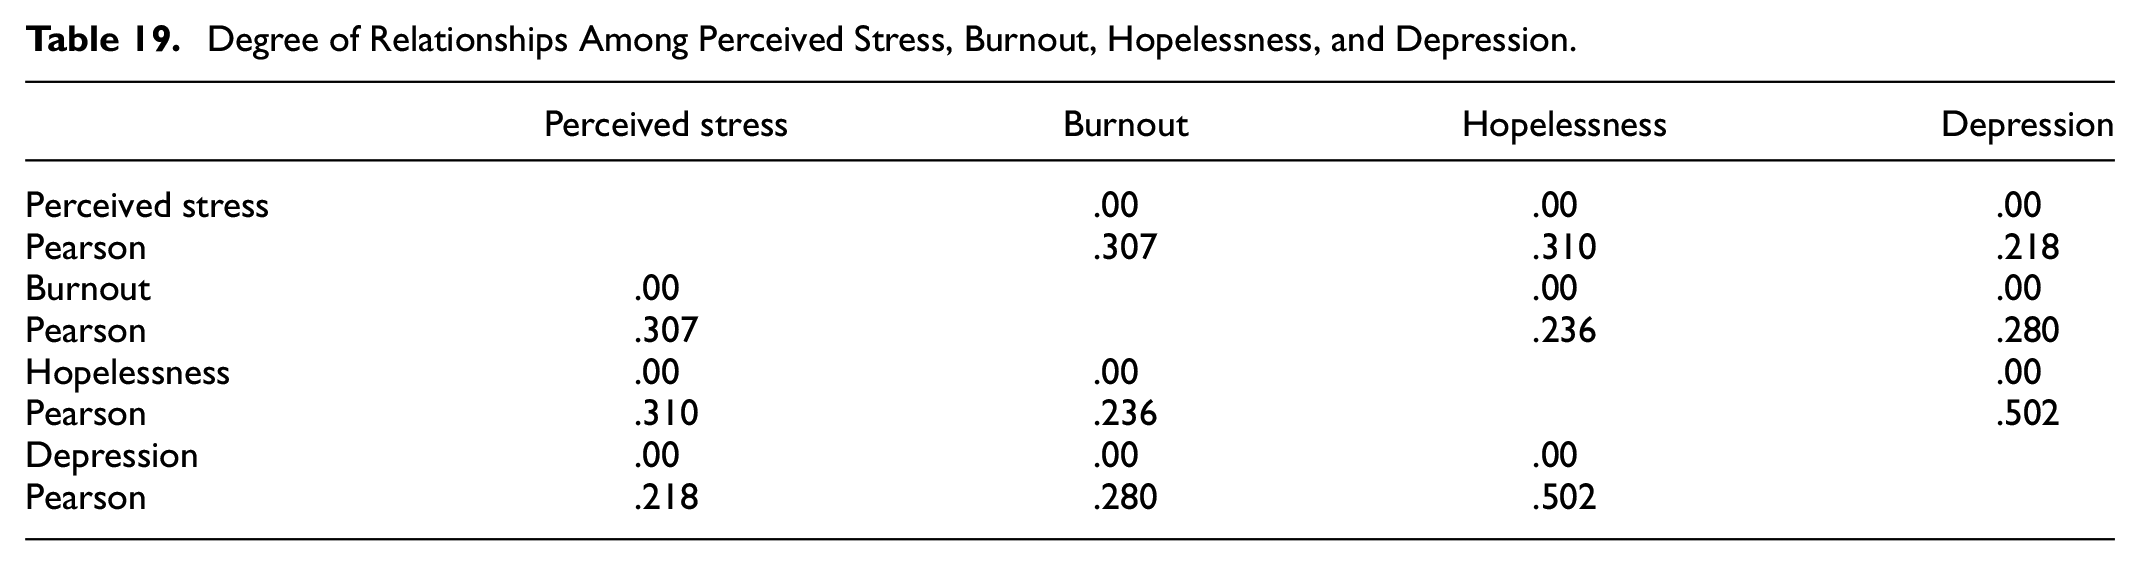
Table 11 presents information on the connections between perceived stress, burnout, hopelessness, and depression. Notable relationships were observed between perceived stress and burnout, hopelessness, and depression (p < .05). A weak positive correlation was found between perceived stress and burnout. A low positive correlation was observed between perceived stress and hopelessness. A similar low positive correlation was noted between perceived stress and depression. Lastly, a robust correlation was seen between depression and hopelessness.
Discussion
The findings of this research reveal that university students’ stress levels are impacted by factors such as gender, year of study, and age. Consistent with the globally published findings so far (Nearchou & Douglas, 2021), this research corroborates the hypothesis that the COVID-19 pandemic has adversely affected mental health worldwide, given that most students in this study reported experiencing moderate stress and a minor fraction reported high stress levels. Similar to previous studies conducted in China, France, and the United States (Cao et al., 2020; Fruehwirth et al., 2021; Swendsen et al., 2020), this study found significant differences in stress levels between female and male students, with female students reporting higher stress. Previous studies have suggested that women are more prone to stress and emotional instability than men (Adasi et al., 2020). This may be due to the fact that women face more sadness, frustration, and irritability and respond to stress more readily than their male counterparts (Calvarese, 2015). Various studies have also explored the association between stress and gender among university students (Day & Livingstone, 2003). For example, Pieh et al. (2020) reported that women’s overall well-being was worse than that of men during the pandemic. Furthermore, the findings of this study are consistent with other research that has shown that students in the first and second years of study tend to report higher stress levels compared to the third and fourth years (Garcia-Martinez et al., 2021). Lolandes et al. (2020) suggested that students may experience more stress regarding time management in their first years of higher education. Boujut et al. (2009) reported that severe stress was associated with more risky behaviors such as eating disorders and other addictive patterns in students in the first year. The present study also found that age significantly impacted university students’ perceived stress levels, with younger students reporting higher stress levels than older students. This finding contrasts with the results of the study conducted by Çetinkaya (2019), who found that university graduates and those still attending university felt more pressure than students who had recently started high school. The discrepancy between these findings could be due to differences in the specific stressors faced by high school and university students, as well as the varying impacts of the COVID-19 pandemic on these different age groups. In terms of other factors such as end-of-term grade point average, monthly income, and accommodation type, this study found no significant differences in perceived stress levels. This is contrary to previous research that has suggested that factors such as heavy workloads, grades, career choices, and time management are significant stressors for university students (Menard et al., 2021). The lack of noticeable discrepancies in stress levels considering these factors may be attributed to the particular circumstances of the COVID-19 pandemic and the distinctive stress-inducing elements it has brought forth. Broadly, this research has enriched the current body of knowledge by scrutinizing the stress levels of university students in the later phases of the COVID-19 pandemic. It highlights the importance of considering gender, year of study, and age while examining stress levels among university students. The findings of this study support those of previous research that has reported significant increases in stress, anxiety, and depression among university students during the pandemic (Charles et al., 2021). As universities transition back to face-to-face educational processes, understanding and addressing these stressors will be crucial for supporting the mental health and well-being of students.
The findings of this study indicate that university students experienced a high level of burnout during the COVID-19 pandemic. Regarding the dimensions of the burnout scale, students reported high levels of emotional exhaustion and somewhat high levels of personal accomplishment, while their depersonalization levels were not particularly high. This suggests that the students might have been feeling emotionally drained and overworked during the pandemic, which aligns with the evidence presented in the introduction of this study about the negative impact of the pandemic on mental health (Nearchou & Douglas, 2021) and the various stressors that students were exposed to Fruehwirth et al. (2021) and Shankland et al. (2019). In terms of gender differences, this study revealed no statistically significant difference between female and male university students in burnout scores. This finding is in contrast with previous research suggesting that female students experience more pressure to be academically successful than male students and are thus more prone to burnout symptoms (Bikar et al., 2018; Vinter et al., 2021). It is possible that the unique circumstances of the pandemic may have equalized the levels of stress experienced by both genders or that other factors were more influential in shaping burnout levels during this time. Upon examining burnout scores in relation to the year of study and end-of-term grade point average, significant differences were found in this study between students in their first and second years of study but not between students in the third and fourth years. This could be attributed to the fact that students in their first and second years of study might have had more difficulty adjusting to the changes in their educational routines and the new online learning environment (Munir et al., 2021; Schaufeli, Salanova, & González-Romá, 2002). This study also revealed significant differences in burnout scores between different ranges of grade point averages, but not for grade point averages of 0 to 1. This might suggest that students with lower academic achievement were more prone to burnout during the pandemic, which aligns with previous research linking burnout to academic frustration and failure (Schaufeli, Salanova, & González-Romá, 2002). However, this study found no significant differences in burnout scores across age, monthly income, or accommodation type, indicating that these factors might not have played significant roles in determining burnout levels during the pandemic. In conclusion, the findings of this study support claims that the COVID-19 pandemic has negatively impacted the mental health of university students as evidenced by the high levels of burnout reported.
The findings of the current study showed that a majority of the participating university students experienced moderate levels of hopelessness, with a smaller percentage experiencing severe or mild hopelessness. Erdoğdu et al. (2020) reached a similar conclusion. Upon comparing hopelessness scores between genders, a statistically significant difference was found, with male students having higher hopelessness scores than female students. Other previous studies found higher levels of hopelessness among women (e.g., Oyekcin et al., 2017), but in the context of the pandemic, higher levels of hopelessness among male students may be due to the fact that men have experienced higher COVID-related mortality rates than women. The data presented here also reflect significant differences in hopelessness scores in relation to students’ year of study and end-of-term grade point average. However, no significant differences were observed in hopelessness scores across different age groups, monthly incomes, or accommodation types. These findings are consistent with previous studies that highlighted the psychological impact of the COVID-19 pandemic (Ho et al., 2020; Qui et al., 2020; Wang et al., 2020). The pandemic has been found to contribute to high levels of psychological problems, particularly among individuals aged 18 to 30 years (Qui et al., 2020). Moreover, suicidal behaviors and academic stress are significant concerns among university students (American College Health Association (ACHA), 2018; Liu et al., 2019; Quiliano & Quiliano, 2020). The significant differences in hopelessness scores between male and female students found in this study are in line with the findings of Beck et al. (1974), who emphasized the role of negative expectations in the development of hopelessness. These results also support the idea that hopelessness is a critical mediator between psychological distress and suicidal behaviors (Miranda et al., 2013) and that hopelessness and depression are important risk factors for suicidal behaviors in university students and the general population (Witt et al., 2018). The differences in hopelessness scores based on the year of study and end-of-term grade point average are consistent with the idea that university students face unique challenges during this important developmental period, including adapting to new living conditions and coping with social and academic stressors (Byrd & McKinney, 2012; Cleary et al., 2011; Jda et al., 2004). The lack of significant differences in hopelessness scores across age groups, monthly incomes, and accommodation types suggests that other factors, such as individual coping mechanisms and social support systems, may play more significant roles in determining students’ levels of hopelessness.
The present findings provide valuable insights into the severity of depression and its prevalence within the sample, as well as the associations between depression scores and various demographic, social, and academic factors. In line with the literature, these results demonstrate a significant difference in depression scores between male and female students, supporting the idea that gender plays a role in depression levels among students (Çelik & Çakmak Tolan, 2021; İbrahim et al., 2013). Studies have generally reported that female students have higher levels of depression (Amr et al., 2008; Goebert et al., 2009; Roberts et al., 2010; Roh et al., 2010). However, according to other researchers (e.g., Wong et al., 2006), male students’ depression levels were found to be higher. Additionally, the present findings revealed a significant difference in depression scores based on year of study and end-of-term grade point average, suggesting that academic stress and performance are related to depression, as previously indicated in the literature (Amutio & Smith, 2007; Williams, 1998). Conversely, the findings did not show significant differences in depression scores based on age, monthly income, or accommodation type. This is in contrast to previous research suggesting that socioeconomic status and pandemic-related financial losses could impact depression levels (Barhafumwa et al., 2016; Bauldry, 2015; Bjelland et al., 2008; Brooks et al., 2020; Casey, 2020; Mihashi et al., 2009; Pellecchia et al., 2015; Substance Abuse and Mental Health Services Administration, 2017; Vibhakar et al., 2019). Previous research also showed that irrational beliefs were more prevalent among first-year students than fourth-year students (Salameh, 2011), which indicates that adverse conditions such as depression and anxiety are much more likely to be seen among first-year students. However, in this study, the depression levels of fourth-year students were higher. Finally, previous studies found negative correlations between academic success and depression (Hysenbegasi et al., 2005). In this study, the depression levels of students with lower grade point averages were found to be higher. This discrepancy could indicate that other factors such as social support or coping strategies might play more significant roles in influencing depression levels among university students.
The relationships among university students’ stress, burnout, hopelessness, and depression levels in a later stage of the pandemic were examined in this study and strong relationships were found. In the literature, it is stated that hopelessness and anxiety are associated with depression and can lead to undesirable outcomes that may culminate in suicide (Arslantaş et al., 2010). The existing international literature highlights the negative impact of the COVID-19 pandemic on global mental health, with increased psychological distress in the form of depression, anxiety, and post-traumatic stress (Nearchou & Douglas, 2021). Various studies have investigated the impact of COVID-19 on university students with reports of mixed findings. Cao et al. (2020) found that while many Chinese university students coped effectively with the pandemic, a significant minority experienced clinical symptoms such as anxiety, post-traumatic stress, and depression. In contrast, Swendsen et al. (2020) reported increased anxiety and stress levels among French university students who stayed with their families during the mandatory quarantine period. Similarly, Fruehwirth et al. (2021) observed a significant increase in anxiety and depression among American students during the pandemic. Despite the recognition of the pandemic’s negative impact on university students’ mental health (Son et al., 2020; Wang et al., 2020), there is a scarcity of research examining the depression, stress, hopelessness, and burnout levels of students as universities transitioned back to face-to-face education. This study contributes to the literature by examining the relationships among perceived stress, burnout, hopelessness, and depression in university students during the later stages of the pandemic and the return to face-to-face educational processes. Significant relationships were identified between perceived stress and burnout, hopelessness, and depression. Specifically, a weak positive relationship existed between perceived stress and burnout, while poor positive relationships were observed between perceived stress and both hopelessness and depression. Most notably, a strong relationship was observed between depression and hopelessness. The findings of the current study thus align with previous research highlighting the negative impact of the COVID-19 pandemic on university students’ mental health (Cao et al., 2020; Fruehwirth et al., 2021; Swendsen et al., 2020). This study further contributes to the literature by demonstrating the interrelatedness of stress, burnout, hopelessness, and depression among university students during the later stages of the pandemic and the transition back to face-to-face education. It is essential for future research to continue examining these relationships and consider relevant sociodemographic variables (Wang et al., 2020), as well as the potential long-term effects of the pandemic on university students’ mental health and well-being. This study was undertaken to compare the levels of stress, burnout, hopelessness, and depression among university students in terms of selected demographic characteristics. Overall, 70% of the participating students reported having moderate to high stress levels. Other researchers found that 88% of university students experienced moderate to severe stress in an earlier stage of the pandemic (Lee et al., 2021). Thus, although stress levels seem to have decreased as the pandemic has waned, the general effect still continues.
Conclusions
The present study has provided comprehensive analysis of the impact of the COVID-19 pandemic on university students’ mental health, specifically exploring stress, burnout, hopelessness, and depression levels. It offers a valuable contribution to the existing literature by examining these issues during the later stages of the pandemic and the transition back to face-to-face education. Several key findings emerged from this investigation:
A majority of students reported moderate stress levels, with gender, year of study, and age significantly influencing perceived stress. Female students experienced higher stress levels, a finding that aligned with previous research suggesting that women are more prone to stress and emotional instability.
Students reported high levels of burnout, particularly in terms of emotional exhaustion and personal accomplishment, with no significant gender differences. Students in the first and second years of study faced higher burnout levels, potentially due to difficulties in adjusting to changes in educational routines and online learning environments.
Male students had higher hopelessness scores than female students, contrary to some previous studies. This discrepancy could be attributed to the unique challenges and stressors brought on by the pandemic, such as higher COVID-related mortality rates among men.
Significant differences in depression scores were found based on gender, year of study, and end-of-term grade point average, but not age, monthly income, or accommodation type. This suggests that factors such as social support or coping strategies might play more significant roles in influencing depression levels among university students.
This study found strong relationships among perceived stress, burnout, hopelessness, and depression levels, emphasizing the interrelatedness of these mental health issues during the pandemic.
In conclusion, this study highlights the importance of understanding and addressing the mental health and well-being of university students during the pandemic and as institutions transition back to face-to-face educational processes.
Suggestions
Future research should employ longitudinal study designs to better understand the trajectories of stress, burnout, hopelessness, and depression among university students over time and how these factors have changed as the COVID-19 pandemic has evolved and as universities have transitioned back to face-to-face education. Investigations of the role of coping strategies, resilience, and social support in mitigating the negative effects of stress, burnout, hopelessness, and depression among university students during the pandemic and how these factors may contribute to students’ overall mental health and well-being would also be valuable. Future research should examine the effectiveness of various mental health interventions tailored to the unique stressors faced by university students during the COVID-19 pandemic, such as online counseling, stress management workshops, and peer support groups, in reducing stress, burnout, hopelessness, and depression. Researchers could also conduct cross-cultural comparisons to better understand how different cultural contexts may influence stress, burnout, hopelessness, and depression among university students during the pandemic and whether specific cultural factors may act as protective or risk factors for mental health. By addressing these areas in future research, our understandings of stress, burnout, hopelessness, and depression among university students during and after the COVID-19 pandemic can be significantly enhanced. This will also provide valuable insights for the development of effective mental health interventions and support systems tailored to the unique needs of university students during this challenging time.
Footnotes
Acknowledgements
The authors would like to express sincere gratitude to the participants.
Author Contributions
Author 1: Conceptualization, methodology, investigation, writing; Author 2: Methodology, data curation, formal analysis, visualization, writing—review & editing.
Declaration of Conflicting Interests
The author(s) declared no potential conflicts of interest with respect to the research, authorship, and/or publication of this article.
Funding
The author(s) received no financial support for the research, authorship, and/or publication of this article.
Ethical Approval
Ethical approval of the study was granted by the university at which the researchers worked.
Informed Consent
All participants in this study were undergraduate and associate degree students, and all participants were asked to complete the questionnaire via Google Forms. All participants also submitted a voluntary participation form to confirm that they had participated in the study voluntarily. The purpose of the research and the ways in which the data would be used were explained to the students and all necessary information was provided in the forms. It was also clearly stated that the personal information of the participants would not be shared with anyone.
Data Availability Statement
The datasets used and/or analyzed during the present study are not publicly available in this article. However, the corresponding author will share the data upon readers’ request.