
Abstract
Uncertainty in economic policy is one of many factors that can have an impact on the relationship between working capital and profitability. The corporate sector places a higher priority on working capital management that employs its working capital resources to have an advantage over rivals. The objective of our study is to determine how economic policy uncertainty (EPU) index for UK, as measured based on newspaper coverage frequency, affects the relationship between working capital management (CCC), return on operating assets, and other profitability measures across several businesses listed on the UK stock exchange for the years 2006 to 2021. To analyze the data for 199 UK manufacturing companies, we applied the Fixed Effect Method, Random Effect Method, and two-stage Generalized Method of Moments (GMM) to tackle the endogeneity problem and report robust findings. The findings of the study revealed that EPU statistically significantly affected the relationship between CCC and profitability. When uncertainty is high, companies may be hesitant to make investments or develop new products, which can lead to a reduction in working capital and lower profitability. Companies that can effectively manage their working capital in the face of uncertainty may be better positioned to maintain their profitability over the long term. This study can provide valuable insights for both companies and investors, helping to improve financial performance and enhance strategic decision-making regarding their working capital management policies in the face of economic policy uncertainty.
Plain Language Summary
Our study aims to ascertain the impact of economic policy uncertainty (EPU), which is measured by the frequency of newspaper coverage, on the association between working capital management (WCM), return on operating assets (ROOA), and other measures of profitability in several types of companies listed between 2006 and 2021 on the UK stock exchange. To address the endogeneity issue and present solid results, we used the Fixed Effect Method, Random Effect Method, and two-stage Generalized Method of Moments (GMM). The results of this study indicate that profitability is negatively impacted by the interaction variable Cash conversion cycle and economic policy uncertainty (CCC × EPU). This implies that there is a weaker correlation between working capital and profitability when economic policy uncertainty is high. Economic policy uncertainty may have a negative effect on the relationship between working capital and profitability because it can lead to financial market instability, which increases risk and uncertainty for businesses. Consequently, companies may exercise greater caution in their financing and investment decisions, potentially leading to reduced levels of profitability and working capital. Managers need to monitor changes in economic policies and their potential impact on their company. This can support managers in anticipating and planning for future shifts in profitability and working capital.
Keywords
Introduction
Economic downturns have boosted awareness and altered organizations’ attitudes toward managing working capital to improve firm performance (Zimon & Tarighi, 2021). Cash conversion cycle (CCC) is concerned with managing a firm’s short-term capital or the finances required to fund the firm’s daily operations. Working capital management (WCM) should allow the company to generate the liquidity necessary to meet the short-term debt, optimizing the relationship between risk and profitability (Chalmers et al., 2020). As a result, all businesses, regardless of size, must pay close attention to managing specific working capital issues. Financial decisions influencing working capital are vital to a company’s survival, growth, and profitability. Our study objective is to examine the moderating effects of the EPU index on the relationship between WCM, return on operating assets (ROOA), and other profitability indicators, including return on assets (ROA), and return on equity (ROE), across several companies listed on the UK stock exchange. Understanding the relationship between economic policy uncertainty, WCM, and profitability can help companies develop better-working capital management practices, allowing them to better manage liquidity and respond to changes in the business environment. Companies can develop strategies to reduce the adverse effects of uncertainty on profitability, take advantage of opportunities that arise in times of uncertainty, and make strategic decisions in terms of capital allocation, product development, and market expansion. By effectively managing economic policy uncertainty and its impact on working capital and profitability, companies can demonstrate their ability to navigate complex and challenging environments, which can enhance investor confidence and support long-term growth. Investigating the impact of economic policy uncertainty on the link between working capital and profitability is important for both UK companies and investors, as it can provide valuable insights that can inform decision-making and improve financial performance. The UK Market parameters serve as the driving force for this study. Hamre and Wright (2021) claim that the UK capital markets are well-established and handle more than 80% of all everyday business transactions. According to Baños-Caballero et al. (2014), trade credit accounts for roughly 41% of all debt and 50% of short-term debt in UK medium-sized businesses.Although the UK is a financial-based country, the contribution of manufacturing firms to UK manufacturing in 2020 According to M. Ramezani (2022), the manufacturing sector in the UK accounted for 2.7 million jobs, or 8% of all jobs in the country, £191 billion in economic output, or 10% of the real GDP, 42% of the £275 billion worth of exports, and 65% (or £16) of the £16 billion spent on research and development.
Second, the motivation for this study is the recent interest in studies that have examined how working capital affects corporate performance, particularly in the UK, US, and European economies (Aktas et al., 2015; Dalci et al., 2019; Gonçalves et al., 2018; C. T. Nguyen, 2020). Our critical scrutiny has revealed that there are limited studies that examined how the ROA, ROE, and ROOA of listed manufacturing firms on the UK Stock Exchange are impacted by economic policy uncertainty. ROOA is a measure of a company’s ability to generate profits from its operating assets during periods of high economic policy uncertainty, Companies may scale back what they spend in R&D and capital expenditures, leading to a reduction in operating assets. This can result in a decline in ROOA and changes in cash management practices, such as a shift towards more conservative cash management strategies. Working capital cultures in UK manufacturing firms are improving because of how vital CCC efficiency is and how economic policy uncertainty affects the relationship between working capital and the profitability of non-financial firms.
The study aims to contribute to the existing literature by addressing the following research questions:
What are the effects of economic policy uncertainty on the liquidity and solvency of companies, and how do these effects impact the relationship between working capital and profitability?
How do companies adjust their working capital management practices in response to economic policy uncertainty, and how do these adjustments impact profitability?
This study makes three contributions to the literature. In contrast to earlier studies that concentrated on working capital management’s effect on profitability (Akgün & Memis Karatas, 2021; Farhan & Yameen, 2020; C. T. Nguyen, 2020; Pham et al., 2020), this study first extends the literature by examining the effect of EPU on the relationship between working capital using extensive panel data obtained from the Thomson Reuters Eikon database. By shedding light on how changes in EPU affects the relationship between working capital and profitability.
In addition to the above, using CCC, ROOA, and other profitability measures (ROA and ROE), the study examined how EPU affected the relationship between working capital and profitability. This will help to examine the effect on the relationship and how businesses can carefully manage higher EPU, develop resilient supply chains, and implement policies to maintain consumer confidence and investment incentives.
Furthermore, the study can contribute to a better understanding of how policy uncertainty, working capital management, and financial performance relate to each other in the fields of academia, business, industry, and policy-making.
The study provides insights into the impact of EPU on the connection between CCC and profitability. Corporate decision-makers should design robust risk management policies in place to mitigate the impact of EPU on their working capital and profitability. As working capital is regarded as a good forecasting indicator for future economic concerns, our study could offer a macroeconomic signal if most companies maintain higher levels of it. The business environment may become more uncertain as a result of EPU, which could lead to companies holding more cash and inventory as coverage against potential losses. This could increase the need for working capital, which could affect profitability and also affect a business’s ability to secure financing, which could have further implications for working capital management. Working capital management may be challenging during times of extreme economic uncertainty because lenders may be reluctant to lend to businesses. As a result, growth opportunities might receive less funding, which could have a negative effect on profitability. In addition, the positive relationship between working capital and profitability is weakened or disrupted when EPU has a negative impact on this relationship. Finally, EPU may result in more uncertainty in the business environment, which may affect a company’s capacity to efficiently manage its working capital. This might decrease or even reverse the positive. Therefore, balancing working capital and profitability can be challenging in the face of EPU, but corporate decision-makers need to develop multiple scenarios, adjust their working capital and profitability accordingly and manage their cashflows to balance working capital and profitability by improving their cash conversion cycle by accelerating receivables and delaying payment to suppliers, which can help increase working capital while maintaining profitability. This study is important to corporate decision-makers to incorporate flexibility in their operations by implementing agile strategies, such as lean manufacturing or just-in-time inventory management, that would help them adjust their operations quickly in response to changes in economic policy uncertainty to maintain a balance between working capital and profitability.
The rest of the paper is structured as follows: The literature review and hypothesis development are covered in Section “Literature Review and Hypotheses Development,” and the data and variables used in this research are covered in Section “Methodology of the Study.” Section “Empirical Results” presents the actual outcomes of the panel data regression analysis. The assertions for the overview and conclusion are presented in Section “Conclusion.”
Literature Review and Hypotheses Development
Numerous studies have examined the connection between the WCM and the company’s profitability (Deloof, 2003; Farhan & Yameen, 2020; Gul et al., 2013; C. T. Nguyen, 2020). Examining the impact of WCM on profitability is essential to proving how CCC affects the firm’s profitability. Earlier studies examined the relationship between CCC and profitability in various economic contexts and industries (Panda & Nanda, 2018). Some studies in the developed market found a negative association between WCM and profitability (Akgün & Memis Karatas, 2021; Dalci et al., 2019; Lyngstadaas & Berg, 2016). In a sample of Spanish manufacturing firms from 2010 to 2016, Fernández-López et al. (2020) found a negative relationship between various working capital components and firm performance. The relationship between the CCC and profitability for 285 German nonfinancial companies from 2006 to 2013 was examined by Dalci et al. (2019). The study’s findings suggested that reducing the CCC would increase the profitability of SMEs. Yusoff et al. (2018) looked at 100 Malaysian manufacturing companies to explore how WCM affected their companies’ performance. The result of the study showed that profitability is strongly and negatively associated with the CCC components. Ahmad et al. (2022) in their study in India, also found out that, a longer CCC delay would negatively affect profitability. Several investigations, like those by Farhan and Yameen (2020) and Afrifa (2016), indicated a positive connection in contrast to the abovementioned findings. Moreover, Gonçalves et al. (2018) use the UK’s unlisted enterprises between 2006 and 2014 as an example to demonstrate how CCC efficiency enhances profitability. Their findings demonstrate the multi-level effects of WCM under various economic conditions on profitability and liquidity constraints. Lyngstadaas (2020) indicated that listed industrial firms’ better financial performance in the US had been linked to more effective WCM. Long-term business performance depends on choosing the right working capital strategy since it reduces operational expenses and protects financial liquidity (Aktas et al., 2015; Altaf & Shah, 2018; Anton & Afloarei Nucu, 2020; Jaworski & Czerwonka, 2022; Mun & Jang, 2015; Singhania & Mehta, 2017; Yilmaz & Acar, 2019; Zimon & Tarighi, 2021). There is also evidence that profitability and working capital have an inverted U-shaped relationship. Tsuruta (2019) found that CCC has a short-term negative impact on firm performance but a long-term positive impact on a firm’s performance, using data from more than 100,000 small Japanese companies. According to Altaf and Shah (2018), the relationship between CCC and business profitability is inverted U-shaped. Altaf and Shah’s (2018) study used 437 nonfinancial Indian companies using the GMM technique and a sample of Central, Eastern, and South-Eastern European high-growth businesses between 2006 and 2015. Using panel data regression techniques, Kawakibi and Hadiwidjojo (2019) also demonstrate the concave relationship between working capital level (measured by the cash conversion cycle) and business profitability for 160 listed companies from 2005 to 2010. Fixed-effects regressions are used. Using a sample of US companies from 1982 to 2011, Aktas et al. (2015) examine the connection between CCC and company financial performance. The study indicates a turning point in working capital investment where businesses can unite to perform better.
The Impact of CCC on ROA
ROA specifically focuses on how effectively a corporation utilizes its assets (Mensah & Bein, 2023). Golas (2020) examined the impacts of WCM on firm profitability from the perspective of various working capital components, with a focus on the Polish dairy industry. Days sales outstanding and days payable outstanding both positively affect profitability, but inventories and the cash conversion cycle are disastrous on Return on Assets (ROA), the authors find.
Shanthirathna (2019), examined how the cash conversion cycle affects a company’s performance using a sizable dataset made up of 266,547 firm-year observations from 46 countries spanning various industries. After adjusting for industry, the author discovered a markedly inverse relationship between CCC and ROA. In their study on the relationship between WCM and productivity as well as the role of macroeconomic factors (inflation and GDP) in regulating the performance of Iran’s listed manufacturing firms, Soukhakian and Khodakarami (2019) discovered that the cash conversion cycle is inversely correlated with the rate of return on an asset (ROA). A. H. Nguyen et al. (2020) studied the effects of CCC on ROA using 35 real estate companies listed between 2010 and 2014 on the Vietnam Stock Exchange. The study results revealed that ROA was adversely affected by the two CCC components; ARD and INVD. ROA was also impacted by the company’s scale, leverage, and economic expansion. Muhammad et al. (2016) looked into how the CCC affected the profitability of Pakistani tobacco companies between 2005 and 2014, as indicated by the ROA. The findings demonstrated that the CCC had a significant negative impact on the company’s profitability. The existence of a negative association was therefore supported by further evidence, even though the findings of earlier studies on the CCC-profitability relationship were not conclusive. Because of CCC’s negative impact on profitability, the following hypothesis was established:
H1: CCC has a negative impact on UK non-financial firms’ ROA.
The Effect of CCC on ROE
Using 166 listed industrial firms as a sample for 2007, Uyar (2009) investigated the effects of CCC length and size, as defined by total revenues and assets, on profitability, as evaluated by ROA and ROE. The results of the Pearson correlation study revealed a statistically significant inverse relationship between CCC and ROA but not ROE. A shorter CCC positively influenced financial performance. Nobanee and Haddad (2014) focused their research on 2,318 listed nonfinancial Japanese enterprises over the 1990–2004 period to examine the association between CCC and profitability as assessed by return on investment and found a negative association between CCC and profitability.
Ceylan (2021) investigated the effects of CCC on 167 listed enterprises’ profitability, liquidity, and debt structure between 1995 and 2008, and the result revealed that CCC had a negative effect on ROA and ROE. Aytekin and Güler (2014) conducted a study to determine how the CCC affected the profitability (ROA, ROE, and EBIT) of 26 businesses listed in the BIST Nonmetallic Mineral Products Index (XTAST) between 2009 and 2012 and found that days of inventory outstanding had a negative effect on ROA. The study further suggested that reducing outstanding days could increase ROA. The study revealed that average payment days have a significant impact on ROA and ROE. The results showed that EBIT was not statistically significantly affected by the cash conversion cycle or its constituent parts. The conclusions of earlier studies on the CCC-profitability relationship are not definitive, although more data suggests a negative association. The negative effect of CCC on profitability led to the formulation of the following hypothesis:
H2: The ROE of UK non-financial firms is negatively impacted by CCC.
The Impact of CCC on ROOA
In management evaluation, profitability analysis, planning, and control, return on operating assets (ROOA) is helpful. ROOA measures the income produced per dollar invested in the UK company’s operating assets. ROOA can be used to assess a business’ operating efficiency. Assets not used in the regular course of business, including potential investments in other firms, are not included. Like the return on assets ratio, but with a more limited definition of the company’s assets, the ROOA measures the level of profits related to those assets. The ROOA compares how effectively a company uses its assets to generate an operating profit (Ongore & Kusa, 2013). As a result, a business with significant working capital may generate a lower operating profit than investors had anticipated. Liquidity and profitability must be traded off when deciding on the right level of working capital. Since there are no studies on the effect of CCC on ROOA, the following hypothesis has been developed:
H3: The CCC has a positive impact on the ROOA of UK non-financial firms.
The Moderating Effect of Economic Policy Uncertainty (EPU) on the Relationship Between CCC and Profitability
Economic activity and financial stability are both impacted by EPU fluctuations (Junttila & Vataja 2018). In recent years, political crises, and EPU have occupied the minds of many academics and policymakers. To find out how EPU affects the economy, numerous studies have been done. An EPU index was specifically developed by Yaya et al. (2021), Tao et al. (2022), and Berger et al. (2022). Businesses appear to hold more cash as EPU increases, according to research from Tran (2020) and Demir and Ersan (2017). A number of studies have generally used the EPU index to examine the economic effects of EPU (Ozili, 2022; Phan et al., 2021; Shabir et al., 2022). The EPU indicator is a depiction of the EPU index (Baker et al., 2016). Numerous studies using various measurement methods have used the EPU index. It is calculated using the degree of volatility in the relevant timeframes over a given period. Another metric is the level of uncertainty in news reporting, economic analysis, and governmental evaluations. This index was created and is currently being researched to give investors context for their financial decisions and to adopt a variety of economic plans for the future. Economic policy uncertainty limits business income and investment (Guo et al., 2020). In other words, investment growth and company profitability decline as economic policy uncertainty increases. Economic uncertainty greatly influences how a nation’s economy and other market entities operate. Since the UK has a developed economy, economic measures are very important for businesses to survive. This discipline has long focused on how businesses behave when economic policy is uncertain, particularly when making investment decisions. Economic policy uncertainty can result in numerous investment opportunities while posing high risks, and corporate investment choices necessitate a balance between opportunity costs and potential value. EPU is viewed as an external variable in this study because it is a macro indicator. However, as a significant industry component, investment behavior directly affects economic growth, impacting how government policies are created and altered. In other words, uncertainty in economic policy may not only influence but also impact corporate investment. The effect of CCC on profitability is predicted to be affected by the uncertainty of economic policy. Based on the above, economic policy uncertainty may affect the CCC-profitability relationship. Therefore, it has been suggested that:
H4: Uncertainty in economic policy has an impact on the link between CCC and UK non-financial companies’ profitability.

Conceptual model.
Methodology of the Study
Sample and Data Collection
Data from UK non-financial firms from 2006 to 2021 was used in this study. The study used data from the UK capital markets because they are well-developed (Hamre & Wright, 2021), and there are limited studies on the impact of working capital management on profitability using ROA, ROE, and ROOA as proxies for profitability as depicted in Tables 1 and 2.. The financial position and income statements that comprise the bulk of the data set are taken from the Thomson Reuters Eikon database and Baker et al. (2016) index constructed for UK manufacturing companies. Similarly, Arhinful and Radmehr (2023) utilized data from the Thomson Reuters Eikon database to examine the impact of financial leverage on the financial performance of companies listed on the Tokyo Stock Market. During the sample period, one’s lack of consecutive data was excluded from constructing a balanced panel data model, resulting in a final sample of 199 firms and 3,184 observations. The final dataset belonged to a total of 17 sub-industries in the manufacturing sector, namely: aerospace and defense, beverage, chemicals, construction and materials, electricity and electrical equipment, media, and fixed-line telephone, general industry, general retailers, food production, pharmaceutical and healthcare equipment, household, and home construction, industrial engineering and travel, oil and gas equipment, personal goods, software, and computer and technology hardware and equipment. All non-financial companies listed on the UK stock exchanges were considered. The dataset excluded businesses with missing data. In addition, we used robust, balanced panel data that depended on available records. Since 2006 was the first year after the adoption of International Financial Reporting Standards (IFRS), that is when our survey period began.
Variable Description and Source.

Summary of Variables and Formulae.

Study Variables
Variable Description and Measurement
The study used three variables as proxies for the firm’s profitability. The strategy used to overcome outliers was Winsor2 (percentiles of 10 and 90). The study applies Winsor2 to the following variables: ROA, ROE, ROOA, FAT EPU, and SG. Lag had been applied on CCC WUI and CCC × EPU.
The first measure of firm profitability was the ROA. ROA compares the company’s profitability to the value of all its assets and measures its profitability. Corporate management, analysts, and investors use ROA to assess how successfully a company utilizes its resources to turn a profit.
The second measure of profitability used for the study was ROE. It is a financial success indicator used to measure the yield on net assets of a company. ROE can also be viewed as the return on net assets because shareholder equity is determined by subtracting a company’s obligations from its assets. Therefore, ROE is periodically used to determine how effectively a company’s management can produce a profit with the assets under its control.
The third profitability measure used was the ROOA. It is a measure that demonstrates how effectively a business uses its revenue-generating assets. These are resources that are utilized daily. This value is frequently calculated to determine the revenue these assets produce.
The following variables were used in the study as independent variables:
The CCC is a measure of how long it takes a business to recoup the money from its expenditures on inventory by selling its goods. When a business has less cash locked up in accounts receivable and inventory, its CCC is shorter. It is calculated as a period of receivables, combining the time it takes to convert inventory into receivables with the time it takes to pay for it (Vu Thi & Phung, 2021).
Turnover of Fixed Assets: This ratio measures how effectively a business generates net sales from its fixed-asset investments.
Sales Growth: Sales growth is a measure that assesses the company’s sales team’s capacity to boost revenue over a predetermined length of time.
Leverage: the quantity of debt a company uses to finance assets. Leverage uses different financial instruments or investment strategies to raise the potential return on investment. In this study, we used the debt-to-equity ratio to measure leverage.
The following variables served as control parameters for the study.
Size: A log of the total assets is used to calculate the size of the firm. Economic policy uncertainty and world uncertainty.
Table 3 shows the firms traded on the UK Stock Exchange, the industries represented in the population, their numbers, and the population’s percentage of the sample number. According to Sensini (2020) industry characteristics like the production process and capital intensity can impact the connection between working capital and profitability. Therefore, industry dummies are used to evaluate the differences in the sample’s industries. In this respect, 17 dummies were added as (1) industry and (0) non-industry. Seventeen (17) dummies were used
Information About Sample Statistics in a Descriptive Manner.

Study Model
The study used three methods to estimate the effect of CCC on profitability. Which were the fixed effect model, random effects, and the Generalized Method of Moments (GMM). The GMM was utilized to control the endogeneity issue. Endogeneity bias is the cause of these technique estimations (Ullah et al., 2018). We used GMM in Stata to arrive at our results. We used two-step robustness rather than one-step. By estimating the weighting matrix separately, the two-step GMM addresses this problem, minimizing the effects of misspecification and offering more reliable parameter estimates. To examine the effect of Economic policy uncertainty on the relationship between CCC and profitability, the study used six models to find the effect of economic policy uncertainty on the relationship between CCC and profitability.
Where, the dependent variables are represented by ROA (Return on Asset), ROE (Return on Equity), and, ROOA (Return on Operating Assets). In addition, CCC (Cash Conversion Cycle), Fixed Assets Turnover (FAT), Sales Growth (SG), and Leverage (LEV) are the Independent variables. Size, and World Uncertainty (WU) are the control variables, and Economic Policy Uncertainty (EPU) is moderating variable, t (time) and F (company).
Empirical Results
Table 4 shows a description of the variables used in the study. The average mean ROA for UK firms is 4.8%. The results show that the firm could generate 4.8% of its earnings from its total assets. This implied that the sampled manufacturing companies recorded profits. The ROA figure was higher than that reported by Dalci et al. (2019) for German non-financial firms in 2019 (1.1%), but much lower than that reported for Finnish companies by Enqvist et al. (2014) which recorded (8.4%) or for Spanish SMEs by Garcia-Teruel and Martinez-Solano in 2007 (7.9%). Manufacturing companies in the UK had an average ROE of 10.7%. The outcome demonstrates how effectively the management manages the stockholders’ funds and produces profits for the shareholders. Additionally, the result indicates that the firms have a high turnover of fixed assets due to replacing obsolete ones. UK firms’ average return on operating assets was 0.076 per pound invested in the firm’s operating assets. The return on operating assets indicated how well the firms used them to generate operating income. These assets were used in the company’s daily activities, and their income was frequently calculated. Furthermore, it thought about cutting back on utilizing those not bringing in money. A 7.6% return on ROOA indicated that the firm earned 0.076 cents in profit for every pound it invested in operating equipment. The ROOA value could have been affected by staff pay, utility costs, and the cost of products supplied, making ROOA a susceptible measurement. The CCC took 12 days to convert its inventory, receivables, and account payables into cash. The CCC result indicated that UK firms had a shorter cash conversion cycle (Sensini, 2020). Firms that controlled their cash flows effectively produce more sales per dollar of invested capital, as shown in our results. This finding explains why the firm may not need external funding when the cash conversion cycle is short, resulting in lower borrowing costs, interest expenses, and profitability. The average fixed asset turnover was 10.634 times. This demonstrated excellent efficiency because the assets’ values were lower than the income they produced. The higher the fixed asset turnover ratio, the more the firm effectively utilizes its fixed assets to generate revenue from its property, plant, and equipment. It showed that the management effectiveness of the company was outstanding. According to studies by Sari and Brata (2020), Febrianti and Basri (2022), and Puspita et al. (2021) fixed asset turnover has an impact on profitability. The average size of the company was 12.8%. The firm size showed that the CCC would be shorter as the firm size decreased and longer as the firm size increased. This finding indicated that UK firms shortened their CCC by shortening the inventory and accounts receivable periods and lengthening the accounts payable period. The average annual rise in sales growth for UK businesses was close to 2%. Growing net income relative to stock values could expand their source of income. A company’s worth may rise due to more sales and better discounts for early payments made possible by higher working capital levels (Deloof, 2003). As a result, financial decisions influencing working capital are vital to a company’s survival, growth, and profitability (Di Minin et al., 2014; Sensini, 2020). The average leverage for UK firms was 38%, indicating that the firms had a low debt-to-total-asset ratio. Debt and company success had a negative relationship (Aktas et al., 2015). According to our findings, the firms benefited from low gearing and made good profits. Furthermore, the most successful businesses are less likely to favor outside funding, as Allini et al. (2018) suggest. The average mean of UK economic policy uncertainty was 53.7%, which may affect firms’ investment decisions. This increase in economic policy uncertainty will result in firms delaying investment decisions because they become unsure whether their future cash flows will cover the investment’s cost. Additionally, as uncertainty grows, it may cause the risk premium and the value of the currency in which the firms’ borrowing is denominated to rise, which would have a negative impact on the cost of financing and interest costs. The global average level of uncertainty is 9.9%. This indicates that a rise in global uncertainty may impact supply and demand on both the macro and micro levels, adversely affecting the labor market and the output of goods and services provided by UK businesses (Barua, 2020).
Descriptive Statistics.

Table 5 contains a correlation matrix for each variable. A correlation study determined if dependent and independent variables were multicollinear. The dependent variables were ROA, ROE, and ROOA. The independent variables were the CCC, leverage, fixed asset turnover, and sales growth, and the control variables were size, economic policy, and world uncertainty. The CCC had a positive relationship with ROA, ROE, and ROOA. The concept that resources are freed up at various stages of the supply chain, shortening the operational cycle, is consistent with the positive correlation for CCC. When the costs of tying up money are lower than the benefits of storing more inventories and extending more trade credit to consumers, this could result in higher profits due to more sales (Ebire et al., 2024). Leverage had a positive correlation with ROA and ROE and a negative correlation with ROOA. The leverage result indicated that the firms financed their operating assets using equity. A company with high leverage typically has more debt than others. Higher fixed costs lead to higher degrees of operating leverage; a lower degree of operating leverage creates added sensitivity to changes in revenue, showing a positive relationship between ROA and ROE. The firm’s size had a positive impact on all the dependent variables (ROA, ROE, and ROOA). The size result indicated that the firms are experiencing market growth and responding positively. The greater the operating assets and sales, the larger the firm’s scale. The larger the firm, the longer the CCC is in terms of days. Since it is a well-known fact that smaller businesses frequently struggle with CCC and liquidity management issues, smaller businesses can receive a warning to control their inventory and account receivable turnover within days. A company’s size can be used to assess how big or small it is (Jaworski & Czerwonka, 2022). Companies that have large sizes must have high capital to fund their investment in obtaining profits. Company size can be measured by the total assets owned because the value of total assets is substantial compared to other financial variables. The greater the value of a company, the more the company is considered to have good operations in the eyes of investors. Fixed Assets Turnover had a positive correlation with ROA, while there was a negative correlation between ROE and ROOA. This portrays the efficiency of the management in converting the firm’s resources into profits (Akhter, 2018). This result showed that the higher the asset turnover rate, the lower the returns (profitability). Sales growth had a positive relationship with all of the dependent variable returns. Sales growth will drive profitability, which impacts the net profit margin. The more sales the company generates, the more effectively and efficiently it can run its business (Nariswari & Nugraha, 2020). Therefore, the association among the variables in Table 4 was not strong enough to interfere with multicollinearity. The independent variables’ estimated coefficients were all smaller than 0.8, indicating a lack of potential multicollinearity (Gujarati, 2014). Economic policy uncertainty and world uncertainty correlated negatively with all the dependent variables. This indicates that increased economic policy and world uncertainty will decrease profitability.
Matrix of Correlations.

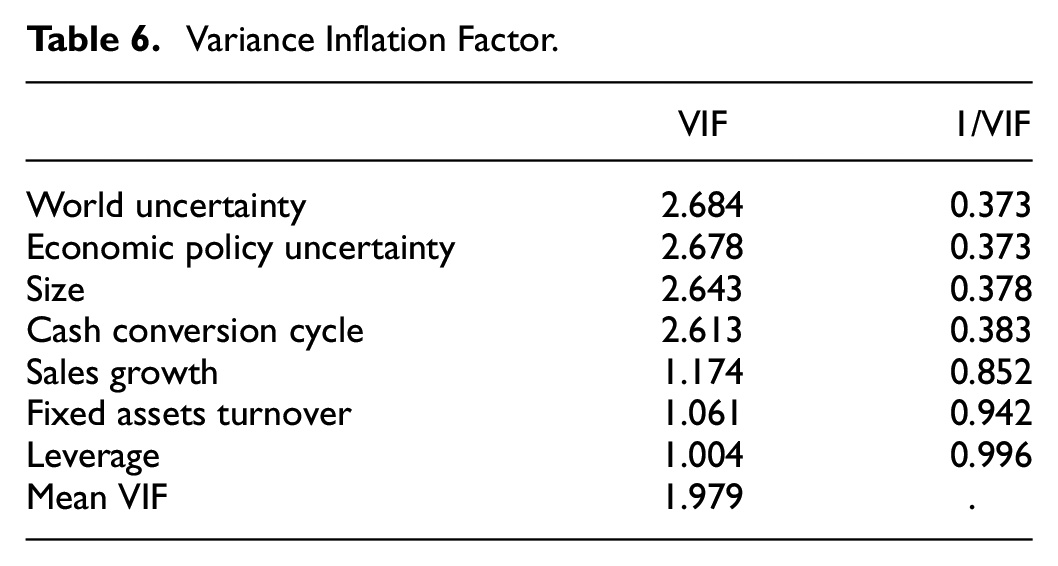
Table 6 confirmed that none of the independent variable relationships exceeded the upper limit of 10. We also computed the variance inflation factor (VIF) for each independent and control variable to prove that there was no multicollinearity in the sample. The absence of multicollinearity in the data was confirmed by the VIF values being less than five for each explanatory component. VIF is used to check for multicollinearity in panel data, and a mean number of more than 10 is considered multicollinear (Hussain et al., 2020).
Variance Inflation Factor.
In Table 6, we used fixed effect, random, and GMM models to represent the influence of the CCC on profitability (ROA, ROE, and ROOA). In this regard, the independent variables Cash Conversion Cycle, Fixed Assets Turnover, Leverage, Sales Growth, control variables Size, Economic Policy Uncertainty, and World Uncertainty were used, and the results showed a strong association between firm profitability and CCC. The study used balanced panel data, in which each unit of observation for each period was observed equally. We used the Hausman specification tests to demonstrate which of the fixed and random effect models was consistent and appropriate. The outcome revealed that Models 1 to 6 were all suitable for the fixed effect model. According to Baltagi (2021), the null hypothesis indicates that the data are not consistent with the alternative hypothesis but are consistent with the null hypothesis, and the alternative hypothesis indicates that the data are consistent with the alternative hypothesis.
The Effect of EPU on the Relationship Between CCC and ROA
The study result showed that CCC had a positive impact on profitability. This aligns with previous studies by Farhan and Yameen (2020) who discovered a significant correlation between CCC and firm performance. Their findings from regression analysis also revealed a significant correlation between profitability (gross operating profit) and CCC and argued that efficient and optimal CCC management was vital for increasing shareholders’ worth. Between 2010 and 2014, Zakari and Saidu (2016) examined how CCC affected the ROA of eight publicly traded telecommunications companies. He concluded from numerous linear regression studies that CCC had a positive impact on ROA, and Nazir and Afza (2009); Stephen and Elvis (2011) discovered a strong positive correlation between CCC and profitability. The CCC–ROA relationship is sensitive to industry factors such as competitive forces, production processes, and marketing channels. The positive impact at a 1% level between CCC and ROA indicates that shortening the CCC by reducing the time cash is freed up in working capital and speeding up collections results in a high return on ROA. A 1% increase in CCC will increase ROA by 0.012. As in our study, firms were pressured to shorten the time it took to collect receivables and sell inventory while shortening the time to make payments to boost profitability. Interestingly, CCC duration and firm profitability had a strong positive impact as measured by return on assets. Furthermore, by effectively controlling the cash conversion cycle, financial managers can lower the risk of future cash shortages and insolvency. The current study’s findings indicated that the CCC had a substantial positive impact on return on assets, showing that it was only sometimes required for the cash conversion cycle to be higher for profitability as measured by ROA to be higher. Leverage and fixed asset turnover positively impacted ROA, while sales growth had a statistically significant positive impact on ROA at a 1% level. The leverage impact shows that equity rather than debt finances the firm’s assets. Amarasekara et al. (2021) state that the most prosperous businesses are less likely to favor external finance. Margaritis and Psillaki (2010) and Alipour (2011) also concluded that total debt positively correlated with profitability. The positive impact of fixed asset turnover implies that firms effectively utilize their fixed assets to generate revenue from their property, plant, and equipment. The positive impact of sales growth results from increasing net income to stock prices. A company’s worth may rise due to more sales and better discounts for early payments made possible by higher working capital levels (Deloof, 2003). As a result, financial decisions influencing working capital are vital to a company’s survival, growth, and profitability (Akbar et al., 2021; Sensini, 2020). A 1% increase in leverage, fixed asset turnover, and sales growth will increase ROA by 0.094, 0.099, and 1.00, respectively. Firm size and Economic policy uncertainty had a statistically significant negative impact at a 1% and 10% level respectively and world uncertainty also has a negative impact on ROA. The result showed that an increase in economic policy and world uncertainty affected profitability. A negative impact of firm size on return on assets (ROA) implies that larger firms typically have lower ROA in comparison to smaller firms. In other words, as a company grows in size, its profitability as indicated by ROA declines. This suggests that a 1% rise in economic policy and world uncertainty will each cause the ROA to decrease by 0.005, 0.053, and 0.009, respectively. Additionally, the moderating variable had a statically significant negative impact at 10% on the relationship between CCC and ROA. A Fixed effect regression model was selected depending on the respective value of the Hausman specification test. The R-squared of model 2 is 21%. The value of 21% variation was explained in ROA by the independent variables in this Model. The Prob > F is 0.000 which is below 0.05. Hence, the model is significant.
The Effect of EPU on the Relationship Between CCC and ROE
The finding suggested that the CCC had a positive effect on revenue. A study by Amponsah-Kwatiah and Asiamah (2021) examined how WCM affected the profitability of listed manufacturing companies in Ghana from 2015 to 2019. According to their findings, inventory management, accounts receivable, accounts payable, cash conversion cycle, current assets, current ratio, firm size, and ROA and ROE all had a strong positive and significant association. A positive CCC denotes that the business must pay its supplier for the procurement of inventory even though it is yet to receive customer payment. Equity indicates that the cash conversion cycle does not always need to be low for profitability to be evaluated as high. Return on equity gives the firm’s managers and shareholders a clear indicator that the longer the CCC turnover in days, the less capital will be invested in current assets, and finally, the more capital investment will lead to greater firm profitability. The CCC has a positive effect on ROE at 1%, which means that increasing the CCC by 1% will boost ROE by 0.023. Leverage and sales growth had a statistically significant positive influence on ROE at a 1% level. An increase of 1% in leverage and sales growth, holding all other factors constant, may increase ROE by 2.00 respectively. Size, fixed asset turnover, economic policy uncertainty, world uncertainty, and the interaction variable had a statistically significant negative impact on ROE. One way to increase ROE is by increasing total asset turnover. This means that the change in the value of total asset turnover will positively change the value of ROE. A 1% increase in size, fixed asset turnover, economic policy uncertainty, world uncertainty, and the interaction variable will decrease ROE by 0.21, 1.00, 0.127, 0.032, and 0.027 respectively. The choice of the fixed effect regression model was made by the results of the individual Hausman specification tests. The R-squared of the model was 19%. The value of 19% variation is explained in ROE by the independent variables in Model 4. The Prob > F is 0.000 which was below 0.05. Hence, the model was significant.
The Effect of EPU on the Relationship Between CCC and ROOA
The result showed that the CCC had a statistically significant positive impact on ROOA. This means that funds are freed up in working capital (CCC), which tends to earn a return. Hence, a firm with a low level of working capital may achieve the return on capital employed (operating profit) expected by its investors. Therefore, there is a trade-off between liquidity and profitability when deciding on the right level of working capital. The CCC had a positive impact on ROOA of 1%, which indicated that an increase in the CCC by 1% would increase ROOA by 0.021. Sales growth had a statistically significant positive impact on ROOA at a 10% level. A 1% increase in sales growth would increase the ROOA by 1%. Leverage, Size, fixed assets turnover, Economic Policy Uncertainty, World Uncertainty, and CCC × EPU had statistically significant negative impacts at 1% and 5% on ROOA, except for Economic Policy Uncertainty and CCC × EPU. Based on the result, the leverage had a negative impact on ROOA, which meant that the firms use much more equity than debt to finance their assets (Rist & Pizzica, 2014). According to Firk et al. (2016) companies with moderate growth in sales or earnings exhibit the highest rates of return and value creation for their owners. Companies with high leverage use more debt than equity to finance their assets, and those with low leverage use equity rather than debt ( C. A. Ramezani, 2011). Fixed asset turnover rates reflect the relative productivity of assets: the sales volume level that UK firms derive from each pound invested in a particular asset. Considering everything else equal, we prefer higher asset turnover rates over lower ones (the reverse is true for liabilities). The result indicated that the turnover rate was negative. This implies that the firms invest in fixed assets, which results in a loss in productivity for UK non-financial firms. The result also suggested that the firms might have made a large investment in fixed assets, though there may be a delay before the new assets start to produce revenue. Additionally, the Firms needed to issue new products to revive their sales. Therefore, investment in assets must be optimized, not necessarily minimized. An increase of 1% by leverage, size, fixed asset turnover, Economic policy uncertainty, world uncertainty, and CCC × EPU would result in a decrease in ROOA by 0.137, 0.029, 1.00, 0.073, 0.025, and 0.016 respectively. Based on the result of the Hausman specification test, the fixed effect regression model was chosen. The R-squared of the model is 16%. The value of 16% variation is explained in ROOA by the independent variables in this Model. The Prob > F is 0.000 which is below 0.05. Hence, the model is significant.
To fully comprehend the enormous benefit output, a GMM two-step method that heteroskedasticity-adjusts the AR is recommended (Beck & Katz, 2011). Table 7 displays the estimated connection between these factors, including the control variables, at the same time. The consistency of the GMM estimator was predicated on the notion of no second-order autocorrelation and instrument validity, as proposed by Arellano and Bond (1991). As a result, there was no second-order serial association, as shown by the non-significant p values of the m statistics in Table 7. Additionally, the moment condition test findings from
The Moderating Role of EPU.

Source. Authors.
Significance at ***1%, **5%, *10%, levels, respectively.
Matemilola and Ahmad (2015) as reported in Table 7, did not reveal any issue of over-identification. The result showed insignificant values for all the models. Profitability, ROA (0.2024), ROE (0.9126), and ROOA (0.3154) indicated that there was no problem with endogeneity. This gave credence to the instrument’s validity. The Sargan for ROA, ROE, and ROOA (0.3242), (0.3766), and (0.2277), respectively. The GMM approach yielded outcomes comparable to those of the other methods. Arellano-Bond statistics also showed that first- and second-order autocorrelation did not exist. These findings demonstrated that the instrument was valid and had no first-order or second-order autocorrelation (Arellano & Bond, 1991).
Hypothesis
H1: There is a negative impact of CCC on the ROA of UK Non-Financial Firms.
According to model 1, where CCC was the indicator of Working Capital and ROA for profitability, the p > (z) was 0.000, and the coefficient of CCC was 0.001 which was negative. A 1% increase in CCC resulted in a decrease of ROA by 0.1%. Thus, H1 was accepted.
H2: There is a negative impact of CCC on the ROE of UK Non-Financial Firms
According to model 3, where CCC was the indicator of CCC and ROE for profitability, the p > (z) was 0.000 and the coefficient of CCC was (0.005) which was negative. A 1% increase in CCC resulted in a decrease of ROE by 0.5%. Therefore, H2 was also accepted H2.
H3: There is a positive impact of CCC on the ROOA of UK Non-Financial Firms
According to model 5, where CCC was the indicator of Working Capital and ROOA for profitability, the p > (z) was 0.000 and the coefficient of CCC is 0.004 which was positive. A 1% increase in CCC resulted in an increase of ROE by 0.4%. Thus, H3 would be accepted. H
H4: The relationship between CCC and the profitability of UK non-financial firms is impacted by uncertainty in economic policy. Therefore, we accepted H4 in light of the findings that were consistent with this hypothesis.
The study examined the moderating effect of EPU on the relationship between CCC and (profitability) was affected by industry; to test this, we used random effects to incorporate industry dummies into the analyses. Table 8 depicts that when the random effect method is used, the interaction effect of leverage and CCC has an adverse effect on ROA, ROE, and ROOA. This is true even after industry dummies were included in the analyses. Furthermore, CCC is still having a positive impact on profitability (ROA, ROE, and ROOA). These results implied that industrial variations did not affect the link between CCC and the dependent variables ROA, ROE, and ROOA. This confirmed the validity of the results.
Robustness Test/Industrial Dummies.
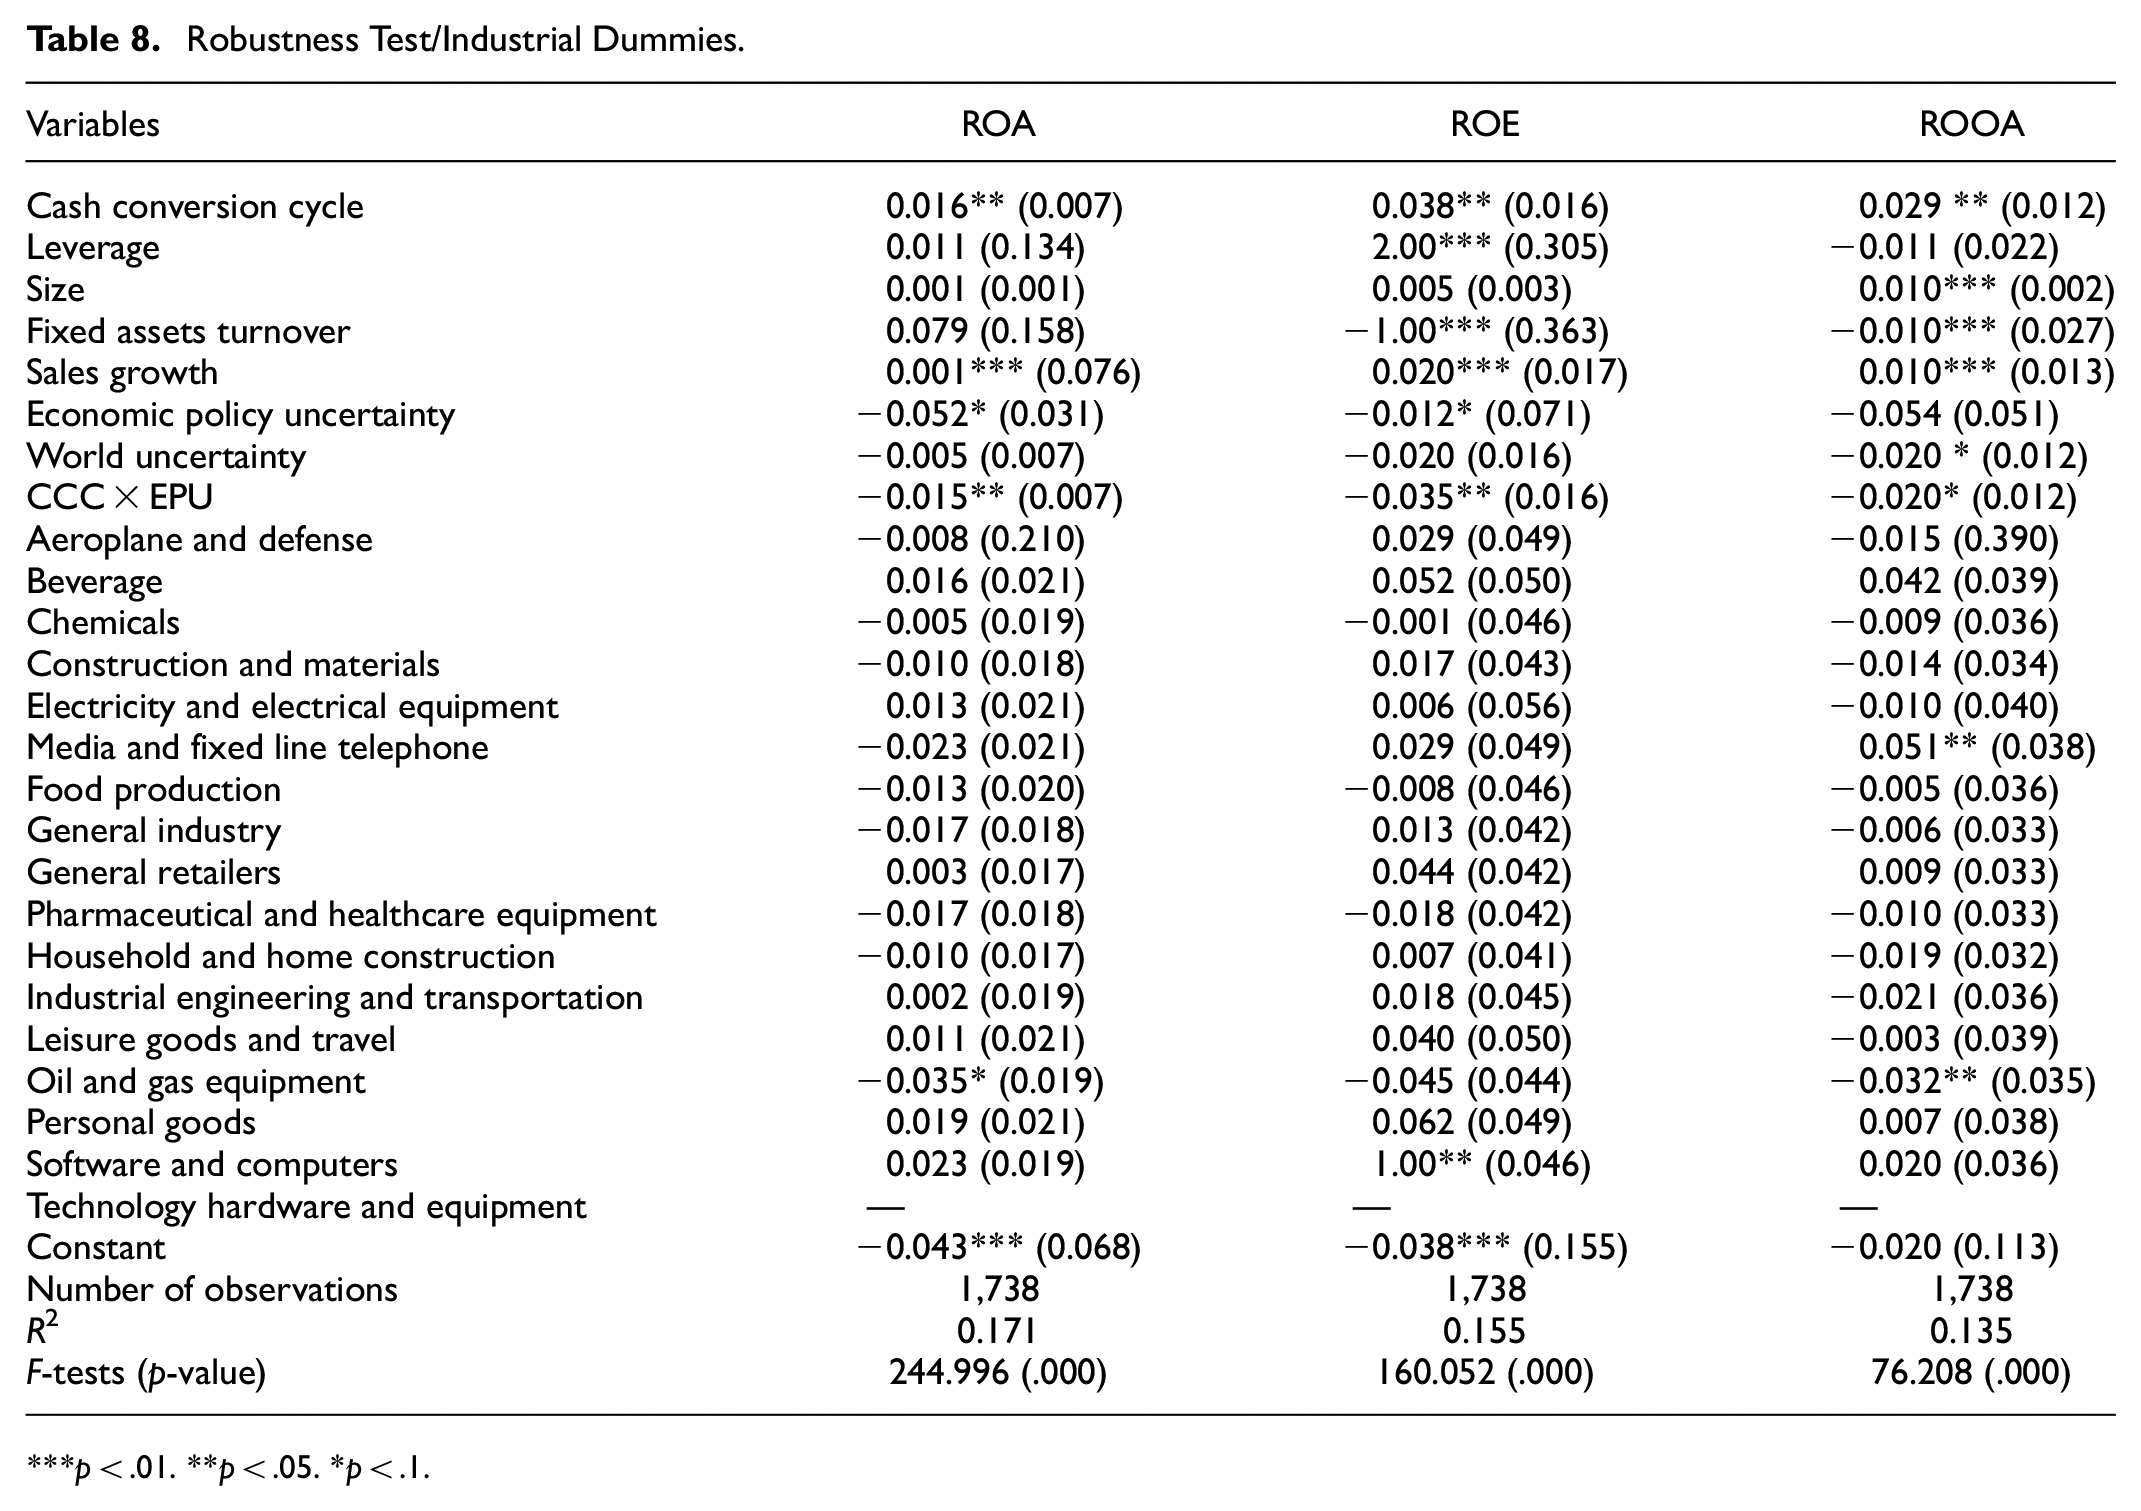
p < .01. **p < .05. *p < .1.
Conclusion
An important investment for businesses is usually working capital. In light of this, working capital management should be expected to impact a company’s profitability (Mehtap, 2016). The present study empirically investigated the moderating effect of economic policy uncertainty on the relationship between working capital and profitability of 199 non-financial firms listed in the UK 100 index for 16 years. The hypotheses were tested for this using six alternative models. While ROA, ROE, and ROOA measure a company’s profitability, our models used CCC, FAT, FS, SG, LEV, EPU, and WU to measure working capital management. This study determined that the interaction variable (CCC × EPU) had a detrimental effect on profitability of UK manufacturing firms. This suggested that there was a weaker association between working capital and profitability during periods of high economic policy uncertainty. Because economic policy uncertainty could cause instability in the UK financial markets, increasing risk and uncertainty for businesses, it was possible that this instability would have a negative impact on the relationship between working capital and profitability. As a result, businesses might be more circumspect about their financing and investment choices, which might result in lower levels of working capital and profitability. According to this study, the UK non-financial enterprises’ CCC impacted their profitability (ROA, ROE, and ROOA). The result showed that UK firms had a shorter CCC, indicating Management’s ability to control the firm’s working capital efficiently. This finding is similar to previous studies Ademola (2014), Gonçalves et al. (2018), and Lyngstadaas (2020) indicated a positive impact of CCC on profitability. The study results showed that managers could improve shareholder value by reducing inventories and accounts receivable days. This suggested manager would use debt rather than equity to expand their operating asset base at lower working capital levels. There was a level of working capital, however, over which a more considerable investment started to have an adverse impact on value creation due to the added cost of operating assets, raising the probability of bankruptcy and credit risk for firms.
Implication for Managers
Our study has various implications that could be helpful to managers and the study of working capital investment. Our findings imply that managers should be mindful of the impact of EPU on the relationship between working capital and profitability due to the costs associated with moving from the optimum working capital level.
Managers should keep an eye on changes in economic policy and how they might affect their company. This can assist managers in foreseeing and making plans for potential changes in working capital and profitability.
Managers should maintain adequate working capital even in times of economic policy uncertainty. They should focus on optimizing their working capital management practices to ensure that they have the necessary liquidity to meet their short-term obligations.
Managers should consider diversifying their funding sources to reduce their dependence on any one source of financing. This can help to mitigate the risk of disruptions to financing that can occur during times of economic policy uncertainty.
Managers should develop a plan for different potential economic scenarios. By considering different scenarios and developing plans for each one, they can be better prepared for potential changes in working capital and profitability.
Managers should also concentrate on the ROOA, which serves as a tool to identify the most profitable assets and those that may need to be sold or removed from service due to a lack of value-added. Matching individual running assets with specific revenue and expenses would be a unique discovery method. The ROOA may also influence management’s decision to leave one business and enter another. Selling the equipment and entering a different market can be a sensible idea if the equipment is too expensive and provides little return.
Managers should aim to increase sales and profits. This suggestion has been founded on the assumption that creating shareholder value and growth are the same. According to our empirical findings, increasing expansion does not increase a firm’s profitability or shareholder value. Contrarily, firms with modest revenue or profit growth have the highest rates of return and wealth creation for their owners. The sales growth of UK firms, on average, increased by almost 2% annually. They are growing net income with stock prices. A company’s worth may rise due to more sales and better discounts for early payments made possible by higher working capital levels (Deloof, 2003). As a result, financial decisions influencing working capital are vital to a company’s survival, growth, and profitability (Marino & Sensini, 2014; Sensini & Vazquez, 2021). Our results correspond with Fuller and Jensen (2010) cautions regarding the risks of giving in to market pressures for growth.
Managers should use the conservatism investment policy to invest in their assets to maintain the positive impact of CCC on profitability (ROA, ROE, and ROOA), which encourages high returns on operating assets. Increased investment in receivables and inventory balances may prevent interruptions in the manufacturing process, foster positive customer relationships, and increase sales.
Lastly, managers should keep track of uncertainty and factor it into their risk profiles because EPU has an impact on the prices of commodities, currencies, and stocks. Furthermore, to reduce or offset the losses brought on by such fluctuations, managers should discover tools and strategies to manage the risks associated with EPU and adopt a proactive approach to addressing the negative impact of economic policy uncertainty on the relationship between working capital and profitability. By monitoring economic policy changes, maintaining adequate working capital, diversifying funding sources, and considering scenario planning, managers can mitigate the effects of economic policy uncertainty and position their businesses for long-term success.
The following limitations should be considered when interpreting the findings and implications of the current study: First, only one country was involved in this study. Additionally, it only concentrated on manufacturing firms, and the sample size was small. To produce results equivalent to those discovered in the current study, future studies should use larger samples to examine the effect of economic policy uncertainty on the relationship between CCC and profitability (ROA, ROE, and ROOA) in both the UK and other countries.
Although this study could also provide additional information to researchers about how all the independent variables significantly affect a company’s profitability, the model could only explain the effects of ROA 21%, ROE 19%, and ROOA 16%. The remaining 79%, 81%, and 84% for ROA, ROE, and ROOA, respectively, might need further research.
Footnotes
Declaration of Conflicting Interests
The author(s) declared no potential conflicts of interest with respect to the research, authorship, and/or publication of this article.
Funding
The author(s) received no financial support for the research, authorship, and/or publication of this article.
Data Availability Statement
The data that supports the findings of this study is available from the first and corresponding author upon reasonable request.