
Abstract
Several instruments measure teacher responsibility, but none is available in Hungarian. Thus, this study aimed to adapt a Hungarian version of the Teacher Responsibility Scale (TRS) developed by Lauermann and Karabenick and validate it. The sample was pre-service teachers (N = 296). The results of exploratory and confirmatory factor analyses supported the hypothesized structure of the Hungarian version of the TRS. The four factors (responsibility for student motivation, student achievement, relationships with students, and teaching) had satisfactory internal consistencies (Cronbach’s alphas = .75–.83), and the test–retest reliability was moderate (intraclass correlation coefficients = .64–.75). Correlation patterns of the TRS with the Teacher Efficacy Scale and the Approaches to Instruction scale confirmed the convergent and divergent validity. Based on these results, the Hungarian version of the TRS is a valid, reliable instrument suitable for use in further research in Hungarian pre-service teachers.
Introduction
Compelling evidence suggests that teacher effectiveness plays a crucial role in student achievement in education systems (e.g., Darling-Hammond & Youngs, 2002; Hanushek, 2011; Hindman & Stronge, 2009; Staiger & Rockoff, 2010). Thus, understanding the factors that affect teachers’ self-efficacy is essential in research and education policy because of its possible effects, such as influencing teacher selection policies or enhancing the effectiveness of in-service and pre-service teacher training and, thus, teaching. Teacher effectiveness is a multidimensional construct (Burdsal & Harrison, 2008; Wayne & Youngs, 2003; Yeh, 2009). A component of this construct is teacher responsibility, an internal sense of commitment to produce or prevent specific outcomes related to teaching (Lauermann, 2014). Teacher responsibility has a dual status from the perspective of teacher effectiveness. On the one hand, teacher responsibility is a motivational antecedent of teacher behavior; on the other hand, teacher responsibility is a key element of teachers’ knowledge of their professional roles (Lauermann, 2017). Growing evidence suggests an association between teacher responsibility and teachers’—in-service and pre-service teachers’—motivation, instructional practices (or intended instructional practices in the case of pre-service teachers), and professional well-being (e.g., Daniels et al., 2017; Eren, 2017; Lauermann & Berger, 2021; Matteucci et al., 2017).
Several instruments measure teacher responsibility (e.g., Matteucci & Gosling, 2004; Silverman, 2010), but none is available in Hungarian. Thus, this research aimed to adapt Lauermann and Karabenick’s (2013) Teacher Responsibility Scale (TRS) to Hungarian and validate it among Hungarian pre-service teachers. The English version of the instrument has been successfully adapted into many languages and validated for pre-service and in-service teachers. The TRS is distinct from other instruments owing to its focus on areas that teachers usually consider highly relevant to their professional lives: responsibility for (1) student motivation, (2) student achievement, (3) building favorable relationships with students, and (4) providing high-quality instruction.
To separate teacher responsibility from teacher efficacy, distinct but linked constructs, Lauermann and Karabenick (2013) also developed a Teacher Efficacy Scale (TES). The TES and TRS focus on the same four domains. Thus, we also adapted the TES and used it to confirm whether the Hungarian version of the TRS was a valid instrument.
Defining a Sense of Responsibility
Personal responsibility refers to an individual’s internal sense of obligation and commitment to produce specific results, outcomes; or, by contrast, prevent those (Lauermann & Karabenick, 2011). It is considered an attitude; thus, individuals may have a varying sense of responsibility. An individual’s sense of personal responsibility may also be situation-specific and possibly highly dependent on the outcome type. Personal responsibility may be approach-oriented (i.e., focusing on producing a specific outcome) or avoidance-oriented (i.e., focusing on preventing a specific outcome). Moreover, it may refer to past, present, and future outcomes (Lauermann & Karabenick, 2013), and it is linked with self-regulation (Higgins, 1997) and intrinsic motivation (Li et al., 2008). The importance of personal responsibility has been confirmed in various areas of society, for example, being health conscious (e.g., Chan, 2019), protecting the environment (Bouman et al., 2020), or managing pandemics (Liu, 2021).
Personal responsibility research in the education context has mainly focused on teachers while exploring their sense of responsibility in producing certain outcomes or preventing undesirable outcomes while performing their duties (Lauermann & Karabenick, 2013). Teacher responsibility is a domain-specific aspect of personal responsibility and generally refers to the perceived influence an individual may have on the result of their work (Hackman & Oldham, 1976). Teachers usually feel personally responsible for various in- and out-of-class activities, such as creating a positive classroom atmosphere, preparing teaching materials, and communicating with parents (Fischman et al., 2006; Lauermann, 2014). Moreover, this personal responsibility is linked to specific outcomes, such as managing students’ individual differences (Silverman, 2010), or providing effective instruction for students with special needs (Jordan et al., 2009) or preferred motivational strategies in the classroom (Daniels et al., 2016, 2017; Matteucci et al., 2017).
The Teacher Responsibility Scale
The TRS measures the personal sense of responsibility of in-service and pre-service teachers. Its developers, Lauermann and Karabenick (2011, 2013), developed a new instrument because the literature had used ambiguous interpretations for teacher responsibility, and teacher responsibility often overlapped with teacher efficacy and locus of control. Moreover, questionnaires in the literature either used a broad perspective or focused on a specific area when measuring teachers’ sense of responsibility. By contrast, the TRS is an outcome-specific instrument that focuses on areas that the majority of teachers find relevant in their teaching. Their initial model measured teacher responsibility in five domains: (1) student motivation, (2) student achievement, (3) students’ self-confidence in their ability to learn, (4) having a positive relationship with students, and (5) providing the best possible instruction. However, due to its poor psychometric properties, the subscale of responsibility for students’ self-confidence was excluded from the final version.
The 13 items of the final questionnaire examine teachers’ sense of responsibility for avoiding hypothetical negative outcomes that may be relevant in any classroom (e.g., “I would feel personally responsible if a student of mine was not interested in the subject I teach.”). Items are measured in 10-point increments on an 11-point scale ranging from 0 (not at all responsible) to 100 (completely responsible).
What teachers feel responsible for is related to their beliefs in their capabilities (i.e., their perceived teacher self-efficacy). Self-efficacy refers to “I can” beliefs, and a sense of responsibility refers to “I should” beliefs (Lauermann & Karabenick, 2013). Lauermann and Karabenick (2013) aimed to distinguish teacher responsibility from teacher self-efficacy; therefore, they developed corresponding self-efficacy subscales in all domains of the responsibility subscales. Efficacy items refer to teachers’ beliefs in their abilities (e.g., “I am confident that I can get any of my students interested in the subject I teach.”) in the corresponding domains of the TRS: (1) student motivation, (2) student achievement, (3) relationship with students, and (4) teaching.
Lauermann and Karabenick’s (2013) study with in-service and pre-service teachers demonstrated that the TRS is a reliable measure of in-service and pre-service teachers’ sense of responsibility in these four domains. Their results also showed positive correlations among the four domains of responsibility and the corresponding domains of self-efficacy, but they could not be combined into a single model, which confirms that the corresponding subscales of the two questionnaires measure two empirically distinguishable constructs: teacher responsibility and teacher efficacy.
Review of the Studies Which Used the Teacher Responsibility Scale
The TRS, as aforementioned, was developed by Lauermann and Karabenick (2013) and has been translated into several languages and proved to be a reliable, valid instrument in the heterogeneous groups of in-service and pre-service teachers. Matteucci and Tomasetto (2018) adapted the TRS to Italian and validated it among (lower and upper) primary and secondary school teachers. Subsequently, the Italian adaptation has been used in the literature (e.g., Matteucci et al., 2017). Vaudroz and Berger (2019) adapted the questionnaire to French; validated it among pre-service teachers, beginner in-service teachers, and experienced in-service teachers; and used the instrument in further research (e.g., Berger & Girardet, 2021; Lauermann & Berger, 2021). Similarly, Eren (2014) adapted the TRS to Turkish and used it in further research (e.g., Eren, 2015; Eren & Çetin, 2019). Moreover, regarding the German language, Lauermann and Karabenick (2013) validated the German version of the questionnaire in a sample of pre-service teachers, and Wosnitza et al. (2014) and Helker et al. (2018) used the German adaptation, modified by adding a few items, in university teachers.
Research on teacher characteristics has focused on two distinct areas related to the TRS: in-service and pre-service teachers’ well-being and motivation and teachers’ practices (or their intended practices in the case of pre-service teachers). Matteucci and Guglielmi (2014), in secondary school teachers in Italy, found significant correlations between teachers’ work engagement and perceived personal responsibility for their students’ achievement and motivation. This link prevailed after controlling for teachers’ career satisfaction and a positive school climate. Subsequently, Matteucci et al. (2017) found that teachers with a high sense of responsibility demonstrated a higher level of work engagement and job satisfaction than teachers with a less-than-high sense of responsibility. A high sense of personal responsibility has been shown to have a positive impact on pre-service teachers’ feelings about teaching, optimism, and career satisfaction; hopes related to teaching; and engagement (Daniels et al., 2017; Eren, 2014, 2015, 2017).
The level of responsibility also affects which approaches and methods in-service and pre-service teachers consider effective in their everyday practice. Daniels et al. (2016) investigated whether the sense of responsibility was linked to the approaches pre-service teachers considered useful in motivating students. Within the framework of an elective adolescent-development university course, they performed two assessments—one each at the beginning and the end of the semester—to explore the relation of responsibility with the intended mastery or performance approach to instruction, the intended use of external rewards, and the intended use of rationales in participants’ teaching practice. Their results demonstrated that responsibility for student motivation was negatively related to performance goal structures and that responsibility for teaching was positively related to using rationales and negatively related to using extrinsic rewards. Responsibility for the relationship with students, as measured by the TRS, was positively related to a mastery approach to instruction; that is, pre-service teachers who aimed to build a positive relationship with their students preferred mastery goal practices. Matteucci et al. (2017) also confirmed a link between mastery goal-oriented instruction and a sense of responsibility among in-service teachers. Moreover, Lauermann and Berger (2021) found that the personal sense of responsibility of vocational teachers was positively related to autonomy and supportive teaching practices and strategies. Daniels et al. (2020) asked pre-service teachers to complete the TRS’s student motivation scale and then showed them two video recordings in which a teacher talked about their experience with student motivation. Their results showed that pre-service teachers with a low sense of responsibility for student motivation tended to agree with the teacher in the video recording who explained that student motivation was contingent on external factors not controllable by the teacher. Daniels et al. (2017) also used a person-centered approach to examine the relationship between a sense of responsibility and the intended approaches to instruction in pre-service and in-service teachers. Both groups had a low and a high responsibility cluster; however, a third cluster differed between the two groups. For pre-service teachers, this third cluster was characterized by a high sense of responsibility for their relationships and teaching practices (cluster of teacher-based responsibility). For in-service teachers, this third cluster was characterized by a high sense of responsibility for student achievement and motivation (cluster of student-outcome–focused responsibility). These combinations affected the outcomes under investigation only for pre-service teachers. In the low-responsibility cluster, pre-service teachers reported fewer mastery approaches, and more performance approaches than pre-service teachers in the other two clusters.
The literature review thus far shows that of the subscales of the TRS, pre-service and in-service teachers report the lowest sense of responsibility for student motivation (Berger & Girardet, 2021; Daniels et al., 2016, 2017, 2020; Eren, 2014, 2015, 2017; Eren & Çetin, 2019; Lauermann & Karabenick, 2013). Notably, only Matteucci and Tomasetto (2018) found that responsibility for student motivation was the second lowest scale among in-service teachers. All these results support other findings that suggest that—compared to additional domains related to teaching—pre-service and in-service teachers feel less prepared to motivate their students and consider this task difficult (e.g., Daniels et al., 2018; Elam, 1989; OECD, 2019; Turner et al., 2011).
Several studies have used the TRS and the Approaches to Instruction Scale (AIS; Daniels et al., 2016, 2017; Matteucci et al., 2017; Midgley et al., 2000). AIS consists of the mastery approaches scale and the performance approaches scale. The mastery approaches scale refers to teachers’ strategies that drive students to engage in academic work in order to develop their competence. The performance approaches scale refers to teachers’ strategies that drive students to engage in academic work in order to demonstrate their competence. Findings have usually demonstrated low correlations between the mastery approach to instruction and the subscales of the TRS, and the TRS subscales identified with these correlations differed across these studies. Matteucci et al. (2017) found a correlation between the consolidated index of the four subscales of the TRS and the mastery approach to instruction. Daniels et al. (2016, 2017) either found no correlations or a negative correlation with only one of the subscales of the TRS and the performance approach. Notably, the correlations Daniels et al. (2016) found were not statistically significant between the subscales of the TRS and those of the AIS.
Methods
Aims
The main purpose of this study was to contribute to the Hungarian adaptation and validation of the original TRS (Lauermann & Karabenick, 2013) by examining structural, convergent, and divergent validity; invariance between gender; internal consistency; and test-retest reliability over 6 weeks in a sample of pre-service teachers.
Sample
The participants were 296 pre-service teachers (68% women; mean age, 21.90 years [SD = 2.39 years]) attending the same university in a city in Hungary. A limited sample of 134 participants completed the TRS and the TES again during retesting to check reliability. Convenience sampling was employed. Of the 296 pre-service teachers, the majority were in their second year at the university; their majors were as follows: humanities (59%), natural sciences (17%), a double major in humanities and natural sciences (11%), and a double major in either humanities or natural sciences and physical education (13%). When making a decision on their career path, teaching was the number one career choice for 70% of the participants.
Instruments
This research is part of a complex study. In the first phase of this study, we used several questionnaires that mainly focused on pre-service teachers’ beliefs about learning motivation. The questions also explored the demographic background of the participants. Lauermann and Karabenick (2013) developed the TES to empirically distinguish the construct of teacher responsibility and teacher efficacy, and this study also uses the TES for this purpose. To investigate the divergent validity of TRS, we applied the mastery and the performance subscales of the AIS from the Patterns of Adaptive Learning Scale (Midgley et al., 2000). The AIS was included because it is among the most frequently used scales in the literature applying the TRS (e.g., Daniels et al., 2016, 2017).
Teacher Responsibility Scale
Both the original and the Hungarian versions contain 13 items and consist of four subscales: the responsibility for (1) student motivation, (2) student achievement, (3) having positive relationships with students, and (4) providing the best possible instruction. Each subscale comprises three items, except for the responsibility for student achievement subscale, which comprises four items. The original questionnaire uses an 11-point Likert scale; however, the Hungarian version uses a 5-point scale (1 = never, 5 = always). We performed this modification for two reasons: first of all, in order to comply with the Hungarian grading system which uses five grades to represent students’ achievement (1 = failed; 5 = outstanding achievement). Due to the easy identification of response options, the five-point analogy is widely used in Hungarian data collection settings. Moreover, as the participants completed more than one instrument, using a 5-point scale for each instrument might make the assessment more user-friendly than using multiple scale types. In addition, we found an example of a 5-point scale in the TRS in the literature (Daniels et al., 2021).
Teacher Efficacy Scale
The original and the Hungarian versions of the TES contain 13 items and four subscales to assess teacher efficacy. The structure and the response options of the TES are identical to those of the TRS.
Approaches to Instruction Scale
Two subscales of the AIS (Midgley et al., 2000) were used to assess the mastery and performance goal-oriented instructional practices of pre-service teachers. As in Daniels et al. (2020), the items and instructions were slightly modified to accommodate pre-service teachers’ intentions: “The following items are about what type of classroom you intend to establish once teaching. Please think about things you plan to do when you have your own classroom” (1 = strongly disagree; 5 = strongly agree). The mastery approach subscale comprises four items, and the performance approach subscale comprises five items. The subscales were proved reliable (Cronbach’s alpha = .61 and .71) and valid (Chi = 46.2, p < .001, comparative fit index [CFI] =0.933, root mean square error of approximation [RMSEA] =0.067).
Translation Process
The original scales of the TRS and the TES were translated into Hungarian using back-translation techniques (Brislin, 1986; International Test Commission, 2017; McKay et al., 1996). Forward translations from English into Hungarian were prepared by two independent translators and a researcher. Discrepancies among the three forward translations were then discussed and harmonized to develop the initial Hungarian scales. This harmonized translation was back-translated into English by an independent translator who had not participated in the forward translations and had not seen the original English version of the scales. The back-translated scales were then compared with the original English scales. Discrepancies, errors, and biases were highlighted, and discussed. The translation process was repeated until the back-translated items were equivalent to the items of the original English scales. The final version of the Hungarian scales was bilingually reviewed by an independent translator who had a degree in education science and a degree in translation to confirm that the original meaning of each item was retained. Regarding content, the items were the same as those in the original scales.
Data Collection
Pre-service teachers were contacted through their education science instructors at the university. Participants received written information on the aims and implementation of the research and signed a written consent form. No compensation was provided. Participants were also verbally assured that their participation affected neither their achievement evaluation nor their grades and that they had the right to rescind their participation in the study at any time. The research was approved by the Ethical Committee of the Doctoral School of Education of the University of Szeged, Hungary. Pre-service teachers completed the paper and pencil questionnaires during their university courses. During test-retest reliability testing, participants were asked to complete only the TRS and the TES.
Statistics
For the analysis of the structural validity of the TRS and the TES, the sample was randomly divided into two subsamples (n = 148 each) for exploratory (EFA) and confirmatory factor analyses (CFA). The size of the subsamples, including the ratio of participants to factors, was adequate for factor analyses (Kline, 2016; Thompson, 2004). With the first split sample, two EFAs were used in SPSS 25 to explore the scales’ underlying factor structure. EFAs were run with principal axis factoring and promax rotation, which allowed the correlation between factors. With the second split sample, to test the goodness-of-fit of the revealed factor structures, a CFA with maximum likelihood estimation using Mplus 8.0 software (Muthén & Muthén, 1998) was conducted. The fit of the hypothetical models and the actual data was characterized by the following indicators: χ2 test, Bentler CFI, Tucker-Lewis fit index (TLI), and RMSEA. The structural validity of the TRS and the TES were examined independently. Additional CFAs with models consisting of the two scales were performed to prove that the responsibility scale and the efficacy scale measured empirically distinguishable constructs across the four domains. The criterion of model fit was set according to Hu and Bentler (1999) (RMSEA ≤ 0.06; CFI ≥ 0.95; TLI ≥ 0.95). In case of the TRS and the TES, we also tested the configural, metric, and scalar invariance between genders.
The internal consistency of the subscales was measured by Cronbach’s alphas. Differences among the subscales of the TRS were examined by single-factor repeated measures analysis of variance (ANOVA) and its post-analysis. Paired samples t tests and intraclass correlation coefficients (ICCs) were used to determine test–retest reliability. ICCs were determined as follows: <.50 (poor), .50–.75 (moderate), .75–.90 (good), and > .90 (excellent; Koo & Li, 2016). A series of two-way mixed-effects models with measures of absolute agreement was used. While examining test-retest reliability, we tested the assumption that the ICC values are acceptable and the means and standard deviations do not differ significantly by the same subscales in the test–retest sample.
Convergent validity was examined by analyzing the patterns of relationships between the subscales of the TRS as well as the relationships between the subscales of the TRS and the TES. Divergent validity was investigated by analyzing the relationships between the subscales of the TRS and the AIS. The strengths of the relationships among the TRS, the TES, and the AIS subscales were determined by Pearson correlation. Paired sample t tests were used to examine the mean differences between responsibility and efficacy for each domain. To manage missing data (which ranged between 0% and 0.5% on the item level regarding all variables), we used full information maximum likelihood estimation.
Results
Exploratory Factor Analysis
Table 1 details the results of the EFA of the TRS; Table 2 contains those of the TES: the eigenvalues and variances of the four identified factors and the factor loadings. The values of the Kaiser–Meyer–Olkin (KMO) measure of sampling adequacy were found to be suitable for the TRS (KMO = 0.82) and TES (KMO = 0.79) (Kaiser, 1974); in the case of the TRS, the factors explained 58.60% of the variance, and in the case of the TES, 47.84%. All factors of the TRS were associated with the primary subscale as defined based on the literature review. Three subscales of the TES, self-efficacy for (1) student motivation, (2) relationship with students, and (3) teaching, fit the theoretical structure. However, based on the factor loadings, one item of the self-efficacy subscale for student achievement was linked to the student motivation subscale, and another item loaded, with almost identical values, into both student motivation and student achievement. Similarly, the third item of the efficacy for teaching scale also loaded into the student motivation scale. Since structural validity was also examined with CFA, these items were not dropped based on EFA.
Factorial Structure of the Teacher Responsibility Scale.

Note. RSM = responsibility for student motivation; RSA = responsibility for student achievement; RRS = responsibility for relationships with students; RTE = responsibility for teaching. Extraction method: Principal axis factoring. Rotation method: Promax with Kaiser normalization. Highest factor loadings for each item are in bold.
Factorial Structure of the Teacher Efficacy Scale.
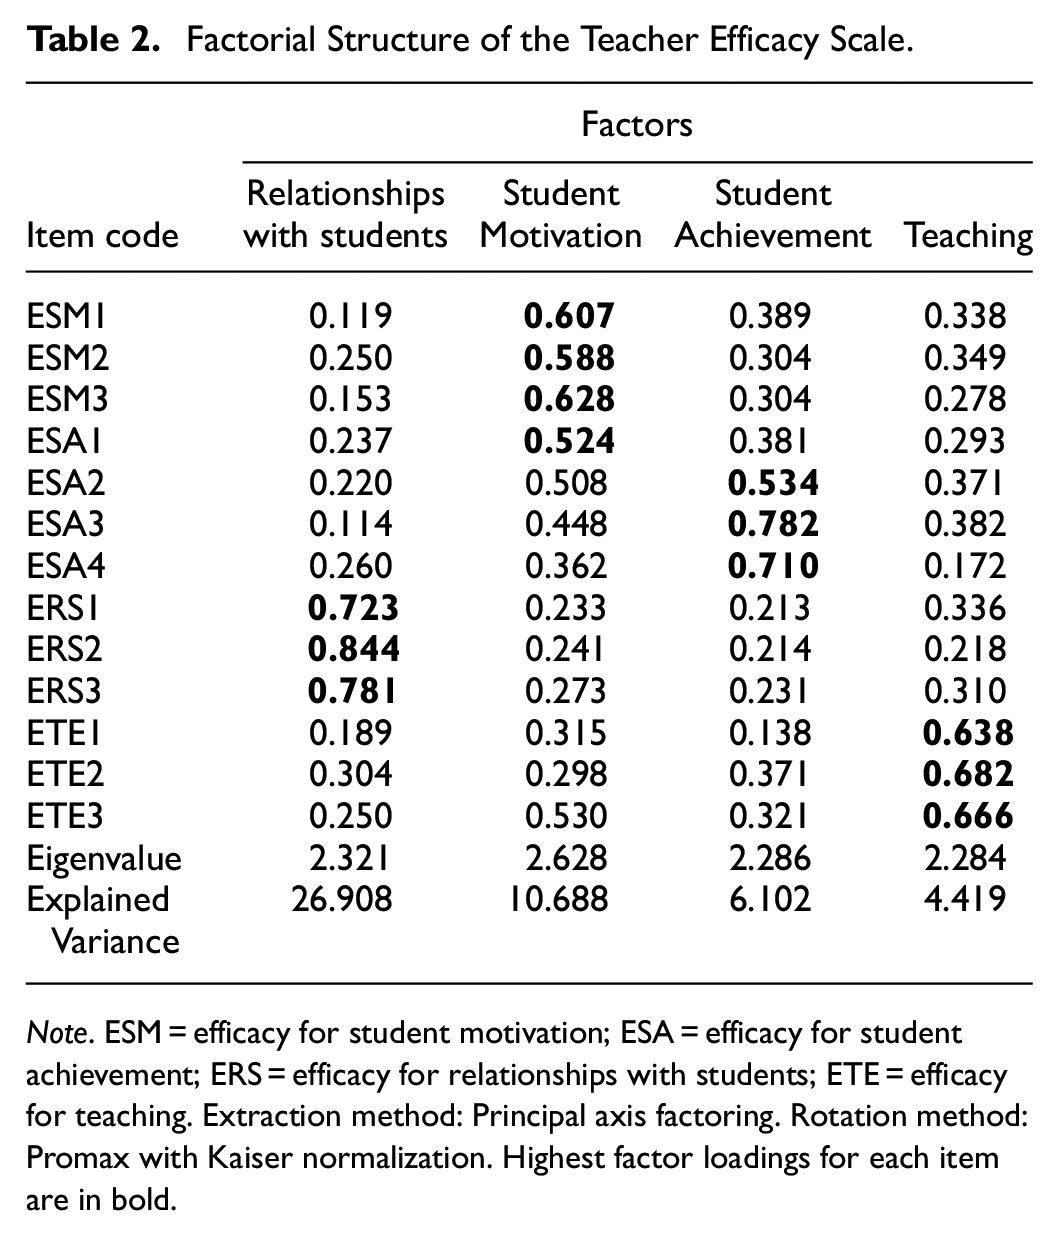
Note. ESM = efficacy for student motivation; ESA = efficacy for student achievement; ERS = efficacy for relationships with students; ETE = efficacy for teaching. Extraction method: Principal axis factoring. Rotation method: Promax with Kaiser normalization. Highest factor loadings for each item are in bold.
Confirmatory Factor Analysis
CFA performed on the other half of the sample indicated that the expected four-factor models both in case of the teacher responsibility scale (χ2 = 136.10; df = 59; p < .001; CFI = 0.951; TLI = 0.935; RMSEA = 0.067, Figure 1) and in case of the self-efficacy scale (χ2 = 154.02; df = 59; p < .001; CFI = 0.921; TLI = 0.895; RMSEA = 0.074, Figure 2) had good fit to the data, which suggests that the identified four-factor structures were replicable. According to the CFA results (Figures 1 and 2), all items showed high factor loading scores (for the responsibility scale: .58–.88, for the efficacy scale: .52–.84). Additional CFAs were conducted to test alternative models. The correlations among the four factors in each domain were moderate to high (Table 4) both in case of the teacher responsibility scale (.22–.66) and in case of the self-efficacy scale (.34–.87), which may indicate the test of single higher-order factor in both scales. A model with a single factor significantly decreased model fit compared to the original model shown in both scales. Model fit with a single factor in case of the teacher responsibility scale: χ2 = 696.14; df = 65; p < .001; CFI = 0.595; TLI = 0.514; RMSEA = 0.182. Model fit with a single higher-order factor in case of the self-efficacy scale: χ2 = 543.63; df = 65; p < .001; CFI = 0.601; TLI = 0.521; RMSEA = 0.159.

Four-factor model of the responsibility scale.

Four-factor model of the efficacy scale.
Additional analyses were performed to determine whether the responsibility scale and the efficacy scale measured empirically distinguishable constructs across the four domains. An eight-factor structure was examined with four responsibility factors and four efficacy factors. The fit of this model was satisfactory: χ2 = 449.58; df = 269; p < .001; CFI = 0.940; TLI = 0.927; RMSEA = 0.048. This eight-factor model is illustrated in Figure 3, and the correlations among the eight latent factors are shown in Table 4. Next, we tested whether a four-factor model that combines each pair of responsibility and efficacy factors from the same domain had a better fit to the eight-factor model. This model provided an acceptable, yet worse model fit compared to the eight-factor model: χ2 = 691.42; df = 276; p < .001; CFI = 0.862; TLI = 0.837; RMSEA = 0.072.

Eight-factor model distinguishing between the responsibility and the efficacy scales.
We conducted measurement invariance testing across genders in our models (Table 3). There were no differences between model fit estimations for the (2) configural, (3) metric, and (4) scalar models of the invariance testing of the two four-factor and the eight-factor constructs. Hence, the questionnaires measure the same construct in the group of males and females.
Goodness-of-Fit Indices for Measurement Invariance Across Gender.

Note. TRS = teacher responsibility scale; TES = teacher efficacy scale; CFI = comparative fit index; TLI = Tucker–Lewis Index; RMSEA = root-mean-square error of approximation. Model: (1) overall CFA model with two groups combined; (2) configural invariance; (3) metric invariance; (4) scalar invariance. According to the measurement invariance testing in MPlus, there are no significant differences between the three invariance models in each scale (p > .05).
Descriptive Statistics and Correlations
As Table 4 shows, Cronbach’s alphas for the TRS subscales were approximately .8, and those for the TES were approximately .7. For the AIS, internal consistency was slightly lower for the mastery approach subscale than for the performance approach subscale, but it was still satisfactory because it was above .6.
Descriptive Statistics, Internal Consistency, and Correlations for All Subscales in the Full Sample.

Note. TRS = teacher responsibility scale; TES = teacher efficacy scale; AIS = approaches to instructions scale.
p < .05. **p < .01
The single-factor repeated measures ANOVA demonstrated significant differences between the means of the TRS subscales (F = 239.94; p < .001). The means of the subscales were sorted in ascending order, considering the results of the post-analysis and significant differences were examined. Responsibility for student motivation had the lowest mean; responsibility for student achievement had a significantly higher mean than that of student motivation (p < .001). Responsibility for relationships with students and responsibility for teaching had higher means than responsibility for student motivation and student achievement (p < .001), and the difference in their values was nonsignificant (p = .46). Significant differences were also identified in the means of the TES subscales (F = 248.08; p < .001). Self-efficacy for student achievement and student motivation had the lowest means, and the difference between these two was not significant (p = .94). Self-efficacy for teaching had a significantly higher mean than the previous two subscales (p < .001); and self-efficacy for relationships with students had a significantly higher mean than any other TES subscale (p < .001).
Paired samples t tests were used to compare the corresponding domains of the TRS and TES. The differences between the means were significant for all subscales, except for a positive relationship with students. The difference was the highest for providing the best possible instruction (t(291) = 12.16; p < .001): pre-service teachers reported a higher sense of responsibility for teaching; however, their self-efficacy was lower. Similar results were found in relation to responsibility and self-efficacy for student achievement, although the difference between the two subscales was slightly lower (t(292) = 3.39; p = .001). The difference between the means of responsibility for student motivation and self-efficacy for motivation was significant; however, in this case, participants reported higher self-efficacy for student motivation and lower responsibility (t(292) = 4.61; p < .001).
The four subscales of the TRS exhibited mostly moderate, sometimes low (.22–.66), but significant correlations (p < .01). The highest correlations were between responsibility for student motivation and responsibility for student achievement (r = .66; p < .01) and between responsibility for relationships with students and responsibility for teaching (r = .64; p < .01). Regarding the corresponding subscales of the TRS and the TES, the correlations between them were significant in each case (.29–.55; p < .01). Correlations between the corresponding responsibility and self-efficacy subscales for student achievement (r = .49; p < .01) and relationships (r = .55; p < .01) with students were higher than those between the corresponding subscales for student motivation (r = .29; p < .01) and teaching (r = .33; p < .01).
The mastery goal-oriented teacher instruction subscale demonstrated moderate correlations with responsibility for having positive relationships with students (r = .41; p < .01,) as well as with self-efficacy for having such relationships (r = .34; p < .01). The mastery goal-oriented subscale showed low but significant correlations with all other subscales, except for responsibility for student motivation, which did not correlate with the mastery goal-oriented scale. No significant correlations were found between the performance goal-oriented teacher instruction subscale and any of the subscales of the TRS or the TES, except for self-efficacy for teaching, which demonstrated a low correlation with the performance goal-oriented scale (r = .17; p < .05).
Test–Retest Reliability
Table 5 shows the descriptive statistics, the results of the Paired sample t test, the intraclass correlation, and the 95% confidence intervals for the subscales of the TRS and the TES in the test–retest sample. Test–retest reliability was estimated based on the mean of multiple measurements, absolute agreement, and a two-way mixed-effects model. The ICC values of the subscales ranged between .64 and .75, indicating moderate test–retest reliability. The order of the means of the subscales of the TRS and the TES in the test–retest sample and the full sample in both assessments was similar. No significant differences were found in the mean values of the subscales in the two assessments, except for responsibility for teaching (t(133) = 2.13, p = .04); the mean of this scale was higher during the first assessment than during the retest.
Descriptive Statistics, Differences, Intraclass Correlation, and 95% Confidence Intervals for the Subscales of the TRS and the TES in the Retested Subsample.

Note. R = range; M = mean; SD = standard deviation; ICC = intraclass correlation coefficient; CI = confidence interval; Model: Two-way mixed effects. Type: Average Measures. Definition: Absolute Agreement. ICC is computed assuming the interaction effect is absent. All ICCs are significant at p < .001.
p < 05. **p < .001
Discussion
This study adapted the TRS into Hungarian and checked the psychometric properities of the Hungarian version in pre-service teachers. We examined the instrument’s structural, convergent and divergent validity, invariance across gender, internal consistency, and test–retest reliability over 6 weeks.
Analyses supported the hypothesized structure of the Hungarian version of TRS and TES, and in case of both scales confirmed the presence of four interrelated but distinct subscales (student motivation, student achievement, relationships with students, and teaching). The four factors of TRS had good internal consistencies (.75–.83) and were comparable with those obtained in the validation study (Lauermann & Karabenick, 2013). Measurement invariance analysis showed that the observed indicators reflected the same underlying constructs across gender.
Responsibility for student motivation had the lowest mean, followed by responsibility for student achievement, which had a significantly higher mean value. Responsibility for having positive relationships with students and responsibility for providing the best possible instruction had higher means than responsibility for student motivation and responsibility for student achievement and the difference between them was nonsignificant. This order of the subscales is in line with the order in Lauermann and Karabenick (2013). Eren (2014) and Daniels et al. (2016, 2017) found different TRS subscale orders among pre-service teachers but reported the lowest values for responsibility for student motivation.
Mean comparisons between the responsibility and efficacy subscales for each domain indicated that three of the four subscales were significantly different: student motivation, student achievement, and teaching. Sense of responsibility and self-efficacy with regard to relationships with students did not differ. Pre-service teachers’ sense of responsibility for student motivation was significantly lower than their sense of self-efficacy for student motivation; however, sense of self-efficacy for student motivation was higher than self-efficacy for student achievement or for teaching. With one exception, these patterns match those of Lauermann and Karabenick (2013). Ours and their findings differ: we found that responsibility was higher than self-efficacy in relation to student achievement in the Hungarian sample of pre-service teachers, and they found the opposite in the German sample (Lauermann & Karabenick, 2013). Our results, on the one hand, confirm that the Hungarian version of the TRS is a valid instrument, and on the other hand, they suggest that the relations between self-efficacy and responsibility differ as a function of the specific domain.
Correlation patterns of the subscales of TRS as well as correlations between the TRS and the TES subscales confirmed the convergent validity of TRS. Daniels et al. (2016, 2017) may provide reference data for divergent validity because they also used the TRS and the AIS in pre-service teachers; in 2016, the instruments were used twice, one each at different time points. The results showed low correlations between the mastery approach and subscales 1 to 3 of the TRS, and the performance approach scale either had no correlations or showed a low negative correlation with one of the TRS subscales. Similar patterns were identified in the Hungarian sample: the mastery approach demonstrated low correlations with two subscales of the TRS and a moderate correlation with one of the subscales, and the performance approach did not correlate with any of the subscales of the TRS.
The test–retest reliability of the Hungarian version of the TRS was moderate (ICC = .64–.75). According to our review of the literature, test–retest reliability has not been examined for the TR; therefore, we do not have a reference point for this finding. However, the values of the self-efficacy subscales were similar to those of the responsibility subscales (ICC = .64–.75), which may help interpret the results. The literature has used different instruments than those in this study and found that pre-service teachers’ self-efficacy, owing to classroom experiences, improved during their training (e.g., Hoy & Spero, 2005). Because the subscales of self-efficacy are associated with the subscales of responsibility, a reasonable assumption is that responsibility also improves over time. With regard to the responsibility for teaching subscale, our data showed slight but significant decline between the first and the second data collection. The questionnaire used in this study has not been used in a longitudinal research, therefore, no data is available about how the teacher characteristics under investigation here change. Daniels et al. (2021) used the motivation subscale of the TRS to examine the effects of an intervention program aimed at facilitating pre-service teachers’ beliefs about learning motivation and their practical approaches to it. Based on the finding that the motivation subscale of the TRS could be shaped within the framework of just one university course, it appears that teacher training may significantly shape teachers’ sense of responsibility. We assume this could be the reason for the difference found between the two assessments with regard to the responsibility for teaching subscale. This may offer an explanation to the differences mentioned earlier between Hungarian and German pre-service teachers with regard to sense of responsibility and self-efficacy. Overall, our results suggest that the test–retest reliability is satisfactory.
Our results confirm that the Hungarian version of the TRS is suitable for the assessment of pre-service teachers’ sense of personal responsibility and that the instrument can be used in further research in the field. The study of Daniels et al. (2021) suggests that the TRS may also be suitable for the impact assessment of intervention programs. Based on results in the literature (Daniels et al., 2017; Lauermann & Karabenick, 2013), a reasonable assumption is that the TRS is a valid instrument not only in pre-service teachers but also in in-service teachers; however, further research is necessary to confirm this assumption.
Our results should be interpreted in the context of the following limitations. First, the results of self-report instruments risk being distorted by social desirability bias (see Krumpal, 2013; Paulhus, 2001). Thus, further research should explore the role of social desirability bias in relation to the TRS. Karabenick et al. (2007) and Daniels et al.’s (2018, 2020) research methods that combined quantitative and qualitative approaches are satisfactory examples in this regard.
Second, we used convenience sampling which influences the generalizability of the findings. The participants were all pre-service teachers attending the same university and the same teacher training program, which may have affected their perceptions. In addition, most participants were in their second year of study and mostly had humanities or natural science majors, which is relevant regarding the heterogeneity of the sample. All these sample characteristics limit the generalizability of the study. As aforementioned, studies have found that self-efficacy improves by the end of teacher training owing to the classroom experiences pre-service teachers gain during their training (e.g., Hoy & Spero, 2005). The subscales of the two instruments being linked may affect the perceptions of pre-service teachers with regard to the sense of responsibility. This assumption draws attention to the importance of a longitudinal research design in further research to explore how sense of responsibility changes over time and which factors play a role, with special focus on practical classroom experiences.
Footnotes
Declaration of Conflicting Interests
The author(s) declared no potential conflicts of interest with respect to the research, authorship, and/or publication of this article.
Funding
The author(s) disclosed receipt of the following financial support for the research, authorship, and/or publication of this article: Project no. 138400 has been implemented with the support provided by the Ministry of Innovation and Technology of Hungary from the National Research, Development, and Innovation Fund, financed under the FK_21 “OTKA” funding scheme. This research was supported by the Research Programme for Public Education Development, Hungarian Academy of Sciences [grant number: SZKF-15/2021], and the Digital Society Competence Centre of the Humanities and Social Sciences Cluster of the Centre of Excellence for Interdisciplinary Research, Development and Innovation of the University of Szeged. József Balázs Fejes and Beáta Szenczi are members of the New Tools and Techniques for Assessing Students Research Group.
Ethics Statement
The research was approved by the Ethical Committee of the Doctoral School of Education of the University of Szeged, Hungary (Approval number:18/2021).
Data Availability Statement
Data is available from the corresponding author upon reasonable request.