
Abstract
Tetanus is a bacterial infection that causes painful muscular contractions throughout the body, usually starting in the jaw. Every year, 15,000 to 30,000 maternal deaths occur due to tetanus related to the delivery process. Exploring variations of women’s tetanus immunization is crucial for programmers’ planning and monitoring. As a result, this study aims to evaluate the spatial distribution of women’s tetanus vaccination coverage and risk areas of women’s tetanus vaccination clustering in Ethiopia. The study used Ethiopian Demographic and Health Survey data, which was conducted in 2016 using the Ethiopia Population and Housing Census 2007 sampling frame. From 15,683 women aged 15 to 49, a sample of 7,193 women was selected using eligible criteria. This study used spatial data analysis. To determine geographical danger zones for tetanus vaccination of women, cluster, hotspot analysis, spatial interpolation, and spatial scan statistics were used. At the regional level of Ethiopia, tetanus vaccination was spatially clustered (Global Moran’s I = 0.066, p = .0001). Western Tigray, eastern SNNP, and northern Oromia were identified as hotspots of poor tetanus vaccine coverage, whereas western Oromia, Afar, and southeast Amhara regions were designated as non-risky areas of Ethiopia. The spatial Bayesian kriging interpolation analysis predicted high-risk areas were the southwestern and eastern parts of Oromia, western Tigray, Harari, and Dire Dawa Western Tigray, the eastern SNNP, southern Amhara, and northern Oromia have been recognized as a significant hotspot. Health workers, programmers, government, and non-governmental organizations in Ethiopia will implement spatially based strategic interventions for women’s tetanus immunization.
Background
Tetanus is a bacterial infection that causes painful muscular contractions throughout the body, usually beginning in the jaw. Tetanus can infect people of all ages, but it is especially common and dangerous in babies and their mothers who have not received the toxoid tetanus vaccine. Tetanus (TT) that occurs during pregnancy or within 6 weeks after delivery is known as maternal TT, while neonatal tetanus occurs within the first 28 days of life (Blencowe et al., 2010; Messeret et al., 2018). In recent years, tetanus has been lethal in roughly 11% of cases (Blencowe et al., 2010). Every year, approximately 3.3 million newborns die worldwide, with approximately 9,000 fatalities occurring within the first 28 days of life (World Health Organization (WHO), 2015). NT is responsible for a significant number of these deaths (Khan et al., 2015), with the WHO estimating that 34,019 newborns died from NT in 2015 (Burgess et al., 2017). The disease is still a major public health concern in many parts of the world, particularly in low-income countries or districts where immunization rates are low and filthy birth practices (traditional childbirth at home) are common. In 2018, 25,000 newborns died from neonatal tetanus, according to WHO estimates (Cook et al., 2001; Njuguna et al., 2020).
Every year, 15,000 to 30,000 maternal deaths occur due to tetanus related to the delivery process (WHO, 2017). The World Health Organization (WHO) report showed that 90% of maternal and neonatal tetanus occurred in Southeast Asian (SEA) and Sub-Saharan African (SSA) countries, and almost all cases ended in death (WHO, 2012). Mortality rates in developing countries continue to be high and have not changed significantly in recent decades. In 27 studies, a total of 3,043 adult African patients died, with a fatality rate of 43%. The high fatality rate is probably due to the lack of mechanical ventilation in African medical facilities (Kyu et al., 2017). This is best done in an intensive care unit under the supervision of a critical care expert who is skilled in the management of the disease’s repercussions, especially early and vigorous airway control, treatment goals, and so on (Tekle et al., 2021).
Tetanus remains one of the leading causes of maternal and neonatal mortality despite efforts by the WHO to eradicate it. Every year, it kills almost 180,000 people (Owusu-Darko et al., 2012). In the poorest regions of the world, neonatal tetanus (NT) is responsible for 14% of newborn mortality (Njuguna et al., 2020), whereas maternal tetanus (MT) is responsible for at least 5% of maternal deaths (Owusu-Darko et al., 2012). Tetanus, which develops during or after pregnancy, kills an estimated 15,000 to 30,000 women each year (WHO, 2009). Despite efforts to improve maternal and newborn protection with TT immunization programs in many low-income countries, valid doses of TT (two or more) vaccine coverage remain low (Bethancourt et al., 2017; Duclos et al., 2009; Marchant et al., 2017). In India, for example, roughly 27% of the women who took part in the study did not receive any TT vaccine during their most recent pregnancies (Singh et al., 2012). Ethiopia has the highest rates of morbidity and mortality rates in the world (Anatea et al., 2018), due to low TT vaccine coverage and the large number of deliveries carried out at home in filthy circumstances. Identifying factors impacting mothers’ TT immunization status is crucial for countries like Ethiopia, where institutional delivery is very low, with the current global push for MNT removal women to receive TT vaccination, which is one of the proven ways for removing MNT.
Ethiopia had previously begun an ambitious drive to eradicate maternal and neonatal tetanus (MNT). Except for the Somali Region, all regions of the country were designated as MNT-free in 2011. Ethiopian demographic and Health Survey (EDHS 2016) report shows that the proportion of TT protective dose immunization was 49% (Central Statistical Agency and ICF, 2016).
The immunization dropout rate was reported to be 72.3% in a community-based cross-sectional survey in Debre Birhan (Belihu et al., 2017) Northern Ethiopia. A different study was carried out in several parts of Ethiopia, including the Error District and Eastern Ethiopia (51.8%) (Gebremedhin et al., 2020), Tselemti District (61.8%) (Kidane, 2005), Damboya Woreda, Kembata Tembaro (72.5%) (Dubale Mamoro & Kelbiso Hanfore, 2018), DebreTabor town (56.2%) (Mihret et al., 2018), Dukem Town (39.2%) (Anatea et al., 2018), and Hawzen, the eastern Tigray (40.2%) (Gessesse et al., 2021) showed that none of the research met the WHO target level.
Understanding the area-based heterogeneity of TT vaccination handling is the first step toward evidence-based decision-making in vaccine-preventable disease prevention and control programs, and detecting spatial variation is useful to identify gaps in government policymakers’ performance that would otherwise go undetected by routine vaccination coverage checks (WHO, 2019). The objective of this study is to evaluate the spatial distribution of women’s tetanus vaccination coverage and further identify the risk areas of women’s tetanus vaccination clustering in Ethiopia.
Study Area, Data Source, and Study Design
Ethiopia had nine regional states (Tigray, Afar, Amhara, Oromiya, Somali, Benishangul Gumuz, Nationalities and People (SNNP), Gambela and Harari) and two city administrations (Addis Ababa and Dire Dawa) when this study was conducted. The study used secondary data from the 2016 EDHS. The 2016 EDHS was based on stratified multistage cluster sampling, and it was expected to be demonstrative in terms of acceptable demographic and health indicators at the regional and national levels. Using probability proportional to the size of the EA, 645 clusters of enumeration areas (EA) (202 urban and 443 rural) were discovered in the first stage (EDHS, 2016). Random samples from 18,008 households were chosen at random from all recognized EAs in the second stage. In total, 15,683 women aged 15 to 49 were successfully interviewed. Data was also collected from moms in the reproductive age range of 15 to 49 years old (Kebede et al., 2020).
Eligibility Criteria
The target population of the study was all women aged 15 to 49 who participated in the 2016 EDHS. Of this population of 15,683 women aged 15 to 49, only women’s responses to tetanus vaccination were included in the study. Based on the eligibility criteria the study included a total of 7,193 reproductive women as a sample of the study.
Data Management and Analysis
Two survey clusters were initially excluded from the Demographic and Health Survey coordinates file, resulting in a total of 645 survey clusters. The other 21 survey clusters were removed from our analysis due to missing global positioning system (GPS) cells. Finally, the study analysis was done using ArcGIS 10.8 and SaTScan 9.6.
Spatial Patterns Autocorrelation
According to the geographical autocorrelation, the pattern of TT vaccination among women in this study is either dispersed, clustered, or randomly distributed. By collecting the whole data set and providing a single output value that spans from −1 to +1, the Global Moran’s I spatial statistics were utilized to measure spatial autocorrelation. Closer to −1 suggests dispersed coverage of the TT vaccine, closer to +1 indicates clustering women’s coverage of the TT vaccine, and I = 0 shows randomly distributed TT vaccination coverage. The null hypothesis (TT vaccine coverage is randomly distributed) is rejected when Global Moran’s I (p = .05) is statistically significant, indicating the presence of spatial autocorrelation (Agegnehu & Alem, 2021).
Cluster and Outlier Analysis
Local Moran I determine whether there were correlated (low coverage women TT vaccination to low coverage TT vaccination) and low to low (high coverage TT vaccination to high coverage TT vaccination) clusters, or negatively correlated (low coverage TT vaccination to high coverage TT vaccination) and high coverage (TT vaccination to low coverage TT vaccination) clusters of high values (low coverage TT vaccination to low coverage TT vaccination) and low to low (low coverage TT vaccination to low coverage TT vaccination) cluster (high coverage TT vaccination to high coverage TT vaccination).
It also determines whether a low-coverage TT vaccine is largely surrounded by high-coverage TT vaccination or a high-coverage TT vaccination is primarily surrounded by low-coverage TT vaccination as an exception. An outlier is a case with a negative Moran’s I that is surrounded by cases with dissimilar values, whereas a cluster is a case with a positive Moran’s I that is bounded by neighboring cases with similar values (Anselin et al., 2007; Krivoruchko, 2012).
Hotspot Analysis
It also influences whether a low-coverage TT vaccine is generally surrounded by high-coverage TT vaccination or is primarily surrounded by low-coverage TT vaccination as an exception. A case with a negative Moran’s I that is surrounded by cases with dissimilar values is an outlier, whereas a case with a positive Moran’s I that is circumscribed by nearby cases with comparable values is a cluster (Anselin et al., 2007; Krivoruchko, 2012; Naish & Tong, 2014).
Spatial Interpolation
Ordinary kriging, universal kriging, and empirical Bayesian kriging are the most acceptable probabilistic interpolation methods for predicting vaccination coverage in unobserved areas based on observed data. Ordinary kriging has the lowest residuals and the root means square error value based on the parameters, hence it was chosen for this investigation. Based on observed measures, kriging spatial interpolation is a technique for predicting the percentage of TT vaccination coverage among women in untested areas of the country. Finally, because it contains spatial autocorrelation and statistically optimizes the weight, the ordinary kriging spatial interpolation approach was utilized to forecast TT vaccination coverage among months in unobserved areas of Ethiopia (Agegnehu & Alem, 2021; Bhunia et al., 2018).
Spatial Scan Statistical Analysis
The spatial scan statistical method is frequently recommended because it is effective at finding small clusters and has higher power than other spatial statistical methods (Anselin et al., 2007). It looked for statistically significant spatial hotspots (clusters with low coverage of TT vaccination coverage). Women who did not receive the vaccine were treated as cases, while those who did receive the vaccine were treated as controls and fitted into the Bernoulli model. The number of cases in each place was distributed according to a Bernoulli distribution and the model required data on cases, controls, and geographic coordinates. The default maximum spatial cluster size of 50% of the population was utilized as an upper limit, allowing tiny and big clusters to be found while clusters with more than the maximum limit were ignored. There is no risk difference within and outside the scanning window, according to the null hypothesis. When compared to locations outside the window, places with a high log-likelihood ratio (LLR) and p = .05 were judged high risk. Finally, significant and most likely clusters were identified using LLR, relative risk, and p-value.
Ethical Considerations
The EDHS 2016 data was downloaded and used with the approval of Ethiopia’s Central Statistical Agency. After filling out a brief registration form, we were able to access the dataset and write the study’s title and significance on the website. With the help of ICF International, the datasets were downloaded using the accessible website at http://www.measuredhs.com. Data were only downloaded for this study. Without EDHS’ permission, the dataset was not shared with other researchers. There was no requirement to identify any household or individual respondents interviewed in the EDHS because the data were treated confidentially.
Result
Incremental Spatial Autocorrelation
The graph’s peak denotes the distance at which the clustering is most evident. So, there are several peaks, which means that the pronounced clustering was reflected at multiple distances. The statistical significance of the z-score values is shown by the color of each point on the graph. Using 10 distance bands starting at 121.8 km, incremental spatial autocorrelation revealed that women’s tetanus protective clustering was identified at 166.15 km and 210.5 km distances. Significant z-scores (z-scores = 3.7; p = .001 and z-score = 3.73; p = .001, respectively) suggest that geographical clustering of women tetanus protection was most pronounced at distances of 166.15 and 210.5 km, respectively (Figure 1).
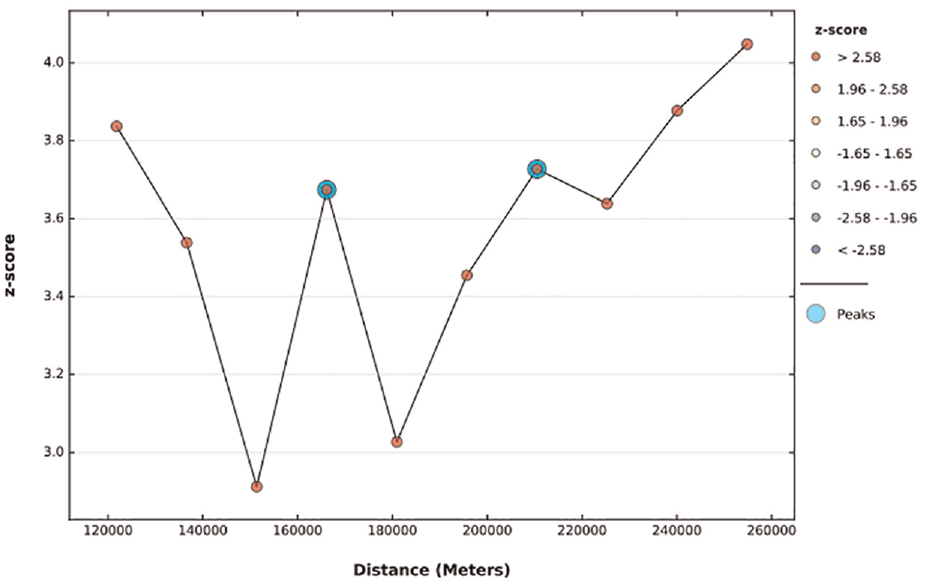
Incremental spatial autocorrelation of women’s tetanus protection in Ethiopia, 2016, EDHS.
Spatial Patterns of Tetanus Protection
In Ethiopia, spatial patterns were discovered. The worldwide Moran I value (I = 0.066, z-score = 4.111, p = .0001) revealed a substantial group of tetanus-free women throughout the country. Tetanus protection had a statistically significant regional clustering pattern among Ethiopian women (Figure 2).
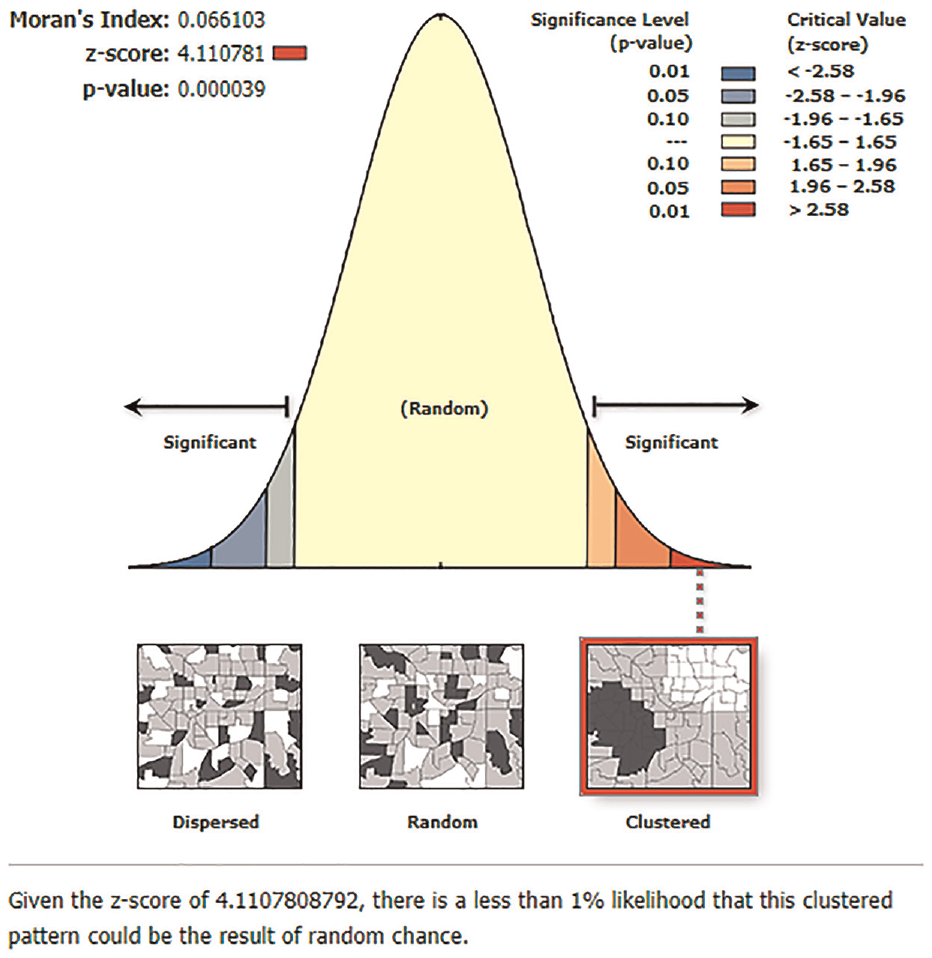
Spatial autocorrelation based on feature locations and attribute values using the Global Moran I statistic.
Hot and Cold Spot Analysis
Figure 3 depicts a tetanus protection hotspot and coldspot study. Western Tigray, eastern SNNP, southern Amhara, and northern Oromia were identified as statistically significant hot spot regions (risky areas of the study), whereas western Oromia, Afar, and southeast Amhara were identified as statistically significant cold spot regions (non-risky areas of the study) (Figure 3).
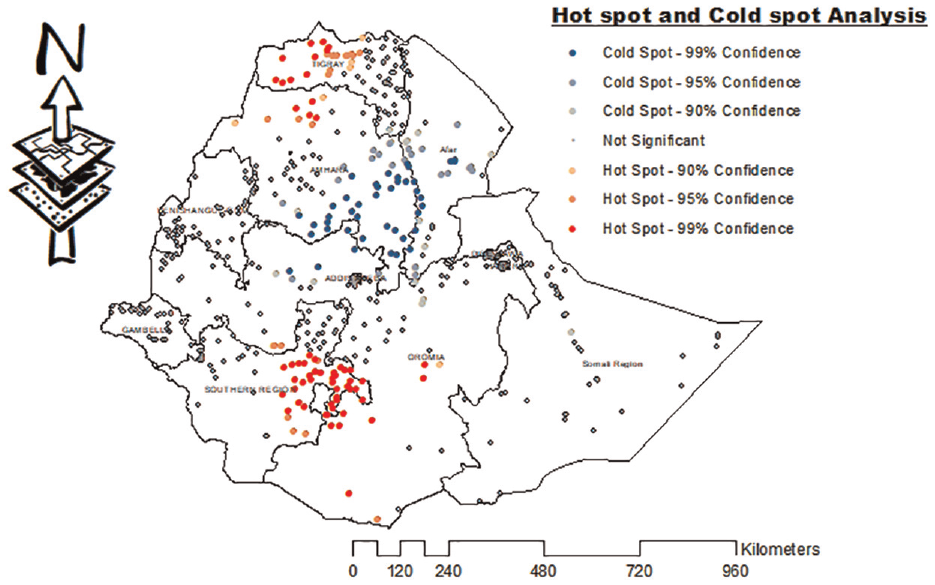
Hotspot analysis of women protected from tetanus in Ethiopia, EDHS 2016.
Spatial SaTScan Analysis
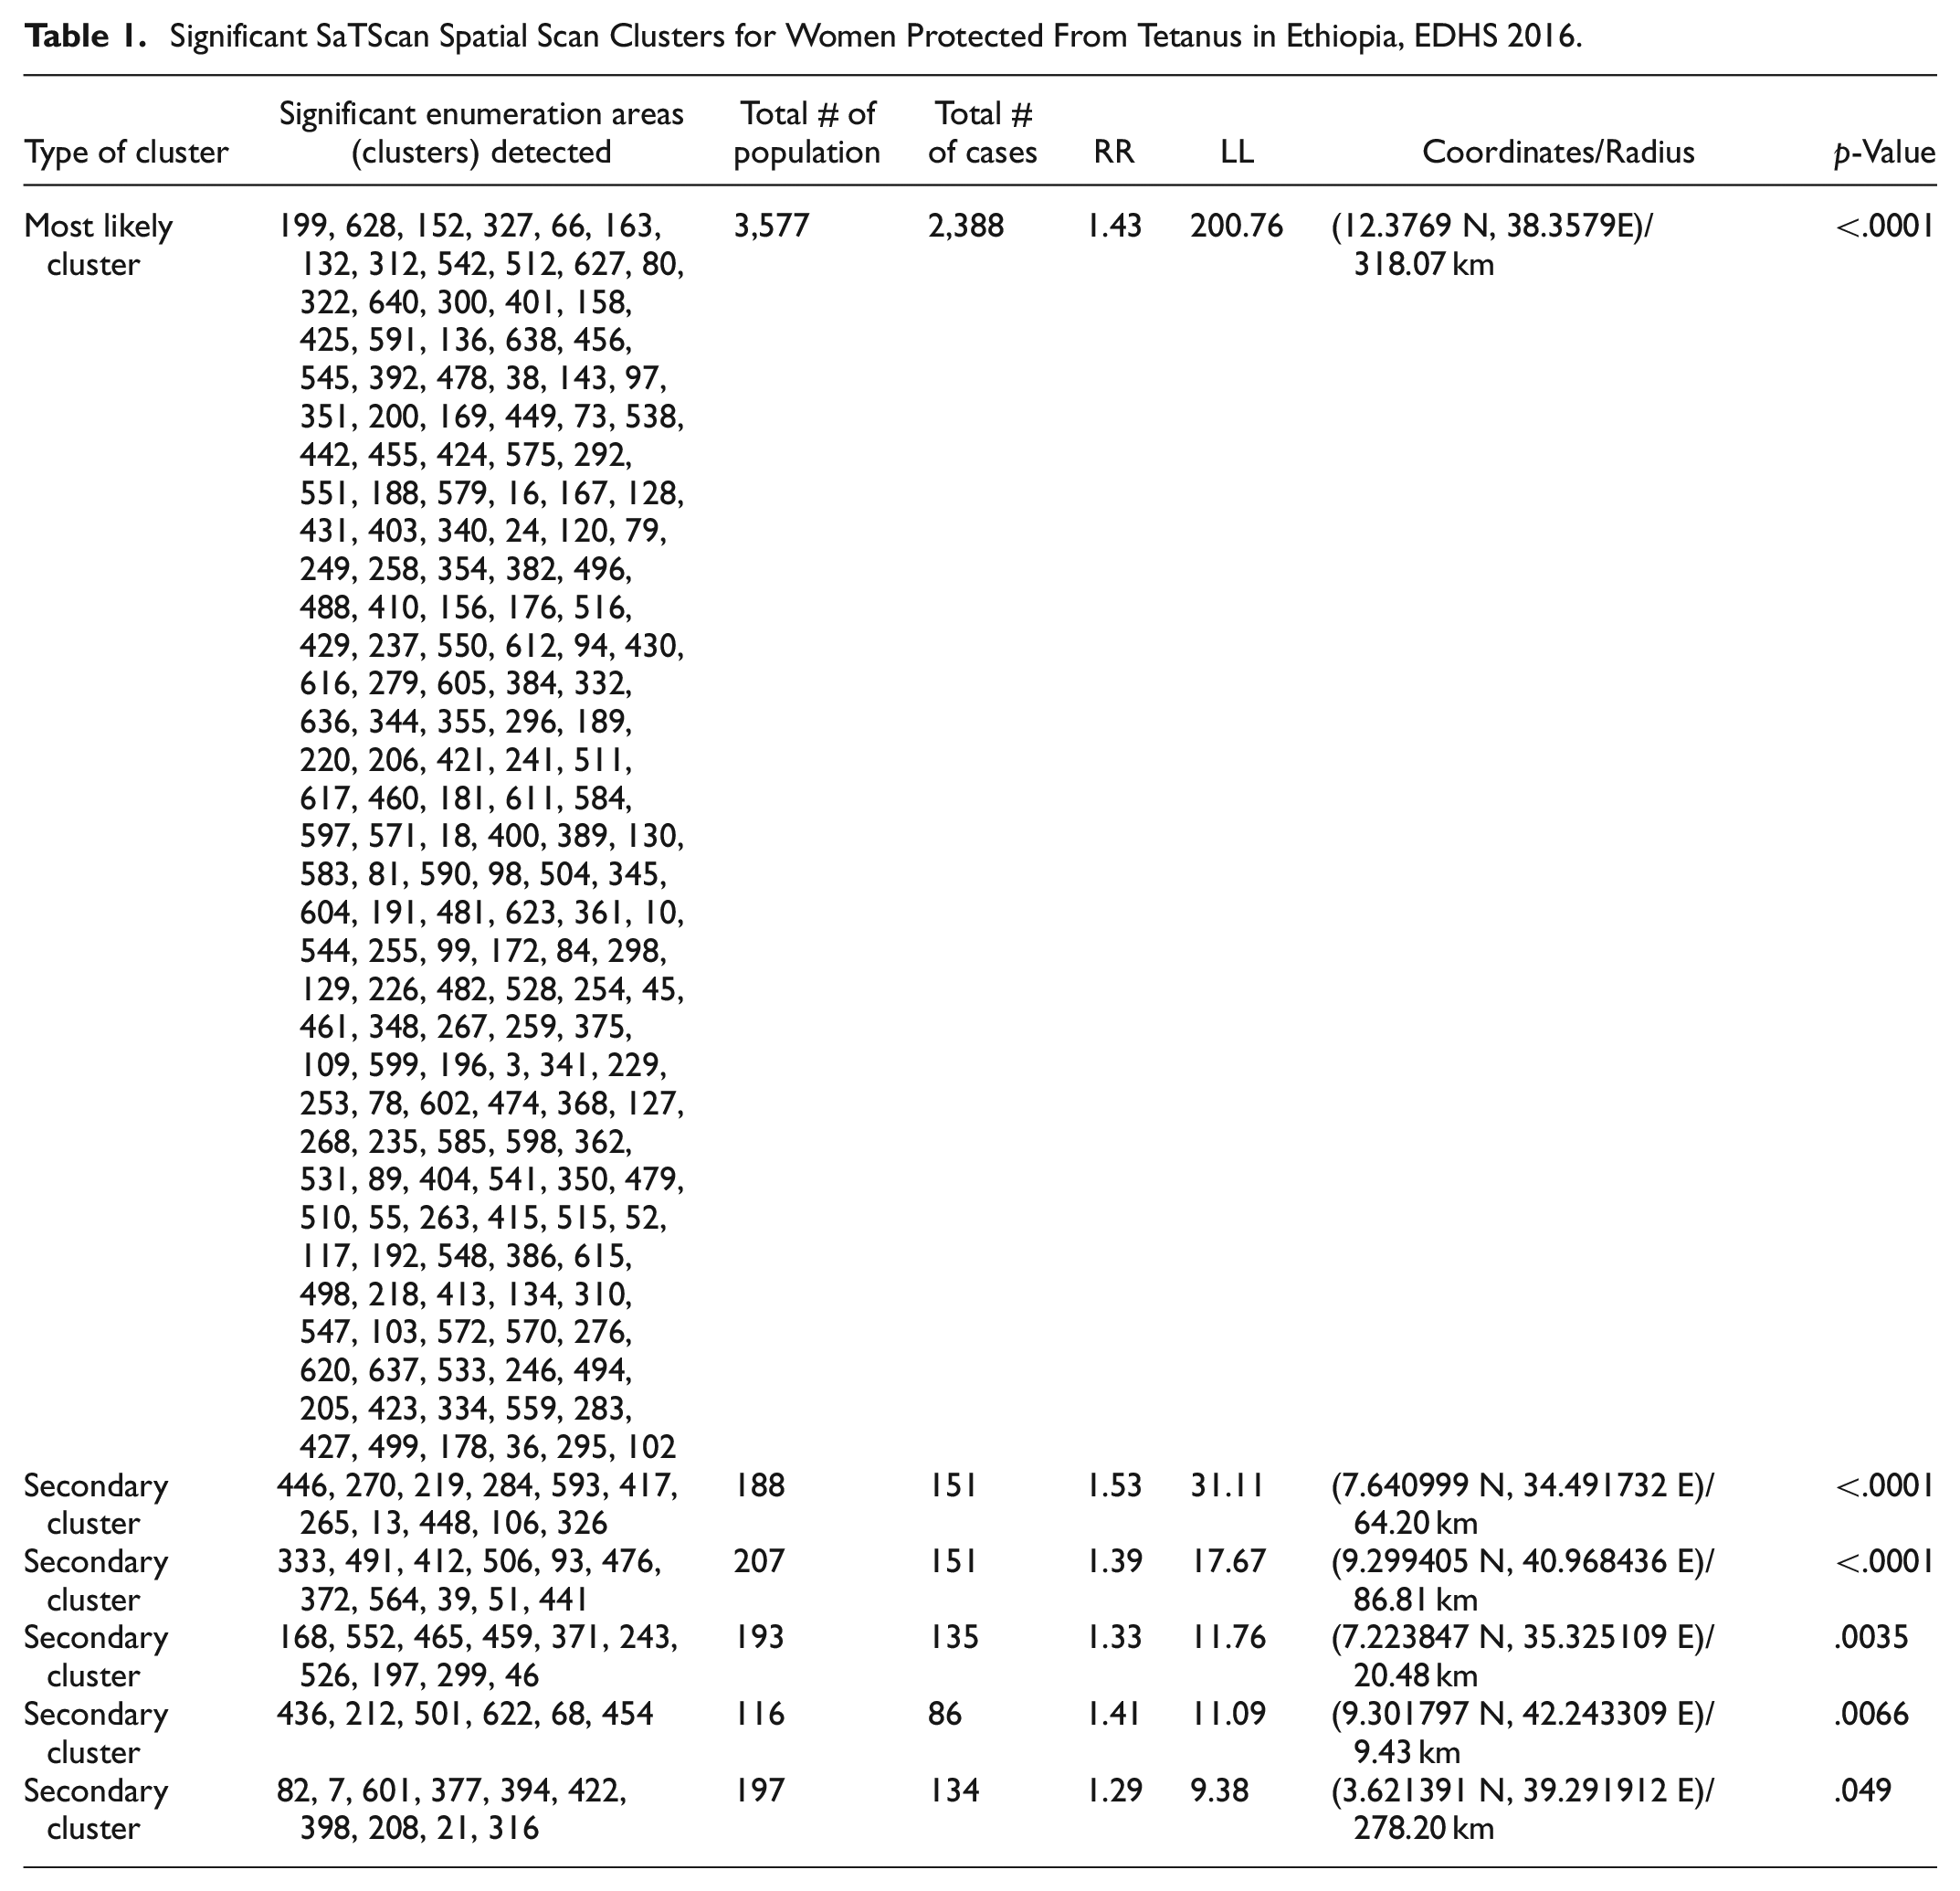
A total of 230 significant clusters were identified. Of these, among the significant groups, 182 were the most likely (primary groups) and the other 48 were secondary. The spatial window of the primary cluster was located at Tigray, Amhara, and Afar which was centered at (12.376936 N, 38.357984 E)/318.07 km, RR = 1.43, and log-likelihood ratio (LLR) of 200.76 at p < .001. It showed that women in the spatial window had 1.43 times higher tetanus protection than those outside the window. The spatial window of the rest five secondary clusters was located in the Gambella centered at (7.640999 N, 34.491732 E)/64.20 km, RR = 1.52, and LL = 31.11, eastern Oromia centered at (9.299405 N, 40.968436 E)/86.81 km, RR = 1.39, and LL = 17.67, western SNNP centered at (7.223847 N, 35.325109 E)/20.48 km, RR = 1.33, LL = 11.76, Dire Dawa and Harari centered at (9.301797 N, 42.243309 E)/9.43 km, RR = 1.41, LL = 11.09 and southern Oromia regions centered at (3.621391 N, 39.291912 E)/278.20 km, RR = 1.29, and log-likelihood 9.38, respectively (Table 1 and Figure 4). Women within the spatial window have a higher risk of tetanus protection than women outside it.
Significant SaTScan Spatial Scan Clusters for Women Protected From Tetanus in Ethiopia, EDHS 2016.

SaTScan Analysis for women protected from tetanus in Ethiopia, EDHS 2016.
Spatial Interpolation
The spatial Bayesian kriging interpolation analysis predicted high-risk regions for tetanus. The prediction of high-risk areas was indicated by red predictions. The southwestern and eastern parts of Oromia, western Tigray, Harari, and Dire Dawa regions were predicted to be more risky areas compared to other regions. In the southern part of Somalia, the western Gambela, Afar, central Amhara, and Addis Abeba were identified as risk areas (Figure 5).

Empirical Bayesian kriging interpolation of women protected from tetanus in Ethiopia, EDHS 2016.
Discussion
In Ethiopia, immunization status was non-random or clustered, according to the findings of this study. A clustering trend in TT vaccination coverage across the country was revealed in the global autocorrelation analysis (Global Moran’s I = 0.066, p = .0001). This suggests that the coverage of TT vaccination was roughly identical in different parts of the country. For tetanus non-vaccinated women, the spatial Bayesian kriging interpolation analysis identified high-risk locations. Compared to other regions, the southern and eastern parts of Oromia, western Tigray, Harari, and Dire Dawa were predicted to be high-risk zones. Women in the locations may have a less understanding of the necessity of immunization than mothers in other regions (Hailu et al., 2019), as well as the fact that they are nomads who do not receive follow-up antenatal care. Based on geographic Bayesian kriging interpolation research, southern Somalia, western Gambela, Afar, central Amhara, and Addis Abeba were determined to be somewhat risky sections of the country. Western Tigray, eastern SNNP, southern Amhara, and northern Oromia were found as hotspot clusters of poor TT vaccine coverage, whereas western Oromia, Afar, and southeast Amhara were identified as cold spot (non-risky) locations. This study is also in line with the other studies, which showed that Somalia, Afar, Gambella, and SNNPR do have not good health service accessibility and utilization and sociocultural differences in the community. This showed that these regions have socio-demographic variation, low healthcare-seeking behavior, low immunization coverage, and low vaccine uptake due to lack of permanent residence as the community is nomadic and pastoralist inhabitants (Lakew et al., 2015; Tamirat & Sisay, 2019). It’s possible that mothers in the given regions have less knowledge and practice about the importance of vaccination than mothers in other regions (Hailu et al., 2019), and have a lower antenatal care follow-up in the areas, lower educational status, and may live far from healthcare institutions (Abebe et al., 2019). Rural residency could also play a role in the low TT vaccination coverage (Tsehay et al., 2019). According to the purely SaTScan spatial analysis, 182 were the most probable (main cluster) and 48 were secondary SaTScan clusters of locations with poor TT vaccination coverage. Tigray, Amhara, and Afar were identified as the most likely primary SaTScan clusters with low TT vaccination coverage (LLR = 200.76, p = .001). The most likely secondary SaTScan cluster was determined to be the other Gambella (LL = 31.11), eastern Oromia (LL = 17.67), Dire Dawa and Harari (LL = 11.09), and southern Oromia (LL = 9.38). This local clustering of low TT vaccination coverage means that women living in the above-mentioned geographic places had a lower chance of receiving TT immunization than women living outside the SaTScan clusters. Apart from sociocultural differences in the community, this could be attributable to inequalities in health service accessibility and consumption. According to studies, women in Afar and other remote locations are delivered at home due to a lack of trust in local health professionals (Ahmed et al., 2019). In remote regions, the lack of strengthening healthcare systems is contributed to defaulting from immunization because most of the vaccines and supplies are stock-outs, poorly arranged immunization services or appointments, lack of tracking systems to obtain defaulters, and poor maternal counseling (Zewdie et al., 2016).
Different studies also revealed that there is a considerable significant difference in certain outcome variable child and maternal vaccination predictors across geographical areas (Brunsdon et al., 2001; Cahill & Mulligan, 2007; Fotheringham et al., 2001). This might be due to the reason that there is considerable infrastructure difference among regions which in turn inhibits the educational status of the society.
Conclusion
In Ethiopia, in the period under review, there was a non-random pattern of TT vaccine coverage among women (clustered pattern). All the EDHS eras of the study were clustered. Western Tigray, eastern SNNP, southern Amhara, and northern Oromia were identified as statistically significant hot spot regions (risky areas of the country), and based on spatial Bayesian kriging interpolation, the southwestern and eastern parts of Oromia, western Tigray, Harari, and Dire Dawa regions were predicted to be riskier than other regions of the country. To address the problem of under-vaccination clusters observed in this study, we recommend that community health education be organized on the benefits of TT immunization and that the health system be strengthened to improve access and quality of institutional delivery care. As a result, health workers, programmers, government, and non-governmental organizations in Ethiopia should adopt spatially based strategic interventions based on identified clusters (high-risk locations) to increase women’s tetanus immunization.
Limitation
Data collected at one point in time is included in the study. As a result, there are additional restrictions, such as missing BCG vaccination status and GPS locations, mistakes in immunization cards and/or parental recollection, and data displacement for privacy reasons. Furthermore, the SaTScan analysis only recognizes circular clusters and does not detect irregularly shaped clusters. Finally, some of the enumeration areas had zero latitude and longitude values.
Strength
EDHS data was collected on a national scale with representative weighted data and may be generalized at the national level with country spatial clustering, which is necessary to see clustering variance in TT vaccination of women.
Footnotes
Acknowledgements
We would like to thank the Ethiopian Demographic and Health Survey Team, as well as the main Demographic and Health Survey Program, for providing free Internet data access.
Author Contributions
ATB and SSM were involved in the design and conception of the study and in the analysis and interpretation of the findings. ATB, SSM, SBA, and BBE read and approved the manuscript, starting from the first step up to publication.
Declaration of Conflicting Interests
The author(s) declared no potential conflicts of interest concerning the research, authorship, and/or publication of this article.
Funding
The author(s) received no financial support for the research, authorship, and/or publication of this article.
Ethical Approval and Consent to Participate
The study does not involve the collection of information from subjects. Consent to respondents is not applicable since the data set used in this study (EDHS data 2016) is freely available and possible to download from the link: ![]() . Data were only downloaded for this study. Without EDHS’ permission, the data set was not shared with other researchers. The data is available without the respondent’s identifications. Approval was sought from EDHS International and permission was granted for this use. There was no requirement to identify any household or individual respondents interviewed in the EDHS because the data was treated confidentially.
. Data were only downloaded for this study. Without EDHS’ permission, the data set was not shared with other researchers. The data is available without the respondent’s identifications. Approval was sought from EDHS International and permission was granted for this use. There was no requirement to identify any household or individual respondents interviewed in the EDHS because the data was treated confidentially.
Consent for Publication
Not applicable.
Patient Consent for Publication
Not required.