
Abstract
This study aimed to develop and test a University Students’ Perceptions of Physical Education (PE) Scale. The study was conducted in three phases in a southwestern city in China from December 2021 to October 2022. In Phase 1, an item pool was constructed based on a literature review and semi-structured interviews. In Phase 2, expert evaluations and university student interviews were conducted to evaluate the content validity of the questionnaire. In Phase 3, a cross-sectional study was administered to university students. Composite reliability (CR) and average variance extracted (AVE) for internal consistency and test-retest reliability analyses were calculated for the stability reliability analysis. The validity evaluations included content, construct, and discriminant validity and an invariance test. The developed scale comprises 20 items covering six domains: habituated behavior in physical activity, self-efficacy in PE, attitude and experience in PE, skills and knowledge, classroom climate, and facilities, equipment and norms. Each domain’s CR and AVE values exceeded 0.7 and 0.5, respectively. The statistical indices of the final model were chi-square (χ2) = 458.227, degrees of freedom (df) = 155, Comparative Fit Index = 0.957, Tucker–Lewis Index = 0.947, standardized root mean square residual = 0.061, and root mean square error of approximation = 0.066, supporting the reliability and viability of the scale. A scientific process was adopted in constructing the University Students’ Perceptions of PE Scale. High validity and reliability scores indicate the suitability of using this scale for further research.
Plain Language Summary
This study developed a questionnaire to understand how university students in China viewed PE. The process comprised three steps. First, we consructed questionnaire items based on existing literature and interviews with university students. Second, experts and university students evaluated the questionnaire items to to ensure they were clear and appropriate. Third, the questionnaire was given out to university students to conduct a cross-sectional study. The final version of the questionnaire consisted of 20 items in six domains (Habitual behavior in PA [behavior factor], self-efficacy in PE [personal factor], attitude and experience in PE [personal factor], skills and knowledge [environment factor], classroom climate [environment factor], and facilities, equipment and norms [environment factor]). We tested the reliability and validity of the questionnaire on 1,382 university students. We found that the questionnaire was reliable and valid.
Keywords
Introduction
Physical education (PE), a broad discipline primarily aimed at the K-12 school-age cohort, significantly promotes physical, psychological, and social wellbeing (UNESCO, 2015). According to UNESCO (2015), the holistic approach to PE enhances physical literacy and health and bolsters cognitive capabilities and psychological resilience. Moreover, the benefits of PE extend beyond the individual, contributing significantly to societal health, economic productivity, and social cohesion (Baena-Morales & González-Víllora, 2023).
The Central Government of China has recognized PE’s benefits and included it as a compulsory subject in the national curriculum (Ministry of Education, China, 2002). PE is compulsory from the first year of primary school to the second year of university (Ministry of Education, China, 2002, 2017, 2022). According to the Ministry of Education, China (2014a), university-level PE programs emphasize a holistic understanding of health and fundamental motor skills, aiming to foster lifelong engagement in physical activity (PA) and cultivate healthy habits. To ensure adherence to this goal, university students complete 144 hr of PE each semester in their first and second years, which is typically achieved by scheduling at least two PE classes weekly, each lasting no less than 45 min (Ministry of Education, China, 2014a). However, implementation of PE at the university level remains challenging owing to issues such as inadequate facilities and equipment, poorly qualified PE teachers, and the marginal status of university PE programs (Pan et al., 2022; Peng, 2013). Although university-level PE programs adhere to general guidelines (Ministry of Education, China, 2002), there are no specific national standards for university-level PE programs, which may lead to inconsistencies in terms of quality (Zhang & Qian, 2019). Furthermore, while the Chinese government has implemented various policy-driven reforms to improve PE quality (General Office of the Central Committee of the Communist Party of China & General Office of the State Council, China, 2020; Ministry of Education, China, 2014a, 2014b, 2016), these changes may not necessarily cultivate genuine interest or promote long-term participation in PA among university students (Liu et al., 2023). Xu et al. (2017) reported that approximately 40% of university students in China do not reach the World Health Organization’s recommendation of 150 min of moderate PA per week.
Background
Perception—the process by which organisms interpret and organize sensations to produce meaningful experiences of the world (Goldstein & Cacciamani, 2021)—is the foundation for understanding and interpreting our environment and is essential to our existence, learning, work, and interpersonal interactions (Baron-Cohen et al., 2001; Goldstein & Cacciamani, 2021; Wolfe et al., 2006). Students’ perceptions of their learning environment, teaching methods, and curriculum can significantly influence their academic performance, engagement, and overall satisfaction with their educational journey(Amerstorfer & Freiin von Münster-Kistner, 2021; Cho et al., 2021; Lu, 2021). Positive perceptions may enhance motivation and lead to improved learning outcomes; in contrast, negative perceptions may hinder learning and reduce engagement (Amerstorfer & Freiin von Münster-Kistner, 2021; Jones & Carter, 2019). Therefore, it is vital to consider students’ perceptions of reality when investigating their understanding and evaluation of PE (Jansson et al., 2022; Taylor, 2012). Students’ perceptions of PE are determined primarily by their past experiences in PE classes (Åsebø et al., 2022; Subramaniam & Silverman, 2007). Based on a previous study, Ghofrani and Golsanamlou (2012) showed that university students who had positive perceptions of PE were likely to participate in PA. Thus, evaluating university students’ perceptions of PE allows for reflective analysis of previous PE programs’ strengths and weaknesses, helps design interventions that encourage lifelong PA, can inform future advances in PE, and serves as a valuable resource for policymakers, universities, and PE teachers. Moreover, Gouveia et al. (2019) found that students’ attitudes toward PE may be positively associated with the enjoyment of PA and physical fitness.
Previous studies have focused on K-12 students’ perceptions and experiences of PE in Western cultural contexts (Jansson et al., 2022; Leisterer & Jekauc, 2019; Murfay et al., 2022; Phillips et al., 2021). However, university students differ from K-12 students in that they have developed more physically, possess greater independent reasoning skills, and are older, thus more likely to have acquired a deeper understanding of PE (Onetti-Onetti et al., 2019). Moreover, the Chinese context differs from the West, which may influence students’ perceptions and experiences of PE. Additionally, existing studies have used instruments that are not specific to measuring students’ perceptions of PE, are not comprehensive, and do not accurately reflect the characteristics of students’ perceptions of PE (Crisol Moya & Caurcel Cara, 2021; Nicaise et al., 2007). Crisol Moya and Caurcel Cara (2021) and Ghofrani and Golsanamlou (2012) have developed instruments to measure university students’ perception of PE, with 42 and 92 items, respectively. However, questionnaires with a large number of item may compromise the data quality and reliability of the questionnaire (Sharma, 2022). Furthermore, the existing literature has not identified instruments to assess university students’ perceptions of PE. Therefore, this study aimed to develop an instrument to measure perceptions of PE among university students and to assess its validity and reliability.
Methods
A mixed approach was applied to develop the University Students’ Perceptions of PE Scale in three phases: (1) item pool development, (2) content validation, and (3) validity and reliability evaluation (see Figure 1).

Process of developing the scale.
Phase 1: Item Pool Development
Theories in PE
In PE, various theories have been utilized to understand and enhance student motivation and behavior. For example, the self-determination theory by Deci and Ryan (2012), Ryan and Deci (2000) posits that individuals possess innate psychological needs—autonomy, competence, and relatedness. When these needs are satisfied in PE, students are more likely to be intrinsically motivated, leading to increased participation and long-term adherence (How & Wang, 2016; Leisterer & Paschold, 2022). In contrast, the achievement goal theory emphasizes the orientation of students toward mastery or performance (Harackiewicz et al., 2002). Achievement goal theory is also a concept central to understanding and promoting students’ motivation in PE (Chen & Ennis, 2004). The integration of achievement goal theory into PE practice is a promising avenue for promoting students’ motivation in PE and for fulfilling the overall political and curricular aims (Jaitner et al., 2019). Another notable framework is the transtheoretical model, which posits that behavioral change progresses through six stages of change from pre-contemplation to termination (Prochaska & Velicer, 1997). The transtheoretical model aids educators in recognizing where students are in their readiness to engage in PA and subsequently implementing stage-specific strategies (Liu et al., 2018; Woods et al., 2002). These theories focused on specific aspects of motivation and behavioral analysis.
Bandura’s social cognitive theory (Bandura, 2001) encompass a holistic range of factors to understand perception of PE and was used to guide the development of the University Students’ Perception of PE Scale. The theory asserts that human action is shaped by the interplay among personal, environmental, and behavioral factors— a concept commonly referred to as triadic reciprocal determinism (Schunk & DiBenedetto, 2020) (see Figure 2). Based on previous research, an environment characterized by encouragement from significant others or the availability of secure and accessible facilities can bolster an individual’s perception and self-efficacy, which, in turn, has the potential to influence their behavior choices (Bandura, 2018; Bandura et al., 1997; Marmo, 2013). Sourced from the triadic reciprocal determinism of social cognitive theory, in PE, students draw from their experiences in PA (behavioral factor) and interpret the classroom climate, teaching contents, and sporting facilities and equipment (environmental factor). These interpretations subsequently affect their experiences, attitudes, and self-efficacy regarding PE (personal factor) (Murfay et al., 2022). Therefore, personal, environmental, and behavioral factors were considered when developing the University Students’ Perception of PE Scale.

The assumption of social cognitive theory (Schunk & DiBenedetto, 2020).
Literature Review
An extensive systematic literature review was conducted to understand the current state of relevant research and to develop a semi-structured interview outline. China National Knowledge Infrastructure (Chinese database), Wanfang (Chinese database), Web of Science, Scopus, Google Scholar, and ProQuest were used to search for relevant literature. The following keywords were included in the review: (perception OR experience OR attitude OR beliefs OR conceptions) AND (physical education OR PE) AND (university OR college OR higher education OR university education OR college education) AND scale development AND students.
Semi-Structured Interviews
To determine the information needed to evaluate university students’ perceptions of PE, a purposive sampling method was used to recruit university students from a university in Chongqing Municipality, China, to take part in semi-structured interviews. The inclusion criteria were as follows: (1) currently enrolled as an undergraduate student, (2) participating in PE programs, and (3) able to provide consent to participate in the research.
We conducted online semi-structured interviews with university students using the Tencent Meeting platform and divided them into six focus groups, each consisting of five students. The interview outline was developed based on the social cognitive theory as a guiding framework and addressed behavioral, personal, and environmental factors affecting students’ perceptions, experiences and attitudes toward PE. Example of questions are: (1) What is PE to you? (2) What factors do you think influence your experiences of and attitudes toward PE? How are these factors influenced? and (3) Have you learned anything useful in PE? Participants were encouraged to express their ideas during the focus group discussions, and consensus responses were identified. Feedback that reached a consensus within each focus group discussion was considered a valid answer to the interviewing questions. The focus group discussions were facilitated by a trained researcher, with each session lasting approximately 30 min. After obtaining participants’ consent and permission to record, the entire process was audio-recorded and notes were taken.
Phase 2: Content Validation
Expert Evaluation
Expert evaluations were conducted to evaluate the content of the University Students’ Perception of PE Scale. The inclusion criteria for experts were as follows: (1) a minimum of 10 years of experience, a master’s or Ph.D. degree and (2) well versed in the methodology employed to develop the scale. An email summarizing the study’s purpose, scope, and significance was sent to the experts, and an expert consultation form was created. The evaluation form included a demographic information form expert, the importance of the University Students’ Perception of PE Scale content, and a clarity rating form.
The expert evaluation was conducted in two rounds to ensure a thorough scale evaluation. In the first round, three experts were asked to assess the clarity of each item using a 5-point Likert scale ranging from 1 (not at all clear) to 5 (very clear). In the second round, based on the results of the previous round of consultation, the remaining three experts were requested to rate the relevance of each item on a 4-point Likert scale (1 = not relevant, 2 = somewhat relevant, 3 = quite relevant, and 4 = highly relevant).
University Student Interviews
To determine how participants understood each item’s meaning, five university students randomly selected from Phase 1 were invited to participate in Phase 2 of the study. A research team member conducted online interviews, and the interview time for each participant was approximately 25 min. Participants were asked to express their concerns or questions regarding the items while completing the scale. We also encouraged them to provide suggestions for improving the scale. Finally, the researchers modified the questionnaire based on the interview results.
Phase 3: Validity and Reliability Evaluation
A cross-sectional study was conducted to evaluate the scale further. The research team obtained permission from six universities to conduct the study and recruited participants using a convenience sample, which was implemented via an online questionnaire on the Questionnaire Star platform (a popular online questionnaire survey platform in China). Before beginning the survey, participants read the study purpose online. In addition, we assured participants that participation in the study was voluntary and that they were free to withdraw from the study at any time. After reading the informed consent form on the platform, participants indicated their willingness to participate in the study by selecting “agree,” and the scale items were displayed. First- and second-year students from six universities participated in data collection. The inclusion criteria were (1) currently enrolled undergraduate students, (2) participating in PE programs, and (3) able and willing to provide consent to participate in the research.
Quality Control
To ensure the validity of the University Students’ Perceptions of PE Scale, this research employed a theoretical framework, participant advice, expert evaluation, and data analysis. After obtaining informed consent, each interview was audio-recorded, and transcripts of the interviews were returned to the participants for verification. Participants were asked to peruse the transcripts of their interviews to verify their veracity. The six experts included a policy-maker, two professors, and three associate professors with expertise in education, PE, and psychology, thus ensuring that all relevant professional fields were adequately represented. Prior to the main survey, two researchers were trained on the study purpose and content and the significance of each scale item to ensure consistent application of the rating scales used in the study. All the collected and input data were double-checked to ensure quality.
Data Analysis
Using Dye et al.’s (2000) constant comparison method, one researcher coded the entire corpus while two other researchers double-checked the accuracy of the coding and discussed any differences until a consensus was reached. The themes that emerged from the interview responses were compared with the initial item pool results to ensure data triangulation. Peer splitting was performed during the coding and triangulation to confirm the validity of the findings.
The Statistical Package for the Social Sciences (SPSS, IBM) version 27 and SPSS Amos version 26 (IBM) were used for all data analyses. Statistical significance was set at a probability level of p < .05.
The content validity of the scale was calculated by the Content Validity Index (CVI) assessment. Polit et al. (2007) suggest that a CVI of 1.0 indicates good content validity for items when evaluated by a panel of five or fewer experts.
Exploratory factor analysis (EFA) and confirmatory factor analysis (CFA) were used to evaluate the reasonableness of the scale’s structure. EFA was conducted to identify potential common factors, thereby maximizing the convergent and discriminant validity of the items within each factor (Hurley et al., 1997). The suitability of the data for the principal component analysis was evaluated using the Kaiser-Meyer-Olkin (KMO) test and Bartlett’s test of sphericity (Tharwat, 2016). Factors were extracted using an eigenvalue greater than 1.0 and confirmed by examining the scree plot. According to the recommendations of Meyers et al. (2016), promax rotation was employed, considering the potential correlations between factors. Following the recommendation of Costello and Osborne (2005), all items with primary factor loadings less than 0.40 were removed, as were those with high cross-loadings (i.e., secondary loadings greater than 0.32). Subsequently, we conducted a CFA to examine the structure of the preliminary scale further. Multiple fit indices were used to evaluate the adequacy of model fitting to the data, including the chi-square statistic, comparative fit index (CFI), Tucker-Lewis index (TLI), standardized root mean square residual (SRMR), and root mean square error of approximation (RMSEA), which also incorporated a 90% confidence interval (CI). It is widely recognized that a model fit can be considered acceptable when the CFI and TLI values exceed 0.9, and the SRMR and RMSEA values are close to or below 0.08 (Hair, 2010).
Cronbach’s alpha has been criticized for representing a lower-bound estimate of internal consistency reliability, which may misrepresent scale reliability (Sijtsma, 2009). The reliability of the instrument was evaluated using composite reliability (CR) and average variance extracted (AVE) tests for internal consistency (Freeman et al., 2011). Fornell and Larcker (1981) recommend that the CR meet or exceed the 0.7 cut-off point. This study used the AVE value to evaluate the extent to which the indicator captured the variance in measurement error. According to Fornell and Larcker’s (1981) criteria, an AVE value greater than 0.5 is deemed acceptable. Furthermore, this study examined discriminant validity, gender and sample invariance, and test-retest reliability.
Results
Construction of the Scale
Semi-Structured Interviews
The semi-structured interview participants were 30 university students (13 females and 17 males) aged 18 to 21 years (M = 19.52; SD = 0.752). The extracted interview themes were as follows: (1) habituated behavior in PA (behavioral factor) describing how university students applied the knowledge and skills learned in PE to post-class PA; (2) self-efficacy in PE (personal factor) describing university students’ confidence in accomplishing specific physical tasks or achieving physical goals; (3) attitude and experience in PE (personal factor), primarily expressing university students’ feelings, observations, and reactions toward PE; (4) skills and knowledge (environmental factor) describing the teaching content of motor skills and related knowledge provided in university PE, (5) classroom climate (environmental factor) portraying the social and emotional environment of PE classes; and (6) facilities, equipment, and norms (environmental factor) describing the norms of university PE and the conditions of university sports facilities and equipment.
The literature review and semi-structured interviews resulted in the first version of the University Students’ Perception of PE Scale with six domains and 33 items: habituated behavior in PA (behavioral factor) (five items); self-efficacy in PE (personal factor) (five items); attitude and experience in PE (personal factor) (eight items); skills and knowledge (environmental factor) (five items); classroom climate (environmental factor) (four items); and facilities, equipment, and norms (environmental factor) (six items).
Expert Evaluation
Based on the first round of expert evaluation and the previous studies, the number and reverse-worded items affect the scale’s factor structure. Specifically, reverse-worded items can compromise a scale’s reliability, internal consistency, and validity, and they can also cause factor splits in analyses, leading to two distinct factors: one for the straightforward items and another for the reverse items, which may lack substantive meaning (Rodebaugh et al., 2004; Woods, 2006; Zhang et al., 2016). Therefore, three reverse-word items (Items 10, 18, and 23) were eliminated. The second round of expert evaluations evaluated the remaining 30 items. Three items (Item 1: “Based on the knowledge and skills I have acquired in PE, I can determine the appropriate intensity of PA after class”; Item 12: “I like PE because it’s fun,” and Item 15: “I feel excited when I learn new motor skills in PE class.”) exhibited a CVI of 0.33 and were subsequently removed (see Appendix 1). The expert evaluation resulted in the deletion of six items.
University Student Interviews
Five university students (three males and two females) were invited to participate in interviews to verify the validity of the items and the clarity of language of the items. Their ages ranged from 18 to 20 years, with a mean age of 19.2. Items were modified based on participants’ feedback regarding presentation, wording, option setting, and question annotation of the items.
Two items were revised after the university student interviews: (1) “PE classes are easy for me” was revised to “It is easy for me to master the motor skills and the content taught in PE” (Item 7) and (2) “There are equal opportunities for practice in PE” was amended to “In PE, I have the same opportunities to practice as other students” (Item 24).
After the development process was concluded, the second version of the University Students’ Perception of PE Scale consisted of 27 items in six domains: habituated behavior in PA (behavioral factor) (four items), self-efficacy in PE (personal factor) (four items), attitude and experience in PE (personal factor) (five items), skills and knowledge (environmental factor) (four items), classroom climate (environmental factor) (four items), and facilities, equipment and norms (environmental factor) (six items). Items were scored on a 7-point Likert scale ranging from 1 (strongly disagree) to 7 (strongly agree).
Evaluation of the Reliability and Validity of the Scale
Participant Demographics
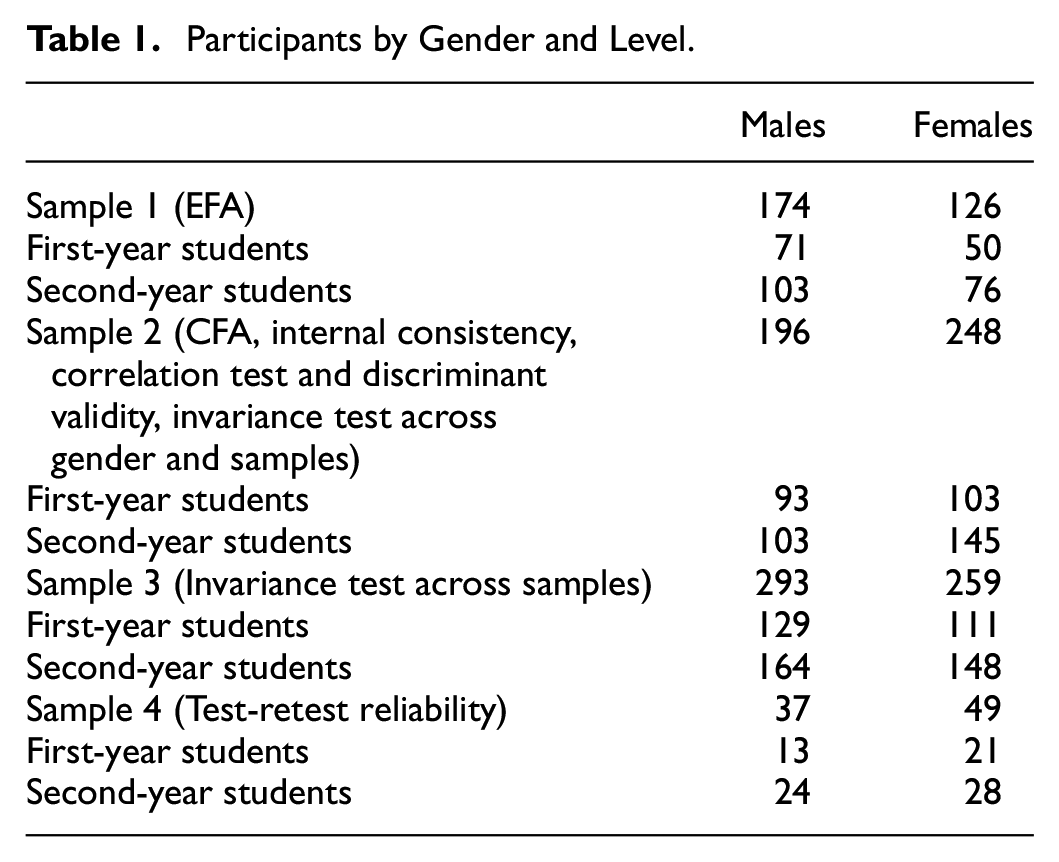
A total of 1,382 university student participants were recruited from a large metropolitan area in southwest China and divided into four sample groups. Sample 1 consisted of 300 participants (58% males, 42% females) aged 18 to 20 years. Sample 2 comprised 444 students (44% male, 56% female) aged 17 to 23 years. Sample 3 consisted of 552 students (53% male, 47% female) aged 17 to 23 years. Sample 4 comprised 86 students (43% male, 57% female) aged 17 to 23 years. Table 1 presents the number of students who participated in each survey.
Participants by Gender and Level.
Construct Validity
EFA. We conducted two rounds of the EFAs. After completing the initial EFA, Bartlett’s test of sphericity (χ2 = 5,806.352, p < .000) and the KMO value (0.913) suggested that correlations between indicators of the scale were significant enough to support principal component analysis (Kaiser, 1960). We identified six domains that accounted for 72.207% of the variance in the scale. To further refine our findings, we removed one item (Item 33) from the pattern matrix using the criteria mentioned above (factor loadings of less than 0.40). Another EFA was performed, resulting in Bartlett’s test of sphericity (χ2 = 5579.305, p < .000) and the KMO value (0.910), which yielded six domains accounting for 73.031% of the variance in the remaining 26 items (see Table 2).
Factor Loadings from EFA Analysis of the University Students’ Perception of PE Scale.

CFA
The initial RMSEA index results suggested room for improvement. Specifically, χ2 = 1161.224, df = 284, CFI = 0.917, TLI = 0.905, SRMR = 0.080, RMSEA = 0.084 (90% CI: 0.079–0.089). This study explored enhancing the model’s fit by examining modification indices and the standardized residual matrix. The findings indicated high cross-loading relationships between certain items across different domains. In particular, items 3, 7, 17, and 19 exhibited such relationships. After removing items 3, 7, 17, and 19, the fitness indicators improved: χ2 = 598.119, df = 194, CFI = 0.951, TLI = 0.941, SRMR = 0.065, RMSEA = 0.069 (90% CI: 0.062–0.075). However, subsequent tests revealed that Item 32 had multiple standardized residual indexes of ±2.5, indicating a strong correlation with several other items. Furthermore, according to Jöreskog (1999), standardized coefficients close to or greater than one suggest significant multicollinearity. In this study, the standardized loading for Item 26 was greater than 0.95, which led to the decision to remove the item. After deleting Items 32 and 26, the final model demonstrated a good fit with the data: χ2 = 458.227, df = 155, CFI = 0.957, TLI = 0.947, SRMR = 0.061, and RMSEA = 0.066 (90% CI: 0.059–0.074) (see Figure 3).

CFA model.
After the EFAs and CFAs, the final version of the University Students’ Perception of PE Scale consisted of 20 items in six domains: (1) habituated behavior in PA (behavioral factor) (three items), (2) self-efficacy in PE (personal factor) (three items), (3) attitude and experience in PE (personal factor) (four items), (4) skills and knowledge (environmental factor) (three items), (5) classroom climate (environmental factor) (three items), (6) and facilities, equipment, and norms (environmental factor) (four items) (see Figure 3).
Internal Consistency Reliability
The six domains of the scale demonstrated strong internal consistency reliability, with standard loadings ranging from 0.650 to 0.939, an average loading of 0.830, CR values from 0.838 to 0.911, and AVE values from 0.635 to 0.728. Table 3 provides a comprehensive overview of the CFA results, including standardized loadings, t-values, p-values, factor loadings, squared multiple correlations, and CR and AVE values for the University Students’ Perceptions of the PE Scale.
CFA Item Standard Errors (SE), t-Value, p-Value, Factor Loadings (Std.), Squared Multiple Correlations (SMC), Composite Reliability (CR), and Average Extracted Variance (AVE) Values for the University Students’ Perception of PE Scale.

p < .001.
Correlation Test and Discriminant Validity
Table 4 shows the correlations between the domains and the discriminant validity of the University Students’ Perceptions of PE Scale. The six domains exhibited moderate-to-high positive correlations.
Correlation Coefficients and Discriminant Validity of the University Students’ Perception of PE Scale.

p < .001.
Note.? The diagonal values (in bold) are the square root of AVE.
Carter (2016) employed the AVE technique as a stringent method for assessing discriminant validity. The AVE of a construct can be calculated using square roots to assess the discriminant validity. If the square root of a construct’s AVE is greater than the correlation coefficient between the construct and the other constructs in the model, the construct is sufficiently distinct from the other constructs, indicating good discriminant validity. Table 4 indicates that the square root of AVE for most domains, as displayed by the diagonal values, surpasses the respective Pearson correlation coefficients in their corresponding rows and columns. However, it is essential to note that attitude and experience in PE exhibited marginally lower values (0.001 and 0.032, respectively) compared to the values for self-efficacy in PE and habitual behavior in PA. Moreover, self-efficacy in PE demonstrated a slightly lower value of 0.01 compared to habitual behavior in PA.
Nonetheless, to further establish the discriminant validity of this study, this research team followed Rönkkö and Cho’s (2022) recommendation to adopt an alternative approach that emphasizes model fit. This research team used a baseline model (M0), which is a hypothetical model consisting of six domains. Based on the baseline model, this research team introduced constraints to the two domains with ambiguous discriminant validity to develop three constrained models (M1, M2, and M3). To do this, this research team assumes the correlation coefficient between the two domains to be one, indicating full correlation. Then, this research team compared the goodness-of-fit indices of the constrained models with those of the baseline model to assess the discriminant validity of the constructs. The findings in Table 5 reveal that the hypothesized six-factor model was the most appropriate one for fitting the data, surpassing all other models in terms of performance.
Fit Indices for the Various Measurement Models of the University Students’ Perception of PE Scale.

Note. M0 = baseline model; M1 = constrained model: Assume the correlation coefficient between F2 and F3 set to be 1; M2 = constrained model: Assume the correlation coefficient between F1 and F3 set to be 1; M3 = constrained model: Assume the correlation coefficient between F1 and F2 to set to be 1.
Invariance Across Gender
To test the invariance of university students’ perception of the PE scale measurement model across genders, multi-group CFA was utilized. Four models were developed to examine the invariance of measurements and structural parameters. The first model (M0) was the baseline; that is, an unconstrained model. The subsequent models (M1, M2, and M3) were increasingly constrained. In M1, factor loadings were constrained to be equal. In M2, the factor loadings and unique variances of each item were constrained to be equal. Finally, in M3, each item’s factor loadings, unique variances, and factor variances were considered equal. The p-value of the chi-square test can be influenced by both the size of the sample and the number of groups (Rutkowski & Svetina, 2014). Therefore, CFI and RMSEA were considered reliable indicators. Invariance in the model was determined by comparing the differences in the CFI and RMSEA values from one model to the next. If changes in CFI and RMSEA equal less than 0.01 and 0.015, respectively, from one model to the next, the model exhibits invariance (Chen, 2007; Zhang & Cheung, 2019).
Table 6 demonstrates that the unconstrained model (M0) exhibited an acceptable fit to the data. When the factor loadings were constrained to be equal across genders in M1, an acceptable fit to the data was achieved. The difference in the CFI values between M1 and M0 was less than 0.01 (ΔCFI = 0), and the difference in the RMSEA values was less than 0.015 (ΔRMSEA = 0.001). These results suggest that the factor loadings of the University Students’ Perceptions of the PE Scale measurement model are invariant across gender. M2 provided an acceptable fit for the data when both the factor loadings and the unique variance of each item were constrained. Compared with M1, the change in the CFI values for M2 was minimal, with a difference of only 0.008. Similarly, the change in the RMSEA values was negligible, with a difference of only 0.001. These findings indicate that, in addition to the factor loadings, the unique variance of each item is invariant across genders. Finally, M3, which required the variances of the domains to be equal between the two groups in addition to the constraints above, demonstrated an acceptable fit for the data. Compared to M2, the difference in CFI values for M3 was less than 0.01 (ΔCFI = 0.002), and the change in RMSEA values (ΔRMSEA = 0.001) was less than 0.015. Thus, these results suggest that factor loadings, unique variances, and factor variances remain invariant across gender.
Fit Indices for the Invariance Testing of Measurement Model across Gender and Sample.

Invariance Across Samples
A sequential model-testing approach was used via multi-group CFA to determine whether the University Students’ Perceptions of the PE Scale measurement model remained invariant across samples. The sample consisted of university students who participated in the second and third rounds of the survey (see Table 1). A baseline model (M0: unconstrained model) was established first, followed by three increasingly constrained models to test the equality of measurement (M1: factor loadings constrained to be equal) and structural parameters (M2: factor loadings and unique variances of each item constrained to be equal; M3: factor loadings, unique variances of each item, and factor variances all constrained to be equal) across the samples. Table 6 presents the goodness-of-fit indices for the invariance analysis of the University Students’ Perceptions of the PE Scale measurement model across samples. The unconstrained model (M0) also showed an acceptable fit to the data. When the factor loadings were constrained to be equal across samples, M1 yielded a satisfactory fit to the data. When comparing M1 with M0, the changes in CFI and RMSEA values were less than 0.01 and 0.015, respectively, implying that the factor loadings of the University Students’ Perceptions of PE Scale measurement model were invariant across samples.
Additionally, when each item’s factor loadings and unique variances were constrained to be equal simultaneously, M2 displayed a satisfactory fit to the data. When comparing M2 with M1, the changes in the CFI (ΔCFI = 0.003) and RMSEA (ΔRMSEA = 0.000) values were also less than 0.01 and 0.015, respectively, which suggests that each item’s factor loading and unique variance were invariant across the samples. Finally, when comparing M3 with M2, the changes in the CFI (ΔCFI = 0.001) and RMSEA (ΔRMSEA = 0.001) values were also less than 0.01 and 0.015, respectively. These results indicate that factor loadings, unique variances, and factor variances remained invariant across the samples.
Test-Retest Reliability
This study used an independent sample of 86 university students comprising 37 males and 49 females. Participants’ ages ranged from 18 to 24 years, with a mean age of 19.24 (SD = 1.08). These students completed a 20-item University Students’ Perception of PE Scale on two separate occasions spaced 3 weeks apart. The test-retest reliability for each subscale was assessed using the intraclass correlation coefficient (ICC) and employing a two-way random-effects model. A 95% CI was calculated to provide a more precise reliability estimate. ICCs range from 0 to 1, with values above 0.70 generally considered good reliability (Cicchetti, 1994). The ICCs for the six subscales were as follows: habitual behavior in PA (behavioral factor): M1 = 5.82 (SD1 = 1.06), M2 = 5.65 (SD2 = 1.09), r = .87 [95% CI: 0.81, 0.91]. Self-efficacy in PE (personal factor): M1 = 5.03 (SD1 = 1.39), M2 = 4.96 (SD2 = 1.32), r = .74 [95% CI: 0.63, 0.82]; attitude and experience in PE (personal factor): M1 = 5.48 (SD1 = 1.27), M2 = 5.46 (SD2 = 1.23), r = .86 [95% CI: 0.79, 0.90]; skills and knowledge (environmental factor): M1 = 5.82 (SD1 = 1.11), M2 = 5.81 (SD2 = 1.05), r = .84 [95% CI: 0.77, 0.89]; classroom climate (environmental factor): M1 = 6.20 (SD1 = 0.87); M2 = 6.13 (SD2 = 0.90); r = .82 [95% CI: 0.74, 0.88]; and facilities, equipment and norms (environmental factor): M1 = 6.31 (SD1 = 0.77), M2 = 6.23 (SD2 = 0.83), r = .72 [95% CI: 0.61, 0.81].
Discussion
The University Students’ Perception of PE Scale was developed to measure university students’ perceptions of PE. University students were involved in the three study phases, and expert evaluations were performed. The results of the preliminary psychometric assessment indicated acceptable reliability and validity.
The social cognitive theory framework by Bandura (1986) guided the construction of the initial dimensions of the scale. The development and validation processes followed three phases: item pool development, content validation, and validity and reliability evaluation. Our initial item pool was derived from a literature review and semi-structured interviews to ensure the applicability and comprehensiveness of the items. In the content validity phase, two rounds of expert evaluations were conducted to identify the items for the University Students’ Perceptions of PE Scale. Interviews with students were also conducted to improve the clarity and readability of the scale, and items with unclear headings and inappropriate keywords were revised.
Four different samples were used to test the scale’s validity and reliability. The EFAs conducted with a sample of 300 participants helped identify the scale’s factor structure. To confirm construct validity, CFAs were used with two groups of 444 and 552 participants. Finally, the test-retest reliability was assessed with 86 participants to confirm the test-retest stability of the scale. This process aligns with the scale’s development (Boateng et al., 2018).
Measurement Characteristics
Regarding the EFA, the scale generated six domains, with each item presenting factor loadings exceeding 0.4, thereby satisfying the measurement criteria (Costello & Osborne, 2005). CFAs were used to assess the structural fit of the model. After inspection and adjustments based on the modification indices, satisfactory goodness-of-fit indices are found in the final CFA results. The reliability of the scale’s internal consistency is adequate. Correlational analyses of the six domains revealed moderate-to-high positive correlations with good discriminant validity. Furthermore, multiple-group CFA confirmed that the scale’s factor structure remained constant across genders and samples. In addition, the test-retest reliability of the scale, as evidenced by the ICCs for each factor, confirmed its stability over 3 weeks. Overall, the University Students’ Perceptions of PE Scale demonstrated commendable validity and reliability.
Significance of the Scale
The newly introduced University Students’ Perception of PE Scale was explicitly designed to evaluate university students’ perceptions of PE. This targeting method offers several advantages. First, this study fills a gap in the literature in which there have been no previous measurements of university students’ perceptions of PE. Second, grounded in social cognitive theory, which suggests that learning occurs through a dynamic and reciprocal interaction of the person, environment, and behavior (Bandura, 1986, 2001; Schunk & DiBenedetto, 2020), this scale provides a valuable instrument for researchers to gain a more specific and comprehensive understanding of the factors that influence student perceptions of PE. Third, most research on PE have focused on time allocation, policies, the environment, and teachers’ influences (Burson et al., 2021; Dudley et al., 2011; Hutzler et al., 2019). However, this scale offers a unique perspective on student perceptions. Understanding students’ thoughts and feelings about PE enhances our comprehension of teaching and learning processes and aligns with constructivist educational theories (Graham, 1995; Murfay et al., 2022; Steffe & Gale, 1995; Thorjussen, 2021). Lastly, the validity and reliability of the University Students’ Perception of PE Scale enable direct comparison of results across different studies, leading to more robust and accurate research outcomes.
The findings of the current study have practical implications for PE. First, the scale in question demonstrates both reliability and validity in its capacity to evaluate university students’ perceptions of PE, serving as an instrumental tool for discerning the impact and effectiveness of PE programs. By examining these perceptions, a nuanced understanding emerges, highlighting the prominent strengths and potential areas for refinement within the PE program. Thus, this scale becomes indispensable for educators and administrators, furnishing them with empirical insights that can directly inform and reshape pedagogical strategies, thereby optimizing the efficacy of PE and PA programs in higher education settings. Second, its sustained utilization offers institutions a longitudinal perspective, enabling monitoring shifts in student perceptions across time. Such a dynamic approach ensures that PE programs evolve and align with the changing paradigms of educational demands, thus maintaining their relevance and efficacy. Institutions can foster greater engagement and commitment toward PE by tailoring these programs to resonate with student preferences and needs. This emphasis on evolving curricula in response to student feedback is supported by Carless and Boud (2018), who assert that adaptive educational frameworks tend to produce more favorable learning outcomes. Moreover, this study provides a broad framework and pragmatic survey validation protocol for educators in other disciplines. Researchers in other disciplines could develop similar scales.
Limitations
Although we endeavored to ensure the development process of the University Students’ Perceptions of PE Scale was of high quality, there are a few limitations to report. First, the participant selection for this study presents a potential limitation as it consisted exclusively of first- and second-year university students in China. Second, because the scale was originally developed in Chinese, its applicability and validity in different cultural contexts cannot be ensured. Third, the data collected through research questions, answers, and online questionnaires may have potential response biases. Although this study provides valuable insights through the University Students’ Perception of PE Scale, the cross-sectional design limits the ability to infer causality or track changes in perceptions over time (Kim, 2021). Lastly, only variables based on domains developed in social cognitive theory (individual, environmental, behavioral factors) were examined.
Future Directions
Future directions for research include further testing of the scale to (1) consider expanding the sample size across various regions and age demographics; (2) further study university students of different genders, ages, and cultural backgrounds to analyze their characteristics; (3) validate the instrument in other languages to ensure its applicability and effectiveness across diverse cultural contexts; (4) to further investigate the reliability and validity of the study, it is recommended that future studies employ longitudinal or experimental research designs; and (5) future study may encourage the examination of the relationships between the University Students’ Perception of PE Scale, and other variables such as wellbeing and objective PA level in PE class
Conclusion
This research empirically validates the University Students’ Perception of PE Scale, a multidimensional tool developed from social cognitive theory designed to assess university students’ PE perceptions as a reliable and valid instrument for the comprehensive evaluation of university students’ PE perceptions. This self-reported scale has the potential to meet the requirements of researchers, universities, and other organizations that provide PE owing to its clarity, ease of administration, and scoring. However, it is imperative to conduct further refinement and rigorous testing in subsequent studies to confirm the broad applicability of the scale.
Footnotes
Appendix
The Initial Chinese University Students’ Perception of PE Scale and the Corresponding English Translation.

|
|
||
|---|---|---|
|
|
CVI | |
| 1. |
Based on the knowledge and skills I have acquired in PE, I can determine the appropriate intensity of physical activity after class. | 0.33 |
| 2. |
Based on the knowledge and skills I have gained in PE, I can be physically active in my community. | 1 |
| 3. |
On campus, I can frequently organise sports competitions or physical activities on my own initiative with other students, using the knowledge and skills I have gained in PE. | 1 |
| 4. |
Based on the knowledge and skills I acquired in PE, I can perform moderate exercise at home. | 1 |
| 5. |
I often use the knowledge and skills I learned in PE to engage in after-class physical activities. | 1 |
|
|
||
|
|
CVI | |
| 6. |
At least one sport is one in which I am more proficient than the majority of my classmates. | 1 |
| 7. |
It is easy for me to master the motor skills and the content taught in PE. | 1 |
| 8. |
I am the best performer in PE. | 1 |
| 9. |
In PE, I had the opportunity to demonstrate my athletic abilities and receive praise from my peers. | 1 |
| 10. |
In PE, no matter how hard I try, I am not good enough to enjoy the fun and happiness brought by sports and physical activity. (Reverse item) |
|
|
|
CVI | |
| 11. |
I’m excited in PE. | 1 |
| 12. |
I like PE because it’s fun | 0.33 |
| 13. |
I am able to gain |
1 |
| 14. |
I am always focused during PE. | 1 |
| 15. |
I feel excited when I learn new motor skills in PE class. | 0.33 |
| 16. |
I am interested in PE. | 1 |
| 17. |
I look forward to every PE class. | 1 |
| 18. |
I feel anxious when I think of PE. (Reverse item) |
|
|
|
||
|
|
CVI | |
| 19. |
PE always provide a rich and varied content of physical activities. | 1 |
| 20. |
At least two sports events are offered for us to learn in our PE each semester. | 1 |
| 21. |
PE provides a wealth of health knowledge. | 1 |
| 22. |
PE teaches a wide variety of motor skills. | 1 |
| 23. |
PE classes teach repetitive and simple motor skills and health knowledge (Reverse item) |
|
| CVI | ||
| 24. |
In PE, I have the same opportunities to practice as other students. | 1 |
| 25. |
I always get support and help in PE. | 1 |
| 26. |
I can feel the climate of equality and inclusion in my PE. | 1 |
| 27. |
In PE, the teacher treats each student fairly. | 1 |
|
|
CVI | |
| 28. |
Our university will strictly enforce the National Physical Fitness Test. | 1 |
| 29. |
At our university, there are two carefully designed physical education classes per week, each lasting 45 |
1 |
| 30. |
No matter what the weather, PE is always a full 90 |
1 |
| 31. |
Our university’s sports facilities and equipment are able to guarantee that our PE and physical activities are performed safely and effectively. | 1 |
| 32. |
Our university organises several sports competitions each semester to meet our needs. | 1 |
| 33. |
Our university’s environment and the space for sports activities were designed to attract me to PE classes. | 1 |
Acknowledgements
We express our sincere gratitude to the young participants who contributed to this study and the dedicated university staff who facilitated and supported the data collection process.
Declaration of Conflicting Interests
The author(s) declared no potential conflicts of interest with respect to the research, authorship, and/or publication of this article.
Funding
The author(s) disclosed receipt of the following financial support for the research, authorship, and/or publication of this article: The authors would like to acknowledge the financial support received for this paper’s research, writing, and publication. This work was made possible through grants from the Social Science Fund and the Natural Science Fund of the Chongqing Municipal Education Commission in China, under the reference numbers 22SKGH102 and KJQN202200502, respectively.
Ethics Statement
Unlike many Western countries, in China, specific research perceived as presenting negligible risk does not necessitate mandatory human ethics review, thereby lacking a formal ethical reference number for this study. Despite this, the Institutional Review Board of the first author’s affiliated university approved the study prior to the commencement of data collection.
Data Availability Statement
Data sharing not applicable to this article as no datasets were generated or analyzed during the current study.