
Abstract
This research aimed at developing a reliable scale to determine in-service language teachers’ perceptions about teaching pronunciation and contributing to the English Language Teaching (ELT) field. The participants of the study consisted of 132 English language instructors working in 42 secondary and high schools in the 2021 to 2022 academic year in North Cyprus. The conducted Exploratory Factor Analyses revealed that the scale consisted of five factors and 24 items. Besides that, the Confirmatory Factor Analysis results confirmed the 5-factor structure. Furthermore, it was proven that the whole scale and its sub-dimensions are highly reliable and suitable for the implementation in determining in-service language teachers’ perceptions of pronunciation teaching (χ2/df = 1.314). It is believed that the newly developed scale would help researchers more reliably investigate perceptions of teaching pronunciation in various contexts.
Plain Language Summary
This research aimed at developing a valid and reliable scale to determine in-service language teachers' perceptions about teaching pronunciation and contributing to the English Language Teaching (ELT) field. The participants of the study consisted of 132 English language instructors working in 42 secondary and high schools in North Cyprus in the 2021-2022 academic year. The conducted Exploratory Factor Analyses revealed that the scale consisted of 5 factors and 24 items. Besides that, the Confirmatory Factor Analysis results confirmed the 5-factor structure. Furthermore, it was proven that the whole scale and its sub-dimensions are highly reliable and suitable for the implementation in determining in-service language teachers' perceptions of pronunciation teaching (χ2/df=1.314). It is believed that the newly developed scale would help researchers more reliably investigate perceptions of teaching pronunciation in various contexts.
Keywords
Introduction
Teaching pronunciation is regarded as a challenging side of English as a second language (ESL) or English as a foreign language (EFL) teaching in classes. It is of great importance for any language teaching program that claims to provide learners with high-quality language instruction. At this point, the difficulty of pronunciation is mainly due to insufficient exposure to the language contexts, little interactions with speakers of English, and the differences between the phonetic/phonological differences in terms of pronunciation between the English language and other different languages. The majority of language teachers today might not prefer teaching pronunciation features in their classes due to their weaknesses, pronunciation anxiety, past learning experiences, lack of knowledge of how to teach, or their weak language proficiency levels (Ahmadi, 2011). However, it was reported in the literature that language learners constantly find pronunciation a very demanding part of language learning as they were not exposed to hearing and using the correct sounds in the early years of learning (Al-Rubaat & Alshammari, 2020). Further, respected studies regarding pronunciation teaching and learning revealed that most pronunciation problems were not only caused by physical articulation failures, but also by cognitive reasons of the second language (L2) (Doughty, 2019; Segalowitz, 2016; Zheng et al., 2022).
In their research, Derwing and Munro (2015) reported that most language teachers were hesitant regarding systematically teaching pronunciation. Further, they pointed out that language teachers needed more training sessions to improve themselves in terms of professional development, and the curriculums in various education programs did not emphasize pronunciation and ignored its teaching (Derwing & Munro, 2015). Furthermore, some respected studies revealed that language teachers received only little or no specific training to teach English sounds in their classes and therefore, they did not have official preparations and did not gain pronunciation skills to improve themselves to teach pronunciation features in their classes (Bai & Yuan, 2019; Couper, 2019; Pardede, 2018).
The problem behind the inability to produce the correct sounds was not only that learners cannot produce sounds physically, but also that they cannot distinguish certain sounds in the L2 sound system due to the lack of not being demonstrated in language classes by their English teachers to be able to arrange and produce sounds as needed (Berry, 2021). Especially in adult ESL programs, language teachers find it difficult to meet their pronunciation learning needs since they lack the teaching skills, self-confidence, and knowledge of teaching certain aspects of pronunciation teaching (Alghazo, 2015). On the other hand, the studies conducted in the field proved that approaches, curricula, and techniques regarding pronunciation teaching needed to be improved to reach global standards in the world (Bai & Yuan, 2019; Derwing & Munro, 2015; Pardede, 2018; Solikhah & Budiharso, 2020). Regarding the approaches and methods used in language classes, it is obvious that teachers’ way of teaching affects the teaching processes of future teacher candidates, who are non-native speakers of the target language. Further, the sound system of L2 as a target language is found challenging to be gathered and learned to be taught by preservice teachers. For instance, a student who studies English as a foreign language through the Grammar-Translation method (GTM) cannot be expected to pronounce the English sounds since they are not well emphasized during teaching in language classes. Therefore, as one of the pronunciation correction models and remedial pronunciation instruction, the Audio Articulation Method (AAM) was suggested to cure the existing pronunciation errors of EFL learners in educational settings (Demirezen, 2010). A great solution to incorrect pronunciation would be the identification of problematic sounds at the beginning of each academic term, then providing phonological differences to each student from different cultures, and demonstration of certain problematic sounds in EFL classes (Ercan, 2018).
In-service language teachers who teach the English language through the Auditory-Linguistic (AL) or Direct Method (DM) give particular attention to pronunciation teaching (Vásquez Aguiar & Toala Angulo, 2022). In addition to this, as it was pointed out by Larsen-Freeman (2015), pronunciation patterns are taught in language laboratories from the beginning of learners’ education to enable preservice teachers to acquire certain phonological features through the Auditory-Linguistic method. Besides that, in-service language teachers are expected to perform communicative evidence in L2 in Communicative Language Teaching (CLT) and see pronunciation skills as a vital component to teach in their EFL classes (Demirezen, 2010). Furthermore, as strongly emphasized by Demirezen (2010), demonstrations of certain problematic sounds such as schwa /è/ should be drawn more attention from language learners in a language class. Moreover, they are expected to use L2 fluently, however, complete accuracy is not required (Larsen-Freeman, 2020).
Regarding the EFL contexts, Derwing and Munro (2015) argued that in-service teachers who speak with non-native accents may end up with important social, psychological, and communicative consequences. Therefore, the results would affect in-service teachers’ preferences and perceptions about pronunciation teaching when they are given a teaching position in a classroom setting. On the other hand, recent research focused on different aspects of pronunciation teaching such as computer-assisted pronunciation teaching and shared their significant findings with scholars from different contexts over the world (e.g., Liu & Hung, 2016; Pourhosein Gilakjani & Rahimy, 2020). Other research focused on examining language learners’ and teachers’ attitudes and perceptions regarding L2 pronunciation teaching as an important factor (e.g., Chan, 2016; Sarandi, 2020; Tsang, 2021).
More specifically, Hismanoglu and Hismanoglu (2010) investigated 103 English language teachers in the North Cyprus context and reported their most frequently preferred pronunciation teaching techniques. They revealed that in-service teachers’ pronunciation teaching perceptions consisted of three traditional classroom techniques as 1-Reading Aloud, 2-Dictionaries, and 3-Dialogs. As for teaching perceptions and preferences, it is of great importance to reveal the pronunciation teaching perceptions of in-service teachers who teach L2 around the world in various contexts. Therefore, it is assumed their perceptions need to be systematically examined and reflected. This may help approaches and techniques to be improved. In the last 20 years, many studies were designed to be conducted in the field of teaching and learning pronunciation to reveal the perceptions of both learners and in-service teachers (Berry, 2021; Brown, 1992; Claire, 1993; Ocampo-Rodríguez et al., 2019; Yates, 2001). However, the latest research has focused on different aspects of L2 pronunciation teaching. For instance, Demir and Kartal (2022) have recently aimed to map and analyze L2 pronunciation articles published between the years 1977 and 2020 indexed in the Social Science Citation Index (SSCI) in the Web of Science (WoS) database in their state-of-the-art paper. They reported considerable results. They identified influential resources, featured documents, and authors in the field. They also mapped the most cited publications, authors, and references to help researchers visualize the intellectual structure of the L2 pronunciation domain through clustering. In another experimental research, Tsang (2021) investigated 166 EFL teachers and revealed that their overall pronunciation teaching attitudes were neutral contrary to positive expectations.
On the other hand, a study by Suzukida and Saito (2022) investigated 40 improvised speech samples performed by Japanese students. They aimed at revealing the global second language pronunciation proficiency of segmental and suprasegmental factors. They then reported varying levels of global L2 pronunciation proficiency. In addition, a study conducted by Tsunemoto et al. (2023) on 77 preservice teachers tried to reveal their beliefs about teaching pronunciation. At the end of their study, it was revealed that preservice teachers’ experiences were categorized into two different profiles defined by their contributions.
The initial profile consisted of those described as a mix of language learning/teaching experience and pronunciation teaching teachers. The second group was defined as those whose beliefs shaped the teachability of L2 pronunciation and approaches during teaching. It was also found that preservice teachers with more experience were more skeptical about learning and teaching L2 pronunciation than those with less experience.
A most recent study attempted to develop a pronunciation teaching perception scale (PTPS). In their study, Ercan and Gilanlioglu (2022) investigated 174 preservice teachers from eight different ELT departments. They arranged interviews with the participants and then conducted thematic content analysis (Braun & Clarke, 2006) to draft reliable items. Further, the content of the drafted scale was sent to field experts to be examined. After receiving feedback and revising the content based on the suggested improvements by the experts, piloting was done with the coded and transcribed items. Finally, after the data collection, they performed exploratory and confirmatory factor analysis. At the end of their study, they developed and reported a research tool with a high total variance value of 66.36% and a good fit value of χ2/df = 1.477 to determine preservice teachers’ pronunciation teaching perceptions.
In line with these findings, except for the Ercan & Gilanlioglu (2022) recent pronunciation teaching scale (PTPS), no pronunciation teaching measurement tool has been developed up until now to determine in-service language teachers’ perceptions with regard to pronunciation teaching to non-native majors of the English language. On the one hand, it is believed that figuring out why to teach pronunciation in language classes and how in-service teachers perceive pronunciation teaching in their classes would increase awareness in English teaching contexts to better support language learners’ language development to become more native-like or natural speakers of English. On the other hand, determining in-service teachers’ pronunciation teaching perceptions would enable the school principals to observe the quality provided in terms of language teaching. Therefore, the development of such a research tool can be considered to be a noteworthy contribution not only to the ELT field but also to teacher training.
Methodology
Participants
The study investigated 132 in-service language teachers from 42 state secondary and high schools in the 2021 to 2022 academic year in North Cyprus. They were selected based on Sharma’s (2017) stratified sampling technique. Their work experience ranged between zero (0) and 30+. They taught between 6 and 12 h of classes per week. In order to be able to investigate the in-service teachers who worked for the public schools, an official permission letter was received from the Ministry of Education (MOE). The total population of language teachers was 186 in those schools and the number of in-service teachers reached was 162. They were visited face-to-face in 2 months and they were given a consent form to sign to participate in the study. In the end, out of the 186 potential participants, 132 volunteered to fill in the questionnaire. To give more detailed information about the participant, while 78.8% of the teachers participating in the research were female, 21.2% were male. When the age distribution of teachers is examined, 3% are 20 to 24 years old, 9.8% are 25 to 29 years old, 21.2% are 30 to 34 years old, 18.9% are 35 to 39 years old, 18.9% are 40 to 44 years old, 15.2% of them are 45 to 49 years old, and 12.9% of them are 50 and over (Table 1). When the nationalities of the teachers are examined, 78% are TRNC, 9.1% are Republic of Turkey, and 12.9% are citizens of other countries. When the education level of the teachers is examined, 48.5% of them are undergraduates, 38.6% of them are graduates, and 12.9% of them are PhD graduates.
Individual Characteristics of Teachers.

Research Design
As the study aimed at developing a reliable measurement tool, no research questions were asked to be answered. Instead, in order to develop such an effective and reliable scale at the end of the study, some steps were followed. First, semi-structured interviews were organized with in-service language teachers from 42 different state schools. Then, this was followed by the thematic content analyses as suggested by Braun and Clarke (2006). Then, resulting 70 items for the quantitative data were coded and put under three names emotion, motivation, and attitude. Moreover, the items were sent to three field experts of ELT to be checked in terms of validity. Soon after receiving written and oral feedback, the items were revised and distributed to 186 in-service language teachers at the state schools. 132 of the teachers responded to surveys. Furthermore, the obtained data were typed in the SPSS (ver. 24) to be analyzed. Finally, the exploratory factor analyses were performed.
Data Analysis
The collected data were analyzed in the SPSS and Amos (ver. 24) software programs to develop a reliable research tool to be used with in-service language teachers. As for the first step, exploratory factor analysis was applied. This was followed by the Extraction Method in which Principal Component Analyses were conducted. Then, Direct Oblimin with the Kaiser Normalization method was used as the rotation method. The reason why this method was used was the Component Correlation Matrix. Based on the obtained findings, there is a moderate positive relationship between some factors. Therefore, it is considered that there is a relationship between dimensions in the background of item writing. Items with anti-image values below 0.50, commonalities extraction variance values below 0.40, and factors with less than a 0.10 difference between them which were distributed over more than one factor according to the Pattern Matrix have been removed. Based on the parameters, the exploratory factor analyses were repeated 9 times. As a result, a 6-factor structure consisting of 26 items was obtained. Further, the confirmatory factor analyses were conducted with the Amos software program in order to verify the reliability and validity of the structure. While conducting the confirmatory factor analyses, model fit values were tested with the Maximum Likelihood method. Furthermore, model fit values were found to be compatible with the parameters in the literature. Afterward, Pearson correlation analysis was applied to determine the concordance validity between the factors, and it was determined that there was a high and moderate relationship between the dimensions, and they were compatible with each other. Finally, the Cronbach Alpha internal consistency coefficient value was calculated to determine the reliability of the scale upon meeting the exploratory factor analyses, confirmatory factor analyses, and concordance validity. It was obtained that the overall scale and its six dimensions were highly reliable. As a result of all these analyzes, a scale with good validity and reliability values was developed.
Results
The KMO value was calculated as 0.893 from the Kaiser Meyer Olkin and Bartlett Sphericity Tests (Table 2). It was conducted to determine whether the collected data met the required number of factor analyses or not. According to Kaiser (1974), a value of 0.80 is considered meritorious. Bartlett’s Test of Sphericity was found to be statistically significant (χ2 = 1,753.455, p < .001). In line with these results, it was seen that the sample size and the collected data met the assumptions of conducting factor analysis.
The Kaiser Meyer Olkin (KMO)—Bartlett Sphericity Tests.

Note. Bold part indicates a significantly found value.
When the scree graph (see Figure 1) is examined, the red line belongs to point number 1. There are five different cut-off points on the red line in the graph, and the developed scale consists of a factor structure consisting of five sub-dimensions with 24 items.

Scree plot.
When the Table 3 is examined, the lowest factor load value was calculated 0.547. The highest factor load value was found 0.887. Further, the lower limit of the lowest factor loading value that should be 0.32 on a scale (Tabachnick & Fidel, 2011) and the lowest value obtained in this scale was found 0.547. Besides, the total variance explained in the present scale was reported 66.113%, and the minimum accepted value for this value according to Yaşlıoğlu (2017) is 50%. The fact that the total variance ratio of the scale seems to be 16.11% above the 50% lower limit that provides the condition of being able to represent the feature to be measured. According to Yaşlıoğlu (2017), the Commonalities extracted value should be at least 0.50. In this study, the lowest value is 0.547, which meets the lower limit. The first factor consists of 6 items and its eigenvalues are 9.164, with the lowest factor loading of 0.587 and the highest factor loading of 0.755. When factor 2 is analyzed, it consists of 6 items and its eigenvalues are 2.284, the lowest factor load is 0.554 and the highest factor load is 0.854. When factor 3 is examined, it consists of 4 items and its eigenvalues are 1.711, the lowest factor loading value is 0.547, and the highest factor loading value is 0.887. On the other hand, factor 4 consists of 4 items and its eigenvalues are 1.416, while the lowest factor loading value was found 0.603 and the highest value was found 0.716. When factor 5 is examined, it consists of 4 items and its eigenvalues are 1.292, the lowest factor loading value is 0.671 and the highest value is 0.833. The rate of variance explained by Factor1 is 38.18%, Factor2 is 9.51%, Factor3 is 7.12%, Factor4 is 5.90%, Factor5 is 5.38%. The total explained variance rate was found 66.113% as displayed in Table 4 above.
The Factor Distribution of the Scale with Its Item Factor Loads and Variances.

Pearson Correlation Analysis of the Fit Values Between Factors.

Note. Bold part indicates a significantly found value.
A positive significant relationship was found between all factors (p < .05). Factor1 is moderately positively correlated with all other factors. Factor2 has a weak correlation with Factor3. On the other hand, Factor4, 3, and 4 are moderately correlated (p < .05). The factor is moderately positively correlated with two other factors. Factor3, on the other hand, has a weak correlation with Factor4 but a moderately positive correlation with other factors. Factor4 and factor6 have a very weak relationship (p < .05). There is a moderate relationship between factor5 and factor6. According to these results, the significant relationship between the factors (p < .05), shows that the scale provides congruent validity.
Chi-Square Test (CMIN and CMIN/DF)
The Chi-Square value is the most basic measure used to test the overall fit of the model. This value serves to evaluate whether there is a difference between the sample covariance matrix and the (modeled) covariance matrix adapted by the model (Hu and Bentler, 1999, p. 2) It is expected that a suitable model will give meaningless results at p < .005 (Barrett, 2007, pp. 815–824).
Root Mean Square Error of Approximation (RMSEA)
RMSEA is a statistic that informs the researcher about the extent to which the parameters that are unknown but optimally planned are compatible with the covariance matrix of the population (Byrne, 2011, p. 664). In recent years, it has been evaluated as the most reliable statistical model that gives reliable information (Diamantopoulos, 2011, p.85).
Goodness-of-Fit Index (GFI)
The GFI statistic was developed to eliminate the problem that the Chi-Square statistic increases as the sample gets larger, and is less sensitive to sample size. It is basically the result of the ratio of the model covariance and variance to the measured variance and covariance. In short, it is a proportional comparison of the real and the modeled (Maiti & Mukherjee, 1991). Furthermore, the GFI statistic takes values between 0 and 1 and is inverse to the degrees of freedom. The GFI statistic takes values between 0 and 1 and moves inversely with the degrees of freedom. Therefore, it can be said that the ratio of sample size to degrees of freedom tends to increase as the ratio increases (Bollen, 1990, pp. 256–259; Hoelter, 1983, pp. 324–344).
Comparative Fit Index (CFI)
CFI is the enhanced version of the NFI statistic. It also takes sample size into account and gives good results even with small samples. It is one of the most accepted and used statistics. It obtains results by comparing the zero model with the sample covariance matrix in an NFI-like fashion and also takes values between 0 and 1. The closer to 1, the better the fit of the model. A threshold value of 0.90 was accepted at the beginning, and then 0.95 values were determined as good fit indicators (Bentler & Bonett, 1980). Since it is the statistic that is least affected by the sample size, it is used in almost all package programs (Fan et al., 1999, pp. 56–83).
Confirmatory Factor Analysis Findings
For χ2/df value Wheaton et al. (1977) and below 5, according to Tabachnick and Fidell (2007) below 2 satisfies the fit value condition. It is seen that the value obtained in this study (χ2/df = 1.314) meets the value of excellent fit (Table 5). According to Yaşlıoğlu (2017), it is stated that the closer the RMSEA value is 0.1, the worse the fit, and the closer it is 0, the better the fit. Since the RMSEA value in this model is 0.45 and below 0.5 as stated in many sources, this value provides the perfect fit condition is seen. The NFI value is 0.822, slightly below the acceptable fit value. According to Mulaik et al. (1989), the NFI value is low in the samples studied below 200. It is seen that the sample size in this study is less than 200, which affects the NFI value below 0.90. As stated by Yaşlıoğlu (2017), due to the low sample size in this study, TLI value should be taken into account. However, this value above the threshold value of >0.80 meets the acceptable threshold value (Byrne, 2011) and the value in this model is 0.949, which is slightly below the 0.95 considered perfect value. Therefore, it can be said that a good value has been achieved according to this model. The IFI value of this model is 0.957, which is above the 0.95 value, which is considered excellent in many sources. When the CFI value is examined, the value of the model is 0.956 and it is seen that it has a value above 0.95, which is accepted as a good fit according to Bentler and Bonnet (1980). The GFI value of this model is 0.837, slightly below the lower limit of 0.90. Since this value is sensitive to the sample size, it is thought to affect the fact that it is below 0.90. In this model, the AGFI value is 0.798, slightly below the lower limit of 0.85. The reason for the AGFI to be slightly lower may be related to the low sample size, similar to the NFI and GFI values. The RMR value is 0.77, and this value between 0.5 and 0.10 indicates that the newly developed scale met the acceptable parameters. Besides, when the model fit values of this study were compared to the studies in the literature, it is clear that some values met the fit condition and some values met the excellent fit values (Byrne, 2011; Schermelleh-Engel & Moosbrugger, 2003; Tabachnick & Fidell, 2007; Yaşlıoğlu, 2017).
Confirmatory Factor Analysis Model Fit Values.

Figure 2 above presents the relationship and distribution of each factor in terms of percentages of the five factors obtained from the confirmatory factor analysis.
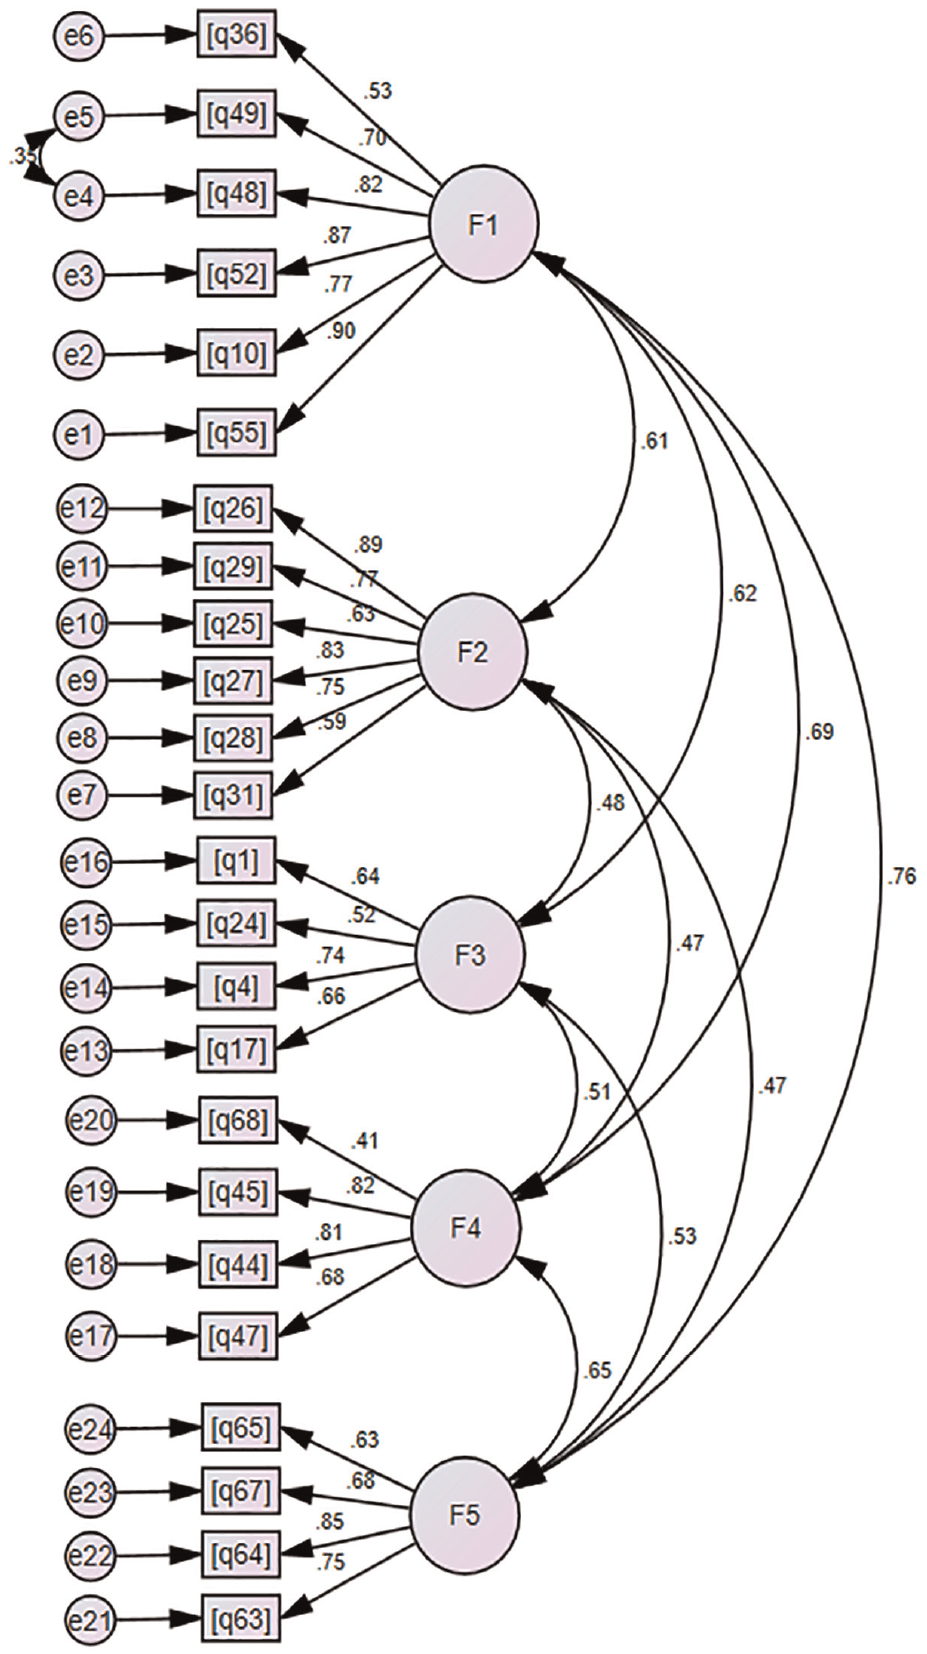
The factor distribution path chart resulting from the confirmatory factor analysis.
Reliability Findings
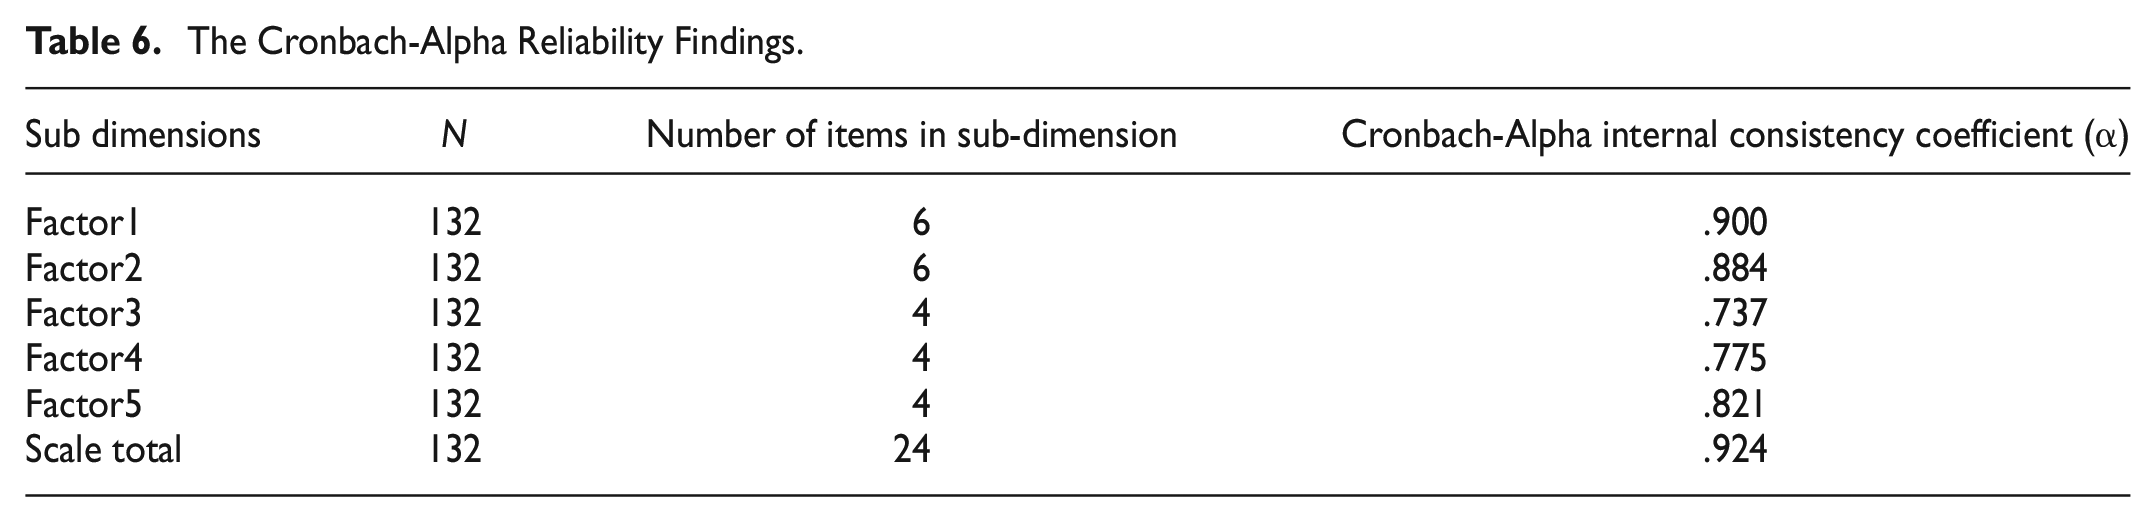
According to Kılıç (2016), Cronbach’s alpha value above .7 is considered good, while .9 is considered excellent. It is seen that the first factor is (α = .90) and it is excellently reliable. Since the α values of all the factors between the second factor and the fifth factors have values between .737 and .884 (see Table 6). Therefore, these factors seem to be highly reliable to be used with in-service teachers. The Cronbach-Alpha Internal Consistency Coefficient (α) value for the overall scale is .924, and the scale has an excellent value. Based on these values, it is seen that the scale is a high degree of a reliable measurement tool.
The Cronbach-Alpha Reliability Findings.
Discussion and Conclusion
When the development of the overall scale is reconsidered, it is clear that an excellent fit value was obtained as the Cronbach-Alpha internal consistency coefficient value (α) for the overall scale, which was obtained as .924 (Kılıç, 2016). Furthermore, a new pronunciation teaching perception scale (PTPS) for in-service language teachers in the Cyprus context was developed with high-reliability values (χ2/df = 1.314) to determine their perceptions in the field of language teaching and learning. The conducted exploratory and confirmatory factor analysis confirmed that the scale had five factors as Using English for Communication, Efforts to improve pronunciation skills, Focus on grammar and sentence structures, Pronunciation teaching style, and Emphasis on pronunciation teaching.
As the Cronbach-Alpha value in this model was .924 (See Table 6), which indicated that the developed scale met the excellent reliability level to be used as a measurement tool for revealing in-service teachers’ perceptions regarding pronunciation teaching (Kılıç, 2016; Tabachnick & Fidell, 2007; Yaşlıoğlu, 2017). As a result, the Pronunciation Teaching Perception Scale for Service Candidates (PTPS), which was developed for the stated purpose, has proven to be an appropriate and effective tool that can be used in the field of ELT with its high-reliability value. In addition, the most important implication for the ELT field is that the use of such a scale will help researchers more reliably identify perceptions of pronunciation teaching and thus provide evidence that appropriate teaching methods, techniques, and curricula will be implemented.
In parallel with perception studies, a study that can be considered close to our study in terms of instrumentation examined the ELT department students’ deeper understanding of pronunciation problems. At the end of the study, it was revealed that it was possible to improve pronunciation teaching and skills (Yavuz & Keser, 2019). As Ducate and Lomicka’s (2009) study adopted and used 12 Likert scale items, it could be assumed that richer data can be collected by using our newly developed scale in such contexts regarding in-service teachers since it has five factors and meets the perfect fit value (χ2/df = 1.314).
All in all, the current study focused on developing an effective tool to investigate the in-service teachers’ pronunciation teaching perceptions in ESL/EFL contexts in Cyprus context. Based on the conducted exploratory and confirmatory factor analyses, the scale consisted of five factors namely Using English for Communication, Efforts to improve pronunciation skills, Focus on grammar and sentence structures, Pronunciation teaching style, and Emphasis on pronunciation teaching. Since Cronbach-Alpha values were found over .7 (See Table 6) and χ2/df value was 1.314 in our model, it can be stated that the developed scale is a highly reliable research instrument in revealing the pronunciation teaching perceptions of the in-service teachers (Kılıç, 2016; Tabachnick & Fidell, 2007; Yaşlıoğlu, 2017). To sum up, the Pronunciation Teaching Perception Scale developed for in-service teachers proved to be a reliable and effective research instrument for pronunciation measurement in training English majors for the job. Finally, the main implication of this research for the field of pronunciation teaching is that the use of such a scale will help to more reliably identify perceptions of pronunciation teaching. Besides, providing evidence on appropriate teaching techniques, methods, and curricula would be useful in any language teaching context.
Supplemental Material
sj-docx-1-sgo-10.1177_21582440231219065 – Supplemental material for Pronunciation Teaching Perception Scale (PTPS) for In-Service Teachers
Supplemental material, sj-docx-1-sgo-10.1177_21582440231219065 for Pronunciation Teaching Perception Scale (PTPS) for In-Service Teachers by Halil Ercan and Mehmet Demirezen in SAGE Open
Footnotes
Acknowledgements
As authors of this manuscript, we would like to thank the journal for giving us the opportunity to share our recent knowledge with researchers in the field. We would also like to thank other stakeholders who contributed to its publication.
Author Note
This research was conducted while Mehmet Demirezen was at Cappadocia University. He is now at Hacettepe University and may be contacted at B-Block Faculty of Education, The Division of English Language Teaching, 06800, Beytepe-Ankara, Turkey.
Declaration of Conflicting Interests
The author(s) declared no potential conflicts of interest with respect to the research, authorship, and/or publication of this article.
Funding
The author(s) received no financial support for the research, authorship, and/or publication of this article.
Ethical Approval
The current study involving human participants was reviewed and approved by the Scientific Research and Publication Ethics Board of the Eastern Mediterranean University (Reference No: ETK00-2021-0131, Issue: 91). The patients/participants provided their written informed consent to participate in this study. Written informed consent was obtained from the individual(s) for the publication of any potentially identifiable images or data included in this article.
Data Availability Statement
Data used for this study will be made available upon reasonable request.
Supplemental Material
Supplemental material for this article is available online.
References
Supplementary Material
Please find the following supplemental material available below.
For Open Access articles published under a Creative Commons License, all supplemental material carries the same license as the article it is associated with.
For non-Open Access articles published, all supplemental material carries a non-exclusive license, and permission requests for re-use of supplemental material or any part of supplemental material shall be sent directly to the copyright owner as specified in the copyright notice associated with the article.