
Abstract
This paper aimed to explore customer value-driven factors and evaluated competitive positioning to formulate the sustainable business strategy for theme parks in Taiwan. We employed Borda count to obtained the customer value-driven factors. This paper further developed a hybrid quantified SWOT analysis to identify the competitive positioning for the four major theme parks in Taiwan, The findings in this paper were: (1) There are nine customer value-driven factors attributed into the three dimensions of park characteristics, service characteristics, and exogenous characteristics, which are significant important for theme park sustainable survive; (2) Lihpao Resort is located in the first (SO) quadrant with its internal strengths and external opportunities simultaneously but it has less external opportunities; (3) Formosan Aboriginal Culture Village is located in the third (WT) quadrant with its internal weakness and external threats, which has the worst performance compared with other theme parks in this paper; (4) Leafoo Village Theme Park is located in the first (SO) quadrant with its internal strengths and external opportunities, which has less internal strengths compared with Lihpao Resort; and (5) Janfusun Fancy World is located in the fourth (TS) quadrant with its the external threats and internal strengths. Conclusions and suggestions are also discussed.
Plain Language Summary
In a time where consumers are increasingly informed, adopting a customer-focused marketing approach is crucial for long-term business success. This means that effective marketing strategies can not only benefit customers but also enhance the competitiveness of the theme park industry. This paper presents a methodology to discover customer value-driven factors and assess the competitive position of theme parks. It highlights areas for improvement in each park, serving as a valuable guide for operators aiming to strengthen their competitive edge. However, it’s important to note a limitation of this study, which arises from collecting data during a specific period in Taiwan, namely, the summer vacation. This restricts the generalizability of the findings. To enhance external validity, future studies should consider gathering a more diverse sample from various time periods. Additionally, exploring whether there are cultural differences in customer value-driven factors and competitive positioning through replication of this study presents an intriguing avenue for further research.
Keywords
Introduction
Over the past few decades, the theme park market has grown exponentially across the globe. For example, in the United States, there are more than 200 theme parks with millions of paying attendees each year. This strong consumer demand has led to the development of many parks. These parks are not only growing rapidly in size and importance, but are also investing heavily in new entertainment and facilities. In recent years, the number of parks is increasing, and the competition in the theme park market is becoming more and more intense. Therefore, theme parks have to be optimized in order to survive in this competitive market.
In Taiwan, with the rise in per capital income and the implementation of the 2-day weekend, the demand for leisure activities has gradually increased. The leisure and tourism industry in Taiwan are divided into two categories: the domestic demand (leisure) market and the external demand (sightseeing) market. Although the number of foreign tourists visiting Taiwan has grown by more than 5% per year (even more than 10%), the tourism and leisure market still has more than 60% of customers coming from domestic demand-based leisure industries. Unlike traditional leisure and sightseeing activities that focus on eliminating physical and mental stress, visitors to theme park tourism are more focused on fun, novelty, excitement, change, and entertainment. A theme park is designed to provide a joyful recreational experience. Taiwan’s theme park industry has been experienced low profitability due to its smaller market size and larger money invested, which leads the capital investment cannot be recovered in a short term. In general, the life cycle of amusement facilities is about 2 to 3 years. If a theme park does not renew these facilities, the number of tourists will decrease. Therefore, large-scale fund investment in equipment is often an important key to the survival of a theme park (Hyun, 2009). Recent studies (e.g. Kim and Kim, 2016; Li et al., 2021; Razak et al., 2019; Wu et al., 2014), however, have demonstrated that a successful theme park not only focus on the facility investment but also get attention on creating customer value. When customers feel that the benefits of their experience in the park are greater than the monetary and non-monetary costs they spend, they generate customer value and then share their experience to their friends and/or on the Internet. This leads the number of visitors to the park increases substantially by the word of mouth.
There are many factors that affect customer value. However, with limited resources, theme park operators would not invest their time and money in all these factors. Alternatively, if the operators can identify which factors are the key drivers of the theme park’s customer value, they then could employ less time and cost to increase the park’s competitiveness. At the same time, when the operators clearly identify the positioning of the theme parks, they then make the most of the advantages of the parks to formulate relevant competitive strategies. Furthermore, by understanding the positioning of competitors, one can avoid the threat of competitors and create its own niche. However, traditional papers discussed theme parks focused on customer satisfaction or loyalty of theme park and lack of studies evaluating the customer value-driven factors and competitive positioning of theme parks in which they are important issues for strengthening the competitiveness of theme parks in the micro-profit era. Based on the above discussion, this study believes that the customer value-driven factors and competitive positioning of theme parks is an interesting and worthy of research issue. This paper, therefore, obtained data from the Tourism Bureau of the Ministry of Communications (2020) in Taiwan for the most recent 7 years and found that the four major theme parks are Janfusun Fancy World, Lihpao Resort (originally called Yamay Resort), Leafoo Village Theme Park, and Formosan Aboriginal Culture Village. This paper then selected these four theme parks as research objects. The purpose of this study explored customer value-driven factors and evaluated competitive positioning to formulate the sustainable business strategy for theme parks in Taiwan by employing Borda count and a hybrid quantified SWOT analysis, separately. We note that the outbreak of COVID-19 in 2019 has had a serious impact on the global economy, and the tourism industry can be said to bear the brunt. Therefore, we did not include the outlier data in 2020.
The added value provided by the hybrid quantified SWOT analysis lies in its ability to offer a comprehensive and data-driven approach to strategic assessment, thereby showcasing the significance of the contribution. Unlike traditional SWOT analyses that often rely on qualitative judgments, the hybrid quantified SWOT analysis integrates both qualitative and quantitative aspects of evaluation. This integration leads to several key advantages that highlight the importance of this approach:
Objective decision-making: By incorporating quantitative data, the hybrid approach reduces subjectivity and biases in strategic decision-making. This ensures that the analysis is based on concrete information rather than solely on perceptions.
Robust strategic insights: The hybrid approach provides a deeper and more nuanced understanding of the organization’s internal and external environment. The combination of qualitative insights with quantitative metrics enhances the overall strategic insights, enabling managers to develop more effective and targeted strategies.
Quantifiable assessment: The quantified SWOT analysis generates numerical scores or rankings, making it easier to compare different factors and evaluate their relative significance. This quantitative assessment aids in communicating the strategic assessment’s results to stakeholders in a clear and structured manner.
Risk assessment: Incorporating quantitative data in the analysis allows for a more precise evaluation of risks associated with identified weaknesses and threats. This enables proactive risk mitigation strategies to be developed, enhancing the organization’s resilience.
In summary, the hybrid quantified SWOT analysis contributes significantly by elevating the strategic assessment process to a more objective, data-driven, and actionable level. Its incorporation of quantitative measures adds depth, precision, and reliability to the analysis, enabling theme park managers to make well-informed decisions that are aligned with the organization’s objectives and the dynamic market landscape.
This paper therefore makes three contributions. First, to the best of our knowledge, it is the first study that employs a hybrid quantified SWOT analysis to leisure industry in which it can help the manager to identify the theme park competitive positioning. Second, according to a focus group interview and Borda rule, the customer value-driven factors of theme park are found, which facilities the manager focus on the main key factors to allocate his/her resources for the theme parks. Additionally, the implementation of a hybrid quantified SWOT analysis offers a novel perspective by integrating both qualitative and quantitative aspects of strategic assessment. This approach enables a comprehensive understanding of the theme parks’ internal strengths, weaknesses, external opportunities, and threats, while also providing a quantified assessment that helps prioritize strategic actions. This contribution is particularly significant as it equips theme park managers with a more robust decision-making framework, allowing them to navigate the complex landscape of the leisure industry more effectively. Third, this study goes beyond mere analysis by delving into the competitive advantages and disadvantages of theme parks and proposing improved strategies. By identifying specific areas of strength and areas that require enhancement, the study aids in the development of sustainable business strategies that align with the dynamic demands of the market. This multifaceted approach not only benefits the individual theme parks under investigation but also contributes to the broader body of knowledge in the leisure and tourism domain.
Literature Review
Related Researches on Theme Parks
For theme parks, most scholars (e.g., Durrant et al., 2012; Jung et al., 2015; Trischler and Zehrer, 2012) focused on service quality, customer satisfaction, and willingness to revisit, and they pointed out that service quality and customer experience have a significant positive effect on customer loyalty. Manning (2011) argues that recreation satisfaction is influenced by three factors such as the biological characteristics of the substance in the ranking of recreation opportunities, the type and level of operation and management, and the social and cultural characteristics of visitors. Propst and Lime (1982), on the other hand, pointed out that the substantial facilities of the recreation base, the characteristics of the environment, the behavior of the operation and management, and the socio-cultural characteristics of the visitors are the three main factors that influence the satisfaction of outdoor recreation. In the past two decades, Lewis and Clacher (2001) have delved into service failures and remedies in UK theme parks. Their study illuminates the benefits of quality enhancement, including heightened repeat visits, strengthened customer loyalty, positive word-of-mouth referrals, and potential cost savings. Propst and Kurtzz (2006) pointed out that a perceived leisure control/reactance theoretical framework is developed and applied to specific leisure phenomena such as social carrying capacity, satisfaction, site choice, displacement, and depreciative behaviors. Bigné et al. (2005) further provide a detailed and complete review of the topic of customer satisfaction in theme parks, which can be used by interested parties for further analysis and comparison. More recently, Razak et al. (2019) studied theme park in central and northern Malaysia, and their study pointed out that the most important key factor affecting theme park customer satisfaction and loyalty is the park atmosphere. Wei et al. (2019) explored how VR technology can enhance the experiential behavior of theme park visitors, and their study enabled theme park managers to understand that VR technology has a significant impact on consumer satisfaction. Milman and Tasci (2018) identified the drivers of theme park customer satisfaction and loyalty, noting that visitors who stay overnight in theme parks have more emotional stimulation and customer value than those who do not stay overnight in theme parks, and they also have higher levels of satisfaction. Milman et al. (2020) discussed theme park visitors’ attitudes toward interacting with robots and investigated the qualities and functions of robotic servers and their influence on customers’ loyalty. They showed that human-centered qualities have a significant impact on perceived robotics functionality and that robotics functionality has a strong positive impact on customer loyalty. Jedin and Balachandran (2021) examined the role of the marketing mix and its initiatives to understand better customer service satisfaction in the amusement and entertainment theme park industry in which five of the seven metrics had a significant impact on customer service satisfaction in the edutainment theme park industry. We note that all of the above papers focused on customer satisfaction and/or loyalty. However, to the best of our knowledge, lack of studies evaluated the customer value-driven factors and competitive positioning of theme parks in which they are important issues for strengthening the competitiveness of theme parks in the micro-profit era.
Related Researches on Customer Value
Customer-driven factors play a pivotal role in shaping the success of businesses, encompassing a spectrum of interconnected elements including customer satisfaction, loyalty, trust, and brand perception. Noteworthy studies such as the work of Anderson and Sullivan (1993) shed light on the transformation of satisfied customers into loyal advocates, fostering positive word-of-mouth and enhancing financial performance. Furthermore, the research by Ranaweera and Prabhu (2003) emphasizes how trust and minimized switching barriers solidify customer retention. The collective impact of these factors on “customer equity,” as emphasized by Bolton et al. (2004), directly influences business value and growth. Homburg and Giering’s (2001) insights into personal characteristics as moderators illustrate the intricacies of personalized customer-driven strategies. Notably, Morgan and Hunt’s (1994) commitment-trust theory underscores emotional connections in customer relationships. These studies collectively underscore the adept understanding and strategic integration of customer-driven factors that cultivate lasting customer loyalty, drive positive outcomes, and enhance a company’s competitive positioning. In line with these findings, Cho et al. (2020) offer insights into motivating membership within consumer-driven organizations, a pivotal aspect for survival. Vojdanian et al. (2023) contribute by examining factors crucial to effective Strategic Niche Management (SNM), highlighting the role of social networks, expectations, and customer-driven learning in sustainable innovation and development. In conclusion, the intricate interplay of customer-driven factors forms the bedrock of business prosperity, intertwining elements like customer satisfaction, trust, and personal characteristics to shape relationships and determine trajectories. As evidenced by a rich body of research, these factors constitute an interdependent network that, when strategically harnessed, can yield profound outcomes. Businesses that prioritize understanding, measuring, and leveraging customer-driven factors position themselves to cultivate enduring customer relationships, while unlocking the potential for sustained growth, competitive advantage, and lasting success in today’s dynamic and customer-centric marketplace.
Previous studies have shown that it costs five times as much to create a new customer as it does to keep a regular one (Keller, 2013). This implies that theme park managers not only need to retain regular customers but also need to create new customers in the era of fierce competition. It is recognized that the perceived value of products and services can attract new consumers and bring benefits for companies (Hollebeek, 2013; Jin et al., 2015; Sweeny et al., 1999). Moreover, many studies have shown that perceived value is a better predictor of repurchase intentions than satisfaction, commitment, or trust (Rihova et al., 2013). This indicates that a theme park should create the customer value (i.e., customer perceived value) for its survive. Although researchers have different definition on customer value due to the difference of observation perspectives, most of them generally recognized customer value is the overall assessment of the utility of the product or the total value received by the consumer based on what he or she perceives to have given and received (Bovet et al., 2000; Mikami, 2019).
While customer value is usually created, communicated and delivered by the vendor, it must be truly understood and felt by the consumer as a substantial benefit in order to be a driving force in the marketplace. As a result, the customer is no longer simply satisfied with the goods or a service provided by the company, but is more concerned with what value the goods can create for him. Naumann (1995) argues that customer value can be examined in terms of three dimensions: the quality of products that consumers expect, the quality of services that customers perceive, and value-based pricing. Kotler (1994) proposed that customer value is the total value that customers get from products or services, and he proposed that value includes product value, service value, personal value, and image value. However, for customers to obtain the value generated by the above products and services, customers must spend considerable costs, and the customer value is the real value obtained by customers after deducting the customer costs. Zeithaml et al. (2018) provided that customer value is the overall evaluation of product utility formed by customers’ perceived gains and perceived losses. Therefore, recent scholars have developed their research on the customer value of theme parks based on these scholars. For example, Jin et al. (2015) concluded that the quality of the park experienced by participants significantly affects perceived value, park image, and customer satisfaction; moreover, perceived value and park image directly affect customer satisfaction and can positively influence behavioral intentions. Hollebeek (2013) further combined customer value and customer engagement to develop a conceptual model interface of customer engagement/customer value (CE/CV) for branded utilitarian and hedonists. They found that customer value increased more for hedonists than for utilitarian when customer engagement gradually increased until the combined perceptions of brand, category, consumer, and specific situation were optimal, when the customer value increases for both types of visitors converged. In other words, when customers compare the benefits (quality) and sacrifices (relative price) gained from a transaction, the more positive the perception of individual value attribute dimensions, the higher the overall perceived customer value (Chen and Dubinsky, 2003; Huang and Lin, 2020; Leroi-Werelds, 2019; Samudro et al., 2020). Alzoubi et al. (2020) further indicated that perceived service value, perceived service quality, perceived price fairness, and perceived service recovery could be considered as the critical success factors that can be used to shape and measure customer satisfaction and delight. The findings can be used as guidelines to retain customers and to enhance the business value especially when organizations service providers focusing more on what customer perceive rather than focusing on what to offer from products and/or services. Sharmelly and Klarin (2021) explored the customer value creation framework and discussed the design of the key elements for product development in emerging markets in which four customer values including cost value, functional value, experiential value, and symbolic value are created. Based on the above discussion, we found that only few researchers focused on the customer value in which they believed that creating customer value effectively may increase customer satisfaction and loyalty, which increase the competitiveness of theme park. However, they did not identify which items are the key customer value-driven factors which can help theme park managers with the least amount of time and cost to get the most economic benefit.
Related Researches on SWOT Analysis for Competition Strategy
For the issue of competitive environment analysis, Andrews (1965) developed the SWOT (Strengths, Weaknesses, Opportunities, Threats; SWOT) analysis method, which is a static analysis of the market from internal and external environments, and used the results as the basis for strategy development. However, the main drawback of this method is that it is not possible to rank the weights of the factors in the SWOT analysis. Therefore, researchers further combined Analytic Hierarchy Process (AHP) with SWOT analysis to develop SWOT-AHP method to determine the weights of SWOT criteria (Kahraman et al., 2008; Kurttila et al., 2000; Shrestha et al., 2004). This approach simultaneously uses a multi-level analysis framework to simplify complex problems, and then quantifies and weights the competing SWOT indicators to select the best strategy. T. H. Lee and Liu (2011) used the SWOT-AHP method to evaluate strategy formulation in nine recreation areas in central Taiwan, but their method could only work at linear vertical evaluation, which does not work at stratified studies with feedback patterns. Yuksel and Dagdeviren (2007) further developed the Analytic Network Process (ANP) to capture the potential interactions, internal dependencies, and feedbacks of the SWOT criteria factors. While the above methods are very helpful in assisting in measuring each factor in a SWOT analysis, they ignore the fact that decision makers are sometimes unable to make an accurate assessment during the decision process. Therefore, Sevkli et al. (2012) proposed the Fuzzy SWOT ANP to remedy these shortcomings and to assist decision makers in analyzing the competitive environment to avoid bias in information transmission due to human (individual or group) errors. Unlike the aforementioned SWOT analysis that combines AHP, ANP, and Fuzzy ANP, Chang and Huang (2006) proposed a quantitative SWOT analysis to evaluate the strengths and weaknesses of each firm in the competitive market through multi-attribute decision making and the Grand Strategy Matrix (GSM) at the same time, and provide strategic recommendations to each company. K. L. Lee et al. (2009) used a fuzzy SWOT analysis to evaluate the competitive positioning of information service industry in developing international supply chains in the Asia-Pacific region. We noted that the method developed by K. L. Lee et al. (2009) is very complex and requires comparisons of assessment factors, which is time consuming and not easy to judge. Moreover, decision makers often do not understand fuzzy theory, which is difficult and error-prone to use. Comprehensive fuzzy AHP methods for decision-making with subjective judgments could be found in Liu et al.’s work (2020) and Benzaghta et al.’s (2021) paper.
Based on the above discussion, we therefore developed a hybrid quantified SWOT analysis, which is more easy use and understand, to identify the theme park competitive positioning in which it employed multi-attribute decision and strategy matrix to understand the degree of competition of each competitor in the internal and external environment. The relationships of competing firms are then marked on four coordinate positions in a two-dimensional space, which is well suited for evaluating the competitive positioning of a firm in the industry.
Questionnaire Design and Research Method
Questionnaire Design
To assess the competitive positioning of theme parks, we first provide a listing of candidate customer value-driven factors to the moderators of a focus group interview through literature review and our experiences. The focus group interviews (FGI) was performed with 12 experts who draw up a total of 16 initial customer value-driven factors. However, too many customer value-driven factors cause difficulties in respondent judgment. This paper then employed Borda count to eliminate parts of those factors with less weight. In January and February 2019, we administered questionnaires across the four designated theme parks. Subsequently, we conducted surveys targeting individuals aged 15 to 35. These surveys aimed to gauge the perceived significance of sixteen distinct factors. To achieve this, we employed a purposive sampling method, a non-probability sampling technique that deliberately selects samples to yield comprehensive and insightful data. This approach facilitates researchers in addressing their research inquiries more comprehensively. A total of 281 valid questionnaires were collected from visitors in these four parks, including 67 from visitors of Janfusun Fancy World, 73 from visitors of Lihpao Resort, 70 from the visitors of Leafoo Village Theme Park, and 71 from visitors of Formosan Aboriginal Culture Village. A total of nine customer value-driven factors for theme park were obtained (to be detailed in Research Results section) and grouped into three dimensions. We then used these factors as questions in the formal questionnaire, and designed as Likert’s nine points scale.
Research Method
We first used FGI to collect the candidates for customer value-driven factors. This paper employed FGI with 12 experts, four experts from academia (with at least 5 years of experience teaching leisure management), four tourism managers (with at least 10 years of experience in the tourism industry), and four visitors aged 15 to 35 who had visited the four parks. These experts draw up a total of 16 initial customer value-driven factors. However, too many customer value-driven factors cause difficulties in respondent judgment. This paper therefore employed Borda count to eliminate parts of those factors with less weight. The concept of Borda count method is to assign points to candidates. Each candidate earns 1 point for every voter that ranked them last, 2 points for every voter that ranked them second-to-last, and so on. After adding up each candidate’s total points, the candidate with the most points wins (Breton and Truchon, 1997).
This paper developed a hybrid quantified SWOT analysis to assist theme park operators in understanding the competitive positioning of their parks. This method combines FGI, Borda count, and the modified quantified SWOT analysis which complemented the evaluation steps proposed by Chang and Huang (2006). The hybrid quantitative SWOT analysis method developed in this paper was as follows:
Step 1: Employ FGI to identify the generalized customer value-driven factors.
Step 2: Extract the customer value-driven factors using Borda count in which the average score for each candidate is employed.
Step 3: Classify the extracted customer value-driven factors into internal and external environment dimensions.
Step 4: Identify the objects (i.e., theme parks).
Step 5: Issue questionnaires and collect data.
Step 6: Calculate the results of the questionnaire survey. The original evaluation performance (i.e. pij) is the average of these respondents’ score and then divided 9 (This is because we employed Likert’s nine points scale).
Step 7: Employ equation (1) suggested by Chang and Huang (2006) to obtain the normalized performance values when the value-driven factor is profit-oriented.
Performance indicators:

where
Step 8: All the value-driven factors obtained in Step 2 were categorized into internal and external environment value-driven factors according to Step 3. The normalized weighted values


We note that r represents the number factors in the internal environment. This implies there are (m − r) factors in the external environment.
Step 9: The following equations (4) and (5) are used as the benchmark value for the internal and external competition evaluation indicator, respectively. The formulas are as follows:


Step 10: Equations (6) and (7) are used to calculate the value of the horizontal coordinate (internal environment) and the value of the vertical coordinate (external environment) for each object, respectively.


Step 11: The coordinates obtained in step 10 are marked in the four quadrants of the SWOT matrix to distinguish their competitive positioning
Research Results
Extraction of Customer Value-Driven Factors
Traditional theme park researchers have been dedicated to exploring visitor satisfaction and service quality, in contrast to the lack of research on the customer value-driven of theme parks. As described in the previous section, 12 experts were invited to construct the initial customer value-driven factors through FGI. A total of 16 initial customer value-driven factors within the three characteristic dimensions were derived after discussion among the experts. They are (1) park features: including thematic features, novel and fun rides (attractions), exciting shows, sufficient public equipment, and regular maintenance of rides; (2) service features: including adequate parking, reasonable prices, clear moving lines, good service attitude, environmental hygiene, complete interpretation of facilities; and (3) endogenous features: including peripheral stores, population gathering, guidance from local government, convenient transportation, recommendation from relatives/friend. However, asking respondents to simultaneously assess the above customer value-driven factors for the four theme parks would cause respondents distress and tend to create distortions in the assessment. We therefore employed Borda count to obtain the weight of customer value-driven factors. In order to select the key customer value-driven actors from them, this paper set a threshold value of weighting (see the black line in Figure 1) greater than 0.06, and a total of nine important customer value-driven factors were obtained, which are: (1) Theme features; (2) Novel and fun rides; (3) Exciting shows; (4) Reasonable prices; (5) Clear moving lines; (6) Excellent service attitude; (7) Environmental health; Convenient transportation; and (9) Sharing from friends/players.
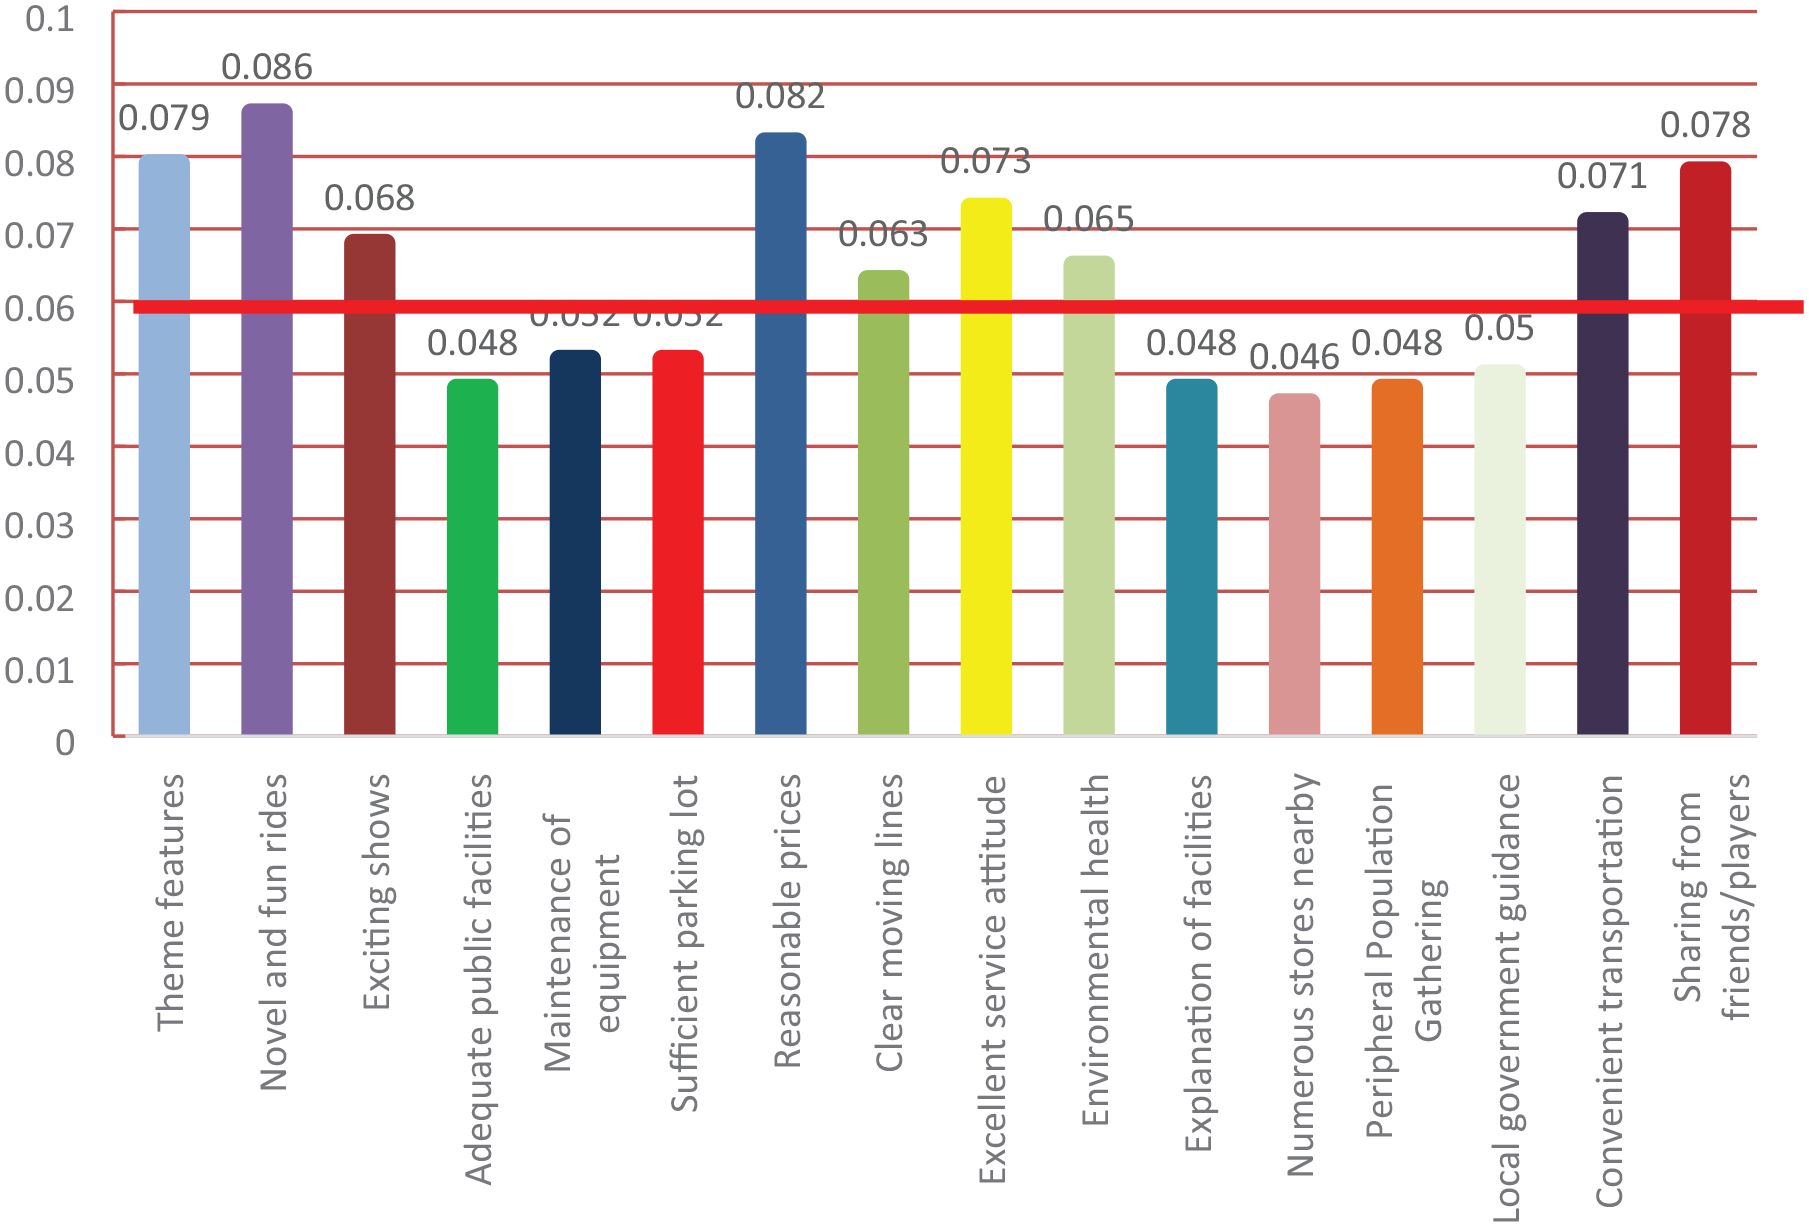
Initial weighting value of customer value-driven factors.
We noted the sum of the key weight values filtered from Figure 1 is not equal to 1. Therefore, the nine factors of Borda count were further normalized in this study. Table 1 provides the standardized weights of these nine value-driven factors. From this table, it can be seen that these nine factors fall into the three dimensions of theme characteristics, service characteristics, and exogenous characteristics, indicating that respondents pay considerable attention to these three constructs. Further, Table 1 shows that the adjusted Borda value of each factors for the theme characteristic dimension are greater than 0.1, indicating that the customer attaches great importance to this dimension. A reasonable explanation is that most consumers go to theme parks for the purpose of pursuing new and exciting things, so the theme park rides are new and fun and have thematic characteristics, respectively, including the first and third place of customer drivers. In addition, reasonable price in service characteristics and convenient transportation in external characteristics are also important factors for consumers, ranking second and fourth in importance respectively. Alternatively, among the key customer value-driven factors, the one that is less valued by consumers is clear moving lines, probably because consumers are willing to stay longer in the theme park and can enjoy the various rides without clear moving lines to guide them. Coupled with the rise of electronic tours in recent years, and the availability of staff to ask questions, clear moving lines are less important than the other eight factors.
Normalized Borda value.

Sample Structure of the Competitive Positioning Questionnaire
In our knowledge, the majority of visitors to theme parks is between the ages of 15 and 35, and generally account for about 80% of visitors to the parks. The preference of these groups is directly related to the competitive policy of the theme park. Therefore, these groups are the target of this paper. Consequently, we distributed questionnaires among individuals aged 15 to 35, encompassing those who had visited the four specified theme parks between 2013 and 2019. In this endeavor, we employed the purposive sampling method—a type of non-probability sampling characterized by its deliberate selection of samples that yield intricate, comprehensive insights. This method serves to assist researchers in addressing their research inquiries more effectively, thereby shaping the approach adopted for conducting the survey. We employed eight qualified research assistants and divided them into four teams to conduct questionnaires simultaneously in these four theme parks between July and August 2019. A total of 650 questionnaires were sent out in these four theme parks in which 398 questionnaires were collected including 42 invalid questionnaires. This indicated that 356 questionnaires were effectively collected, with a valid recovery rate of 54.77%. The demographic variables were as follows: (1) Gender: 189 females and 167 males. (2) Educational level: Most respondents had a university degree (201), accounting for 56.46%, followed by a high school degree (88), accounting for 24.72%. (3) Disposable income: mainly below $10,000 (192 people, 53.93%), followed by $10,001 to $20,000 (101 people, 28.37%) (4) Occupation: mainly students (198 people, 55.62%), followed by business and industry (82 people, 23.03%). (5) Age: the age group is mainly 19 to 22 years old and 23 to 29 years old, 138 and 112 people respectively, accounting for 38.76% and 31.46% respectively.
Sample Structure of the Competitive Positioning Questionnaire
In this subsection, we utilize the hybrid quantified SWOT analysis developed in the “Research Method” section to evaluate the competitive positioning of the theme park. The subsequent steps outline the detailed operational procedures, and the corresponding results are presented in Tables 2–5.
Step 1: Employ FGI to identify the generalized customer value-driven factors, which was described in Section “Extraction of Customer Value-Driven Factors.”
Step 2: Extract the customer value-driven factors (i.e. wi) using Borda count, which was described in Section “Questionnaire Design.”
Step 3: Classify the extracted customer value-driven factors into internal and external environment dimensions. In this study, the key customer value-driven factors obtained from Table 1 are considered as competitive indicators for theme parks, and these indicators are divided into two categories: internal and external. The internal and external indicators are judged by whether the nine factors can be controlled and improved by the operators themselves. If the factors can be managed and improved by the operator, they are classified as internal customer value-driven factors (e.g., thematic features); conversely, they are classified as external customer value-driven factors (e.g., convenient transportation). After this classification criteria, seven internal customer value- driven were obtained: (1) thematic features (2) novel and fun rides (3) exciting shows (4) reasonable price (5) clear moving lines (6) excellent service attitude (7) environmental health; and two external customer value-driven factors were obtained: (1) convenient transportation (2) sharing from friends/players.
Step 4: Identify the objects (i.e., theme parks). This paper evaluated four major theme parks in Taiwan, namely (1) Janfusun Fancy World, (2) Lihpao Resort, (3) Leafoo Village Theme Park, and (4) Formosan Aboriginal Culture Village.
Step 5: Issue questionnaires and collect data, which was described in Section “Research Method.”
Step 6: Calculate the results of the questionnaire survey and obtain the original evaluation performance, pij, as follows:
Step 7: Employ equation (1) and obtain the normalized performance values as follows:
Step 8: All the value-driven factors obtained in Step 2 were categorized into internal and external environment value-driven factors according to Step 3. We therefore normalized the weighted values
We then employed equations (2) and (3) to obtain the normalized weighted performance values for objects which are shown in below:
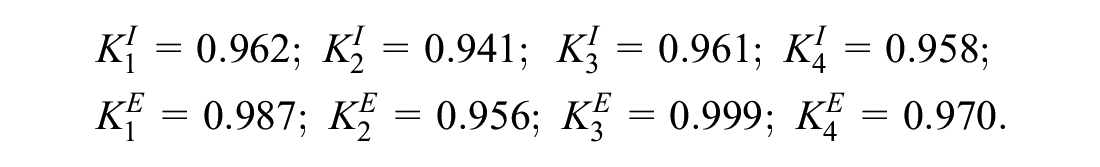
Step 9: Employ equations (4) and (5) to obtain the benchmark value for the internal and external competition evaluation indicator, respectively. The results are as follows:
ICAI = 0.955; ECAI = 0.978
Step 10: Use equations (6) and (7) to calculate the internal and external matrix coordinate values for objects, which ware shown in Table 5.
Step 11: The coordinate values for objects obtained in step 10 are labeled in the analysis matrix of SWOT. The competitive positioning of the four theme parks is shown in Figure 2. We know, from Figure 2, (1) Lihpao Resort (coordinate value SW = 0.007, OT = 0.009) is located in the first (SO) quadrant with its internal strengths and external opportunities simultaneously but it has less external opportunities compared with Leafoo Village Theme Park; (2) Formosan Aboriginal Culture Village (coordinate value SW = −0.015, OT = −0.022) is located in the third (WT) quadrant with its internal weakness and external threats, which has the worst performance compared with other theme parks in this paper; (3) Leafoo Village Theme Park (coordinate value SW = 0.005, OT = 0.021) is located in the first (SO) quadrant with its internal strengths and external opportunities, which has less internal strengths compared with Lihpao Resort; (4) Janfusun Fancy World (Coordinate SW = 0.03, OT = −0.008) is located in the fourth (TS) quadrant with its the external threats and internal strength, which was impacted by Lihpao Resort and thus its performance is not significant.
The Evaluation Performance for Objects.

Note. C1: theme features; C2: novel and fun rides (Attractions); C3: exciting show; C4: reasonable price; C5: clear moving lines; C6: excellent service attitude; C7: environmental health; C8: convenient transportation; C9: sharing from friends/players.
The Normalized Performance for Objects.

Internal and External Normalized Weighted Values.

Internal and External Coordinate Values of the Four Theme Parks.

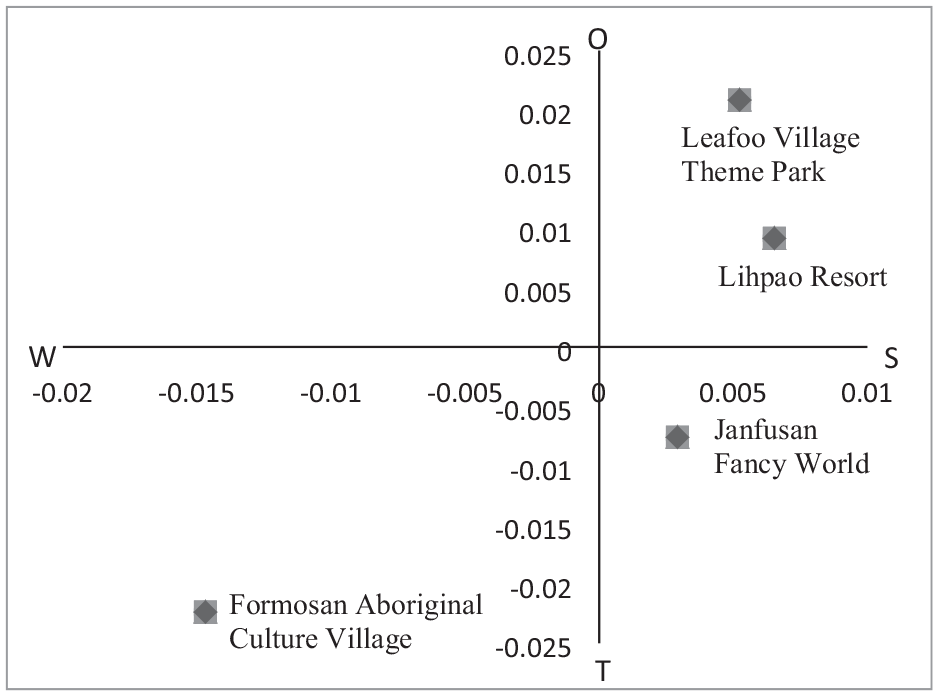
Competitive positioning of the four theme parks.
Conclusions and Suggestions
Previous similar studies in the literature of theme park focused on park customer satisfaction and service quality; however, this paper discussed the customer value-driven factors and competitive positioning of the top four theme parks, which are important issues for strengthening the competitiveness of theme parks in the micro-profit era, in Taiwan. This paper makes three contributions. First, to the best of our knowledge, it is the first study that employs a hybrid quantified SWOT analysis to leisure industry in which it can help the manager to identify the theme park competitive positioning. Second, according to a focus group interview and Borda rule, the customer value-driven factors of theme park are found, which facilities the manager focus on main key factors to allocate his/her resources for the theme parks. Third, analyzing the competitive advantages and disadvantages of theme parks and proposing improved strategies.
This paper has extracted nine customer value-driven factors: (1) Theme features; (2) Novel and fun rides; (3) Exciting shows; (4) Reasonable prices; (5) Clear moving lines; (6) Excellent service attitude; (7) Environmental health; (8) Convenient transportation; and (9) Sharing from friends/players. We found that the most important customer value-driven factor that influenced the internal facet was the novelty and fun rides, followed by a reasonable price. Alternatively, for the external facet, the top customer value-driven factor was sharing from friends/players. Another interesting finding of this paper is that the survey respondents do not place much importance on regular maintenance of the amusement facilities, with a driven value of 0.052 (not reaching the threshold value of 0.06). This particular phenomenon explains why, despite repeated reports in the national press that some amusement park areas had broken down and left visitors stranded at height for up to 10 minutes, there has been no significant drop in visitors. A reasonable explanation is that the survey respondents are mainly visitors aged 15 to 35, who focus on novelty and fun, and trust the operators to follow their maintenance schedules and to supervise the operators to maintain the rides properly. Other interesting findings regarding competitive positioning are as follows:
The Lihpao Resort is located in the first quadrant (SO), indicating that the park has strengths in its internal environment and opportunities in its external environment. Further analysis reveals that its internal strengths are mainly due to its thematic features, new and fun rides and excellent service attitude. In addition, the external strengths are mainly from the sharing of friends/players. This park is known for its innovative rides, hotels, and trendy shopping, which often attracts a large number of young people to visit and spend money. In addition, this park has a number of attractions perfect for families and it is a complex theme park with four main functions: leisure, entertainment, culture, and technology. Despite its location in the first quadrant, the park is not as dominant externally as Leafoo Village Theme Park. The main reason is that the Leafoo Village Theme Park is located in the northern part of Taiwan, which has the largest populations, and is suitable for day trips for people in the northern region. The sustainable business strategy for this park is to attract people from the southern and northern areas to stay and visit through accommodation facilities. At the same time, it is necessary to strengthen the uniqueness of the facilities to make a proper distinction from Janfusan Fancy World.
The Formosan Aboriginal Culture Village is a large recreational area consisting of three main parts: the European Palace Garden, the Joy World, and the Formosan Aboriginal Mountain culture. In addition to free-fall and Mayan adventure facilities, there is also an aerial cable car that connects the Village with Sun Moon Lake. It is one of the few amusement parks in Taiwan to feature the aboriginal people of Taiwan as its theme, and to showcase their unique architecture and handicrafts in a lifelike format. The park was assessed to be in the third (WT) quadrant, showing no clear external opportunities or internal strengths, and the worst performance of the four theme parks. We also noted that after the park opened the aerial cable car between the Formosan Aboriginal Culture Village and Sun Moon Lake at the end of 2009, the number of visitors entering the park has increased significantly, as has the internal competitive advantage, and it is clear that the park’s marketing strategy of “overlooking the lakeside of Sun Moon Lake” has been successful in attracting consumers. However, the relatively small number and novelty of rides, coupled with heavy traffic jams especially in holiday and lack of strong sharing from friends/players, has led to a year-on-year decline in visitor numbers from 2013 to 2018. The sustainable business strategy for this park is to use the unique culture of the Formosan aboriginal culture with various festivals of the aborigines, combined with the government’s promotion and sponsorship to attract tourists. At the same time, this park should implement the discounted entrance ticket price in conjunction with the events held by Sun Moon Lake National Administration and request the government to actively improve the transportation network.
The Leafoo Village Theme Park is located in the first quadrant, showing that it has clear external opportunities and less internal advantages. Its external strengths come from its accessibility and the fact that it is a large theme park in northern Taiwan; however, its internal strengths are clearly not more prominent than the competitive advantages of Lihpao Resort. Although the Leaf Village theme park was once known as the first fantasy park in Asia to combine a zoo with a large amusement park, it has become less competitive as new amusement park facilities have become more innovative and more accessible. In addition to more than 30 exciting rides for youngsters and a safari park designed for families and children, the park also hosts regular shows with music, water shows, and large parades. Despite the park’s strengths in terms of excellent shows and service attitude, these two factors are not the most important factors of concern for visitors. It is also the most expensive of the four parks, and the previous practice of allowing vehicles into the wildlife park to observe or interact with the wildlife up close has been replaced by a tour bus, reducing the excitement and themed atmosphere resulting in a much less competitive edge for the park. The sustainable business strategy for this park is to consider opening a wildlife park and a cute zoo area separately, so that visitors can observe or get close to non-aggressive wild animals, which could be a unique niche for the park. Of course, the amusement facilities keep up with the trend of the times is also an important part of the park’s perpetual survival.
The Janfusun Fancy World is located in the fourth quadrant (TS), showing fewer external threats and fewer internal strengths. This park is one of the famous mega-amusement parks in Taiwan, known for its high-value hardware facilities, high-quality software services, high-experience contextual shows, and high human added value. However, the park’s lack of the inconvenient access to this park is its biggest drawback, causing the park to fall into the fourth quadrant. This also shows that if the park’s transportation can be improved, coupled with internal advantages such as taking advantage of the park’s outstanding thematic features and new and fun rides, it will have a highly competitive edge to escape the threat of its competitors, which is the sustainable business strategy for this park.
We are aware that in an era of rising consumer awareness, a customer-focused marketing model is the key to sustainable business survival. In other words, the clever use of marketing strategies will create benefits for customers, increase customer value and enhance the competitiveness of the theme park area. This paper provides a methodology to find out the customer value-driven factors and identify the competitive position of the theme park. This paper also identified the key factors that need to be improved by each park, which is a useful reference for park operators to strengthen their competitive advantage.
The limitation of this study comes from the data collection in a single period of time in Taiwan, that is, summer vacation, thus limiting the generalization of the findings. In order to improve external validity, collecting a more comprehensive sample from different time periods is essential for future studies. Moreover, replication of this study to compare whether there are differences in customer value-driven factors and evaluating competitive positioning across cultures is an interesting line of further research.
Footnotes
Acknowledgements
The authors sincerely thank the anonymous referees for their very helpful comments and for the improvement of the paper.
Declaration of Conflicting Interests
The author declared no potential conflicts of interest with respect to the research, authorship, and/or publication of this article.
Funding
The author disclosed receipt of the following financial support for the research, authorship, and/or publication of this article: This research was supported by the Science Foundation of the Fujian Province of PRC under Grant FJ2022MJDZ027 and the Sanming University of PRC under Grant 20YG03S.
Ethics statement
It is not applicable.
Data Availability Statement
Data sharing not applicable to this article as no datasets were generated or analyzed during the current study.