
Abstract
In previous studies, problem solving appraisal has been identified as playing a key role in promoting positive psychological well-being. The Problem Solving Inventory is the most widely used measure of problem solving appraisal and consists of 32 items. The length of the instrument, however, may limit its applicability to large-scale surveys consisting of several instruments. This study investigated the possibility of reducing the number of items in the inventory using item response theory. We used the automated item selection procedure in Mokken analysis which identified 12 items as unscalable or loading on a separate scale or violating invariant item ordering. Rasch analysis, Mokken analysis, and classical test theory were then used to investigate the psychometric properties of the shorter version of the instrument. The results supported the reliability, validity, and dimensionality of the three subscales in the shortened version. The shortened version of the Problem Solving Inventory (PSI-20) and its subscales had very strong relationships with the original scale and its subscales, and the correlation of the total scale and the subscales of the shortened version with related variables was very similar to the relationships that the original scale and the subscales had with those same variables. The PSI-20 is thus beneficial in identifying changes in metacognition related to problem solving ability and can provide a basis for further intervention.
Plain Language Summary
We used three different statistical methods to derive a shorter version of the three dimensions of the Problem Solving Inventory, namely problem solving confidence, approach-avoidance style, and personal control. We derived a 20-item version and the three methods confirmed that the three dimensions have sound psychometric properties that compared favorably to the original 32-item version. The results suggest that the proposed short form (PSI-20) is user-friendly, easy to administer and score, and consists of three parsimonious dimensions. The shortened version makes self-reporting less arduous and can provide potentially useful information to inform interventions for common mental health disorders.
Keywords
Applied problem solving and how people cope with stressful life events has been the focus of inquiry for many years in psychology (e.g., Gagne, 1964; Köhler, 1925; Skinner, 1974). People typically face a myriad of challenges, ranging from daily hassles to major life events, spanning an array of ever-changing life situations. More importantly, people respond to their personal problems in different ways and, notably, with different levels of effectiveness. Some people rely on a broad array of internal (e.g., self-efficacy) and external resources (e.g., social support networks) to effectively cope with their problems, while others may act impulsively, resulting in disappointing consequences. Over the years, a great deal of research has examined how people cope with a variety of daily stressors and, more importantly, how their coping affects their psychological adjustment, career satisfaction, and overall well-being (e.g., Folkman & Moskowitz, 2004; Heppner et al., 2004; Somerfield & McCrae, 2000).
Antonovsky (1987), as well as Butler and Meichenbaum (1981), suggested that an individual’s self-appraisal of their coping or problem solving skills may positively or negatively affect their ability to cope with various stressful life events. In alignment with this conceptualization, Heppner and Petersen (1982) developed the Problem Solving Inventory (PSI), which assesses one’s perceived effectiveness in applied problem solving; the subsequent PSI literature confirmed Butler and Meichenbaum’s hypothesis that one’s problem solving appraisal indeed plays a critical role in how one reacts to and attempts to solve a broad array of stressful life events. Twenty-five years later, Heppner and colleagues (2004) reviewed more than 120 PSI articles across 20 years (1982–2002). They concluded that “problem solving appraisal, as measured by the PSI, is a useful psychological construct with implications for theory and many applications to build on people’s strengths to enhance their life satisfaction and well-being” (p. 344).
Folkman and Lazarus (1984), in their theory on stress and coping, underscored the seminal role of cognitive appraisals in facilitating coping in response to stressful life events. Cognitive appraisals include primary and secondary appraisals. Primary appraisals focus on the immediate perception of a stressor in relation to the individual’s well-being, whereas secondary appraisals involve a metacognitive process that considers the availability of intrinsic and extrinsic resources, as the individual assesses their ability to cope with and manage the stressor (Chen et al., 2022). Existing research (e.g., Freire et al., 2020) focusing on self-efficacy has highlighted the salience of adaptive secondary appraisals in facilitating coping. Self-efficacy related beliefs enable people to interpret stressors as manageable challenges and help them to feel a sense of confidence in tackling potentially difficult tasks or situations. The individual’s beliefs in their abilities affects their emotional responses and the behaviors that they engage in to cope with stress (Freire et al., 2020). The construct of problem solving appraisal (Heppner & Petersen, 1982) is similarly emblematic of secondary appraisal processes that can influence responses to stressors and coping ability.
Since its development in 1982 (Heppner & Petersen, 1982) and its subsequent revision in 1988 (Heppner, 1988), the PSI has consistently demonstrated sound psychometric properties in a variety of cultural contexts (see Heppner et al., 2019 for a review). In more recent studies, the psychometric properties of the PSI have been confirmed in several countries, such as Singapore (Teo et al., 2021) and Turkey (Micoogullari et al., 2018). However, evidence for the sound psychometric properties of the PSI has largely been based on classical test theory (CTT). We could only find one study that employed item response theory (IRT: Rasch analysis); however, it was used to analyze an adapted online version of the PSI (Che Lah et al., 2023). Since the theoretical assumptions of CTT and IRT are different, in theory, it makes sense to use them in a complementary fashion.
In the current study, we investigated the possibility of reducing the number of items in the inventory using item response theory. A potential short form of the PSI has several benefits including increasing response rate, minimizing the probability of response errors, improving generalization and is less resource intensive. We used Mokken analysis to derive unidimensional measures of the three subscales of the PSI and then examined the psychometric properties of the three dimensions of problem solving appraisal using three different approaches: CTT, Rasch (a parametric IRT), and Mokken analysis (a non-parametric IRT). In general, utilizing these three approaches in a single study allows for a more nuanced overview of the psychometric properties of an instrument (Meijer et al., 1990). On one hand, CTT analysis computes a score for problem solving appraisal and offers a global view of the respondents’ problem solving appraisal. On the other hand, the Rasch and Mokken analyses identify items that are more likely to be endorsed by respondents with different levels of problem solving appraisals (Meijer et al., 1990). This enables the compilation of more precise respondent profiles, which are important in targeted interventions (Zamora-Araya et al., 2018). Rasch analyses offers a means of examining item bias, contributions of individual items in the scale to the overall construct and invariance across sample groups. Rasch analyses, in essence, considers how much each item on a scale contributes to the overall latent trait being measured (i.e., problem solving appraisal) and lead to more meaningful modifications of the scale to enhance its overall psychometric properties (Pretorius et al., 2021). CTT does not separate item difficulty and therefore cannot estimate the contribution of each item to the overall latent construct. Mokken analyses supplements the Rasch method. It is typically applied as a secondary analysis approach and its major advantage is that it relaxes some of the strong assumptions about the non-linear behavior of response probabilities that are invoked by Rasch models (Pretorius et al. 2021). Lastly, CTT indices, such as reliability, are more sample dependent and may vary across samples, while IRT indices are more stable across different samples (Yang & Kao, 2014).
We also assessed the criterion-related validity of the short form of the PSI (PSI-20) by establishing the relationship between sense of coherence, resilience, depression, as well as PTSD and the shortened PSI. It was expected that the PSI would be negatively related to resilience and sense of coherence (high scores on the PSI reflect perceptions of ineffective problem solving), as these have been identified in the literature as protective factors, playing a similar role to problem solving appraisal with regard to mental health. It was further expected that the PSI would be positively related to negative mental health indices of depression and PTSD, as there has been a vast body of research that has demonstrated this positive relationship between problem solving appraisal and psychological well-being (for a review, see Heppner et al., 2004).
Methods
Participants
Participants were a random sample (5.13% margin of error, 95% confidence interval) of students (n = 322) at a metropolitan university in the Western Cape Province, South Africa. The majority of the sample lived in an urban area (87.3%) and were women (77%). The mean age of the sample was 26 years (SD = 10.2). The study was conducted during the COVID-19 pandemic (March to July 2022), and respondents were asked about their lived experiences during this time. At least a quarter of the sample (25.5%) had contracted COVID-19, 40.7% had lost a family member as a result of COVID-19, and 80.1% knew people that had contracted COVID-19.
Measures
Participants completed the PSI, the Sense of Coherence Scale (SOC-13; Antonovsky, 1987), the Connor-Davidson Resilience Scale-10 (CD-RISC-10; Campbell-Sills & Stein, 2007), the 10-item version of the Center for Epidemiological Studies Depression Scale (CES-D10; W. Zhang et al., 2012), and the Posttraumatic Stress Disorder Checklist for DSM-5 (PCL-5; Blevins et al., 2015). In addition, they completed a brief demographic questionnaire.
The PSI consists of 32 items that assess participants’ appraisal of themselves as problem solvers. In this regard, it is therefore not a measure of actual problem solving skills but of their perceptions of their own problem solving abilities. Participants responded to the items of the PSI on a 6-point scale that ranges from 1 (strongly agree) to 6 (strongly disagree). The PSI is scored in such a way that high scores indicate appraisal of oneself as an ineffective problem solver. The PSI consists of three subscales: Problem Solving Confidence (PSC, 11 items; e.g., “Many of the problems I face are too complex for me to solve”), Approach-Avoidance Style (AAS, 16 items; e.g., “When a solution to a problem has failed, I do not examine why it didn’t work”), and Personal Control (PC, 5 items; e.g., “When my first efforts to solve a problem failed, I become uneasy about my ability to handle the situation”). PSC assesses individuals’ level of confidence and faith in their problem solving ability, while AAS examines their propensity to approach or avoid problem solving tasks and PC evaluates individuals’ beliefs about whether they are in control of their emotions and behaviors when solving problems. As mentioned, the PSI has generally demonstrated sound reliability, and the evidence for the factor structure and validity is comprehensive (for a review, see Heppner et al., 2019). The PSI has also previously been used with South African students (Heppner et al., 2002; Pretorius & Diedricks, 1994; Pretorius, 1996); in all three studies, reliability estimates have exceeded .80. In the current study the reliability of the PSI, PSC, AAS, and PC was .88, .85, .84, and .71, respectively.
The SOC-13 consists of 13 items that assess individuals’ ability to utilize intrinsic and extrinsic resources to manage stressors and maintain health. This scale is comprised of three subscales: meaningfulness (4 items), comprehensibility (5 items), and manageability (4 items). Only the total score was used in the current study. One sample item of the SOC-13 is: “Do you have the feeling that you are in an unfamiliar situation and don’t know what to do?” In this study, participants responded to the items of the SOC-13 using a 7-point scale. The total score on the SOC-13 ranges between 13 and 91, with higher scores reflecting a strong sense of coherence. The reliability estimates for this scale have been reported to range from α = .70 to .92 (Paika et al., 2017). The SOC-13 has also been used in South Africa with samples of teachers (Padmanabhanunni, Pretorius, & Kagee, 2022) and students (Padmanabhanunni & Pretorius, 2022); in both of these studies, alpha and omega coefficients of .81 were reported. In the current study the Cronbach’s alpha of the SOC-13 was .83.
The CD-RISC-10 is a shortened version of the original CD-RISC, which consisted of 25 items and was developed to measure resilience (Connor & Davidson, 2003). Participants responded to the 10 items of the CD-RISC using a 5-point Likert-type scale that ranges from 0 (not true at all) to 4 (true nearly all of the time). One example of its items is: “I can deal with whatever comes my way.” Higher scores indicate higher levels of resilience. Reliability coefficients for the CD-RISC-10 have generally exceeded .80 (e.g., Campbell-Sills & Stein, 2007: α = .85; Cheng et al., 2020: α = .90; Rezaeipandari et al., 2022: α = .89). The CD-RISC-10 has been used with teachers in South Africa (Padmanabhanunni, Pretorius, Bouchard et al., 2022), and alpha and omega coefficients of .95 were reported in that study. In the current study the Cronbach’s alpha of the CD-RISC-10 was .90.
The CES-D10 is a short version of the original 20-item CES-D (Radloff, 1977) to screen for depression. A sample item of the CES-D is: “I felt that everything I did was an effort.” Responses to the CES-D range from 0 (rarely or none of the time) to 3 (all of the time). The total score ranges between 0 and 30, with higher scores reflecting higher levels of depression. The reliability coefficients for this scale have been reported to be satisfactory (e.g., Mueses-Marín et al., 2019: α = .92; Williams et al., 2020: α = .86) The CES-D10 has also been used with different language groups (Zulu, Afrikaans, and Xhosa) in South Africa, and reliability coefficients have ranged between .69 and .89 for these language groups (Baron et al., 2017). In the current study the Cronbach’s alpha of the CES-D10 was .84.
The PCL-5 is one of the most widely used measures of PTSD symptoms and is aligned with the DSM-5. It consists of 20 items that are scored on a 5-point scale that ranges from 0 (not at all) to 4 (extremely). The instructions for completing the PCL states “below is a list of problems that people sometimes have in response to a very stressful experience” and the 20 items of the PCL-5 then relates to this stressful experience. A sample item from the PCL-5 is: “How much have you been bothered by repeated, disturbing, and unwanted memories of the stressful experience?” The PCL-5 consists of four subscales—namely, Re-Experiencing, Avoidance, Negative Alterations in Cognition and Mood, and Hyper Arousal. Only the total PCL-5 score was used in this study. Higher scores on the PCL-5 indicate more severe posttraumatic stress disorder (PTSD). In the original development study, strong reliability (α = .94) and evidence for convergent and discriminant validity were reported (Blevins et al., 2015). More recent studies have reported similarly strong estimates of internal consistency (e.g., Morrison et al., 2021: α = .94; Orovou et al., 2021: α = .97). The PCL-5 has also been used in several studies in South Africa, and similar satisfactory reliability coefficients were reported (e.g., Makhubela, 2018: α = .95; Padmanabhanunni & Wiid, 2022: α = .93). In the current study the Cronbach’s alpha of the PCL-5 was .94.
Procedure
We used Google Forms to create an online version of the various instruments. The registrar of the university used an algorithm to select a random sample of 1,500 students. The online link stayed active for a period of 3 months. Our sample of 322 students therefore represents a response rate of 21.5%.
Ethics
The study was conducted in accordance with the Declaration of Helsinki. We received ethical clearance from the Humanities and Social Sciences Ethics Committee of the University of the Western Cape (ethics reference number: HS22/2/9, February, 2022). Participants had to provide informed consent on the landing page of the electronic link. Participation was voluntary and anonymous.
Data Analysis
CTT analysis was conducted with IBM SPSS Statistics version 26 for Windows (IBM Corp., Armonk, NY, USA), while Rasch analysis was performed using Winsteps version 5.1.4 (Linacre, 2021a) and Mokken analysis was conducted with R (R Core Team, 2017), using the “Mokken” package (van der Ark, 2007, 2012).
Mokken Analysis
We first used the automated item selection procedure (AISP) in Mokken analysis to identify items that contributed to a unidimensional scale in each of the three subscales. AISP provides an indication of whether an item is scalable or whether there are groupings of items that constitute separate dimensions (Mokken, 2011).
A Mokken analysis also provides an indication of whether items are able to discriminate between high and low scorers on a latent variable (called monotonicity) and whether there are items that respondents with the same level of a latent variable might have endorsed in significantly different ways (referred to as invariant item ordering, or IIO; Sijtsma & van der Ark, 2017). Violations of the assumptions of monotonicity and IIO are flagged by a statistical index called a Crit value. Molenaar and Sijtsma (2000) suggested that a Crit value for both monotonicity and IIO > 80 would be indicative of serious violations, while values between 40 and 80 represent minor violations that can be acceptable. Mokken analysis also provides an indication of the strength of a scale, called a scalability coefficient (H), as well as scalability coefficients for each item (Hi). With respect to Hi, Mokken (2011) indicated that Hi coefficients > .30 reflect items that contribute to the measurement of the latent variable. With regard to the H coefficient for the total scale, Wind (2017) proposed the following rule of thumb: H ≥ .50 represents a strong scale, .40 ≤ H < .50 represents a medium scale, and H < .40 represents a weak scale. Finally, Mokken analysis provides a reliability coefficient similar to the Cronbach’s alpha that is referred to as Mokken scale reliability (MSrho). Items were thus discarded based on AISP, violations of monotonicity and IIO, and Hi.
Rasch Analysis
The remaining items in each of the subscales were then subjected to Rasch and CTT analysis. An advantage of Rasch analysis is that it provides both person-related indices (person separation index and reliability) as well item-related indices (item separation index and reliability). Linacre (2021b) suggested that a person separation index of >2 along with a person reliability of >.80 would indicate that the items are able to discriminate between high and low scorers on a latent trait. Furthermore, an item separation index of >3 along with an item reliability of >0.80 would indicate the existence of an item difficulty hierarchy. Rasch analysis also provides fit statistics—called infit and outfit mean square (MnSq)—for each item that indicate how accurately the data fit the Rasch model. Linacre (2021b) recommended that infit and outfit MnSq values between 0.5 and 1.5 be regarded as indicators of good fit.
Finally, principal component analysis (PCA) of the residuals (after the latent trait has been removed) were conducted to examine whether one dimension underlies each of the subscales. If the eigenvalue of the “first contrast” (i.e., a possible second dimension) >2, the scale is regarded as multidimensional.
Classical Test Theory Analysis
In the CTT analysis, the following indices were considered: reliability (Cronbach’s alpha), composite reliability (CR,), maximum shared variance (MSV), average shared variance (ASV), average variance extracted (AVE), factor loadings obtained through exploratory factor analysis (EFA: principal components), inter-item correlations, item-total correlations, and standard error of measurement (SEM). AVE reflects the amount of variance in the latent construct that is explained by the items that contribute to its measurement. MSV is the amount of variance shared by the latent construct with the construct that it has the highest correlation with, while ASV is the amount of variance shared by the latent construct with all variables it is correlated with.
In addition to the above analysis, sense of coherence, resilience, depression, and PTSD were included to assess criterion-related validity (i.e., the extent to which it is positively correlated with similar constructs and negatively correlated with contrasting variables) by establishing the relationship between related variables and the PSI-20.
Results
The items identified by AISP in Mokken analysis as unscalable or loading on a separate scale, as well as those items violating IIO, are presented in Table 1. In the PSC subscale, 3 items violated IIO, and 2 items loaded on a separate scale. In the AAS subscale, 3 items were unscalable, and 3 items did not load on the primary scale. In the PC subscale, 1 item was unscalable. In total, 12 items were thus discarded.
Unscalable Items, Items Loading on a Separate Scale as Identified by AISP, and Items Violating Invariant Item Ordering.

Unscalable items.
Items loading on a separate scale.
Items violating IIO.
The remaining 20 items were then evaluated using CTT, Rasch, and Mokken analysis. The inter-item correlations and indices for the remaining 6 items of the PSC subscale are presented in Table 2. All of the inter-item correlations, the factor loadings, and the item-total correlations were significant. The infit and outfit MnSq values ranged between 0.71 and 1.28 and were thus within the bounds of 0.5 and 1.5. All of the Hi coefficients were above .30, and the Crit values for monotonicity and IIO were <80.
Inter-Item Correlations and Item-Level Indices for the Short Form of the Problem Solving Confidence Subscale.

Note. Item intercorrelations below the diagonal. PSC = problem solving confidence.
Scalability coefficient of individual items.
p < .001.
The inter-item correlations and indices for the remaining 4 items of the PC subscale are presented in Table 3. As can be noted in Table 3, all the inter-item correlations, factor loadings, and item-total correlations were significant. The infit and outfit MnSq values were within an acceptable range and ranged between 0.77 and 1.14. All the Hi coefficients were >.30, and the Crit values of monotonicity and IIO were <80.
Inter-Item Correlations and Item-Level Indices for the Short Form of the Personal Control Subscale of the Problem Solving Inventory.
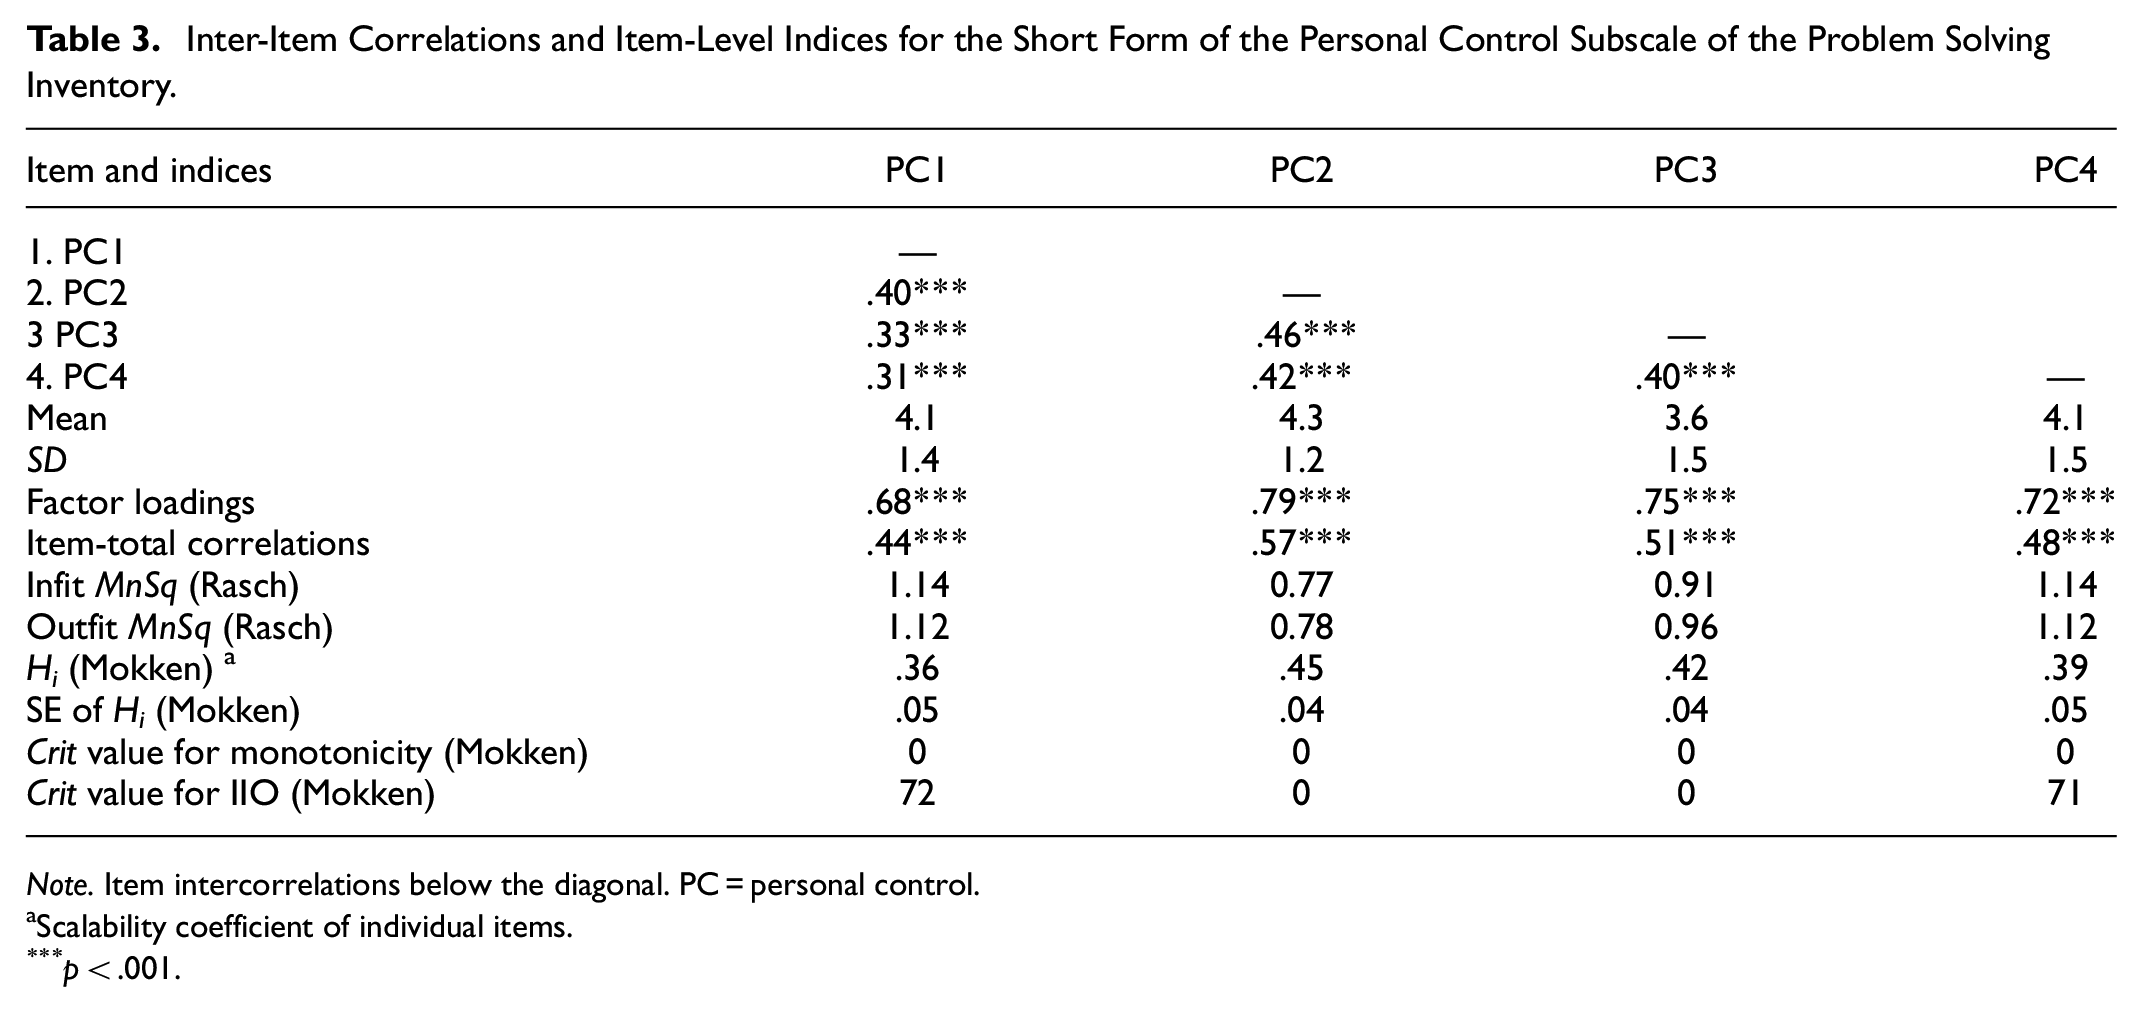
Note. Item intercorrelations below the diagonal. PC = personal control.
Scalability coefficient of individual items.
p < .001.
The inter-item correlations and item-level indices for the remaining 10 items of the AAS subscale are presented in Table 4. All the inter-item correlations, factor loadings, and item-total correlations were significant. The infit and outfit MnSq values ranged between 0.79 and 1.47 and were thus acceptable. All of the Hi coefficients were >.30, and the Crit values for monotonicity and IIO were <80.
Inter-Item Correlations and Item-Level Indices for the Short Form of the Approach-Avoidance Style Subscale of the Problem Solving Inventory.

Note. Item intercorrelations below the diagonal. AAS = approach-avoidance style.
Scalability coefficient of individual items.
p < .001.
The CTT, Rasch, and Mokken indices for the three subscales of the PSI at the scale level are presented in Table 5. All the indices of reliability (Cronbach’s alpha, CR, and MSrho) were >.70. The AVE was acceptable for the PSC and the PC subscales but was low for the AAS subscale. In all instances, AVE was >MSV and ASV. Item indices in the Rasch analysis (reliability and separation index) were acceptable for all three subscales. Similarly, person indices (reliability and separation index) were acceptable in the case of the PSC and the Approach-Avoidance subscales but did not meet the acceptable levels of reliability >.7 and separation >2 in the case of PC. This would indicate that the items of the PC subscale do not effectively discriminate between those who perceive themselves to have a high level of PC while problem solving and those who perceive themselves to have a low level of PC. The PCA of the residuals after the Rasch model was excluded resulted in a second dimension with an eigenvalue <2 for all three subscales, indicating that the three subscales are unidimensional. Lastly, the H coefficient at scale level indicated a strong, medium, and weak scale for the PSC, PC, and AAS subscales, respectively.
Indices for the Short Form of the PSI Subscales.

Eigenvalue of the first contrast.
The intercorrelations between the short form of the subscales and the total PSI, as well as variables that the PSI and the subscales are expected to be associated with, are reported in Table 6. First, as can be seen in Table 6, the relationship between the original PSI total, on the one hand, and the PSC, the AAS and the PC (r = 0.73 to 0.89, p < .001), on the other hand, were similar to that of the PSI-20 and its subscales (r = 0.62 to 0.91, p < .001). In all instances, Fisher’s Z-test indicated there were no significant differences between the sets of coefficients. Second, the short forms of the subscales were highly correlated with the original version of the PSI (r = 0.93 to 0.97, p < .001). Third, the original total PSI and the subscales had very similar—and in some instances the same—correlations to the total PSI-20 and the subscales with the variables that are also regarded as protective factors in the expected negative direction—namely, sense of coherence (r = −0.35 to 0.59, p < .001) and resilience (r = −0.37 to −0.59, p < .001). In all instances, Fisher’s Z-test indicated no significant differences between the coefficients. Fourth, the original PSI had similar relationships with indices of psychological distress and in the expected direction as the PSI-20 – depression (PSI original: r = 0.27 to 0.52, p < .001; PSI-20: r = 0.24 to 0.50), and PTSD (PSI original: r = 0.29 to 0.51, p < .001; PSI-20: r = 0.27 to 0.48). Fisher’s Z-test indicated that there were no significant differences between the coefficients.
Correlations Between the Short Form of the Problem Solving Inventory and Original 35-item Version as well as Related Variables.

Note. PSI = problem solving inventory; PSC = problem solving confidence; AAS = approach-avoidance style; PC = personal control; SOC = sense of coherence; PTSD = posttraumatic stress disorder.
p < .001.

Finally, we evaluated the reliability of the total PSI-20 using both Cronbach’s alpha and McDonald’s omega because concerns about coefficient alpha underestimating true reliability in multi-item measurement scales have been expressed (Deng & Chan, 2017; Hayes & Coutts, 2020). Both alpha and omega values were found to be .88, which constituted favorable results compared to the original PSI (α = .89).
Discussion
Problem-solving appraisal plays a central role in determining coping responses and psychological wellbeing (Heppner et al., 2004; Pretorius & Padmanabhanunni, 2023). Individuals who appraise themselves as deficient in problem solving ability are more likely to experience heightened levels of distress and adverse psychological outcomes. Positive appraisals of problem solving ability can enhance critical and creative thinking and confidence in one’s ability to negotiate life stressors (Pretorius & Padmanabhanunni, 2023). Given the salience of cognitive appraisals of problem-solving ability in promoting adaptation to stress, developing valid and reliable instruments to assess for this construct may be beneficial for intervention efforts. The aim of this study was to examine the possibility of developing a short form of the PSI.
There are several advantages to constructing such a brief instrument. First, a short form is likely to increase the response rate and minimize the number of response errors, thus enhancing the generalizability and validity of its findings. Second, lengthy questionnaires tend to be biased in favor of those who are interested in the study and have the time to complete it. When a questionnaire is appraised as “too long,” it can adversely impact on the response rate and quality of the responses given due to fatigue or loss of interest (He et al., 2021; Lev-Ari et al., 2021). A brief questionnaire could improve the response rate and be more appealing to a diverse sample. Third, brief instruments are less resource intensive whereas lengthy questionnaires may contribute to greater monetary cost, particularly if researchers utilize electronic platforms for data collection (Botes et al., 2021; Lev-Ari et al., 2021).
We used AISP in Mokken analysis to identify items that were not scalable, loaded on separate scales, or violated the assumptions of monotonicity and IIO for each of the PSI subscales. Through this approach, we discarded 12 items and retained 20 items. The PSI-20 was then evaluated with Rasch, Mokken, and CTT analyses. Each of these approaches has its own strengths and limitations; thus, combining them provides a more comprehensive picture of the psychometric properties of an instrument (Meijer et al., 1990).
All reliability indices (Cronbach’s alpha, CR, and MSrho) for the PSI-20 and its subscales exceeded the conventional indicator for satisfactory reliability. They also indicated more favorable results than the original PSI and its subscales. The construct validity (i.e., the extent to which the scale measures the construct it purports to measure) of the various subscales of the PSI-20 was supported by the significant item-total correlations (Hajjar, 2018) and the Hi coefficients, which were above .30 (Mokken, 1971), indicating that all items contributed to the measurement of the latent variable. Small and non-significant item-total correlations provide evidence that these items do not contribute to the measurement of the underlying latent construct (Field, 2005). The inter-item correlations were significant but moderate in all instances. It has been suggested that inter-item correlations should ideally be between 0.15 and 0.85 and that inter-item correlations greater than 0.85 indicate redundancy of items, while coefficients lower than 0.15 may indicate that items do not have much in common (Paulsen & BrckaLorenz, 2017). The inter-item coefficients ranged between 0.39 and0.58 for the PSC, between 0.31 and 0.46 for the PC, and between 0.21 and 0.56 for the AAS. Further evidence for construct validity was provided by the person and item indices, infit and outfit MnSq values (Rasch analysis), as well as monotonicity and IIO (Mokken analysis).
For all the subscales, item indices in Rasch exceeded the suggested cutoff, indicating that an item difficulty hierarchy exists. For PSC and AAS, there was evidence that the items in these subscales are able to effectively discriminate between high and low performers in terms of problem solving appraisal (person indices in Rasch analysis and monotonicity in Mokken analysis). For the PC subscale, the Rasch person indices failed to meet the conventional cutoff, suggesting that the items in this subscale cannot distinguish between high and low scorers. However, the less restrictive non-parametric Mokken analysis results for monotonicity confirmed that the items are able to make such a distinction between high and low scorers. For all items in the three subscales, the infit and outfit MnSq values were within the proposed range (Linacre, 2021b), thus indicating that the data fit the Rasch model.
The results of the three approaches also provided evidence for convergent validity (i.e., if the items converge and have a high proportion of variance in common). Posch et al. (2019) indicated that significant factor loadings and an AVE less than CR is evidence of convergent validity. For the three subscales, all of the factor loadings were significant, and, in all instances, AVE < CR. In terms of discriminant validity (i.e., the degree to which a construct is distinct from other constructs), one might expect the latent construct to have more in common with the items that contribute to its measurement than it has in common with related variables (Almén et al., 2018). In terms of the results obtained, AVE > both MSV and ASV, thus providing evidence for the discriminant validity of the subscales.
While the AVE for the AAS was < .50, and the H coefficient indicated that AAS and PC were weak and moderate scales, respectively, the subscales were significantly related to sense of coherence, resilience, depression, and PTSD, all in the expected direction. This provides evidence for the PSI-20’s criterion-related validity. The PSI-20 and its subscales had very strong correlations with the original PSI and its subscales. Finally, EFA, a PCA of the residuals in Rasch analysis, and AISP in Mokken analysis all confirmed that all subscales were unidimensional.
The PSI-20 provides an economical means of assessing appraisals of problem solving ability. Problem solving is an emotion regulation strategy that entails modifying one’s appraisals of a situation to alter its emotional impact (Visted et al., 2018). Deficits in perceived problem solving ability have been identified as a salient predictor of depression, hopelessness, and suicidal ideation (Chu et al., 2018). Confidence in one’s ability to solve problems is associated with improved life satisfaction and reduced vulnerability to adverse mental health outcomes (A. Zhang et al., 2018). The PSI-20 can potentially be used within clinical settings, where it could identify deficits in appraisals of problem solving ability that may potentially underlie mental health challenges. Targeted interventions, such as problem solving therapy (PST), could then be incorporated into the treatment approach.
PST is a cognitive-behavioral treatment premised on the idea that problem solving is an important mediator and moderator of the association between adverse life events and psychological outcomes (A. Zhang et al., 2018). Meta-analytic studies (e.g., Malouff et al., 2007; A. Zhang et al., 2018) on the effectiveness of PST have concluded that such an approach is more effective when a problem orientation component is incorporated in the intervention than when it is not. Problem orientation is a metacognitive process that includes appraisals of one’s problem solving ability. The PSI-20 would be beneficial in identifying changes in meta-cognition related to problem solving ability and this could facilitate more targeted intervention efforts.
Limitations
This study had certain limitations. First, although the survey was anonymous, which should theoretically encourage disclosure, the potential impact of self-reporting bias still needs to be acknowledged (Tsipropoulou et al., 2020). Second, the study used a cross-sectional survey design and respondents were university educated, which may have implications for the generalizability of the findings. Third, the majority of participants in the sample were women and there is some evidence to suggest gender differences in appraisals of problem solving ability. For example, Wismath and Zhong (2014) in a study of gender differences in perceptions of and confidence in problem solving ability among university students found that women appraised themselves as lower in these aspects. Gender differences may therefore have a bearing on the findings of the current study and further research using a more diverse sample is warranted. Fourth, it is probable that the short-form scale demonstrated a strong correlation with the original scale due to similarity in content. This needs to be carefully considered in interpreting the findings of the study. Fifth, we have validated the PSI against a small subset of measures and this can have a bearing on the findings of our study. Finally, the sample size in the study is relatively small, but sample sizes above 300 are regarded as having adequate statistical power for analytic purposes (Kyriazos, 2018).
Conclusion
The study examined the possibility of developing a short form of the PSI. The results suggest that the proposed short form (PSI-20) is user-friendly, easy to administer and score, and consists of three parsimonious dimensions. The total and subscale scores correlated strongly with the 32-item PSI, and the central features of the scale are preserved. The proposed shortened version of the PSI (PSI-20) makes self-reporting less arduous and can provide potentially useful information to inform interventions for common mental health disorders.
Footnotes
Declaration of Conflicting Interests
The author(s) declared no potential conflicts of interest with respect to the research, authorship, and/or publication of this article.
Funding
The author(s) disclosed receipt of the following financial support for the research, authorship, and/or publication of this article: This research was funded by the South African Medical Research Council (SIR grant).
Data Availability
The data sets generated and/or analyzed during the current study are available from the corresponding author upon reasonable request.