
Abstract
Understanding education and schooling has always been of great importance for researchers and for the society in digital era. The changing conditions and ever-growing situations in education have also impacted on the meaning that the students attribute to schools, especially after the pandemic. This study aims to develop a measurement tool that will provide information about the meaning of school for high school students and make comparisons on the basis of some sociodemographic variables using this tool. About 6,453 students studying in various types of high schools participated in the research. The data were randomly divided into two data files. Exploratory factor analysis, Item response theory analysis, and reliability analyses (Cronbach’s Alpha and McDonald’s omega) were performed to determine the construct validity of the scale from the first data file created with 1,940 high school students. Confirmatory factor analysis was used to confirm the structure from the second data file created by 1,898 high school students. From the total data file, analyses were conducted with students’ gender, grades, school type, the field of study/major, mother and father’s level of education, and family income. The results reveal that most of the students attribute a positive meaning to the school in condition that they are female and study in early grades. In addition, if they are not successful enough, if they were not provided quality education in science, if their parents’ education level and family income is low, they have positive views about school.
Keywords
Introduction
How can we uncover the meaning of “school” within the context of 21st century education? Is every student who attend schools’ formal education process provided with quality education? Does it really mean that these individuals are educated? Do we still need the institutionalized form of schools? This question and many others may imply that the meaning attributed to school has been changing. Therefore, schools and the formal education served at schools has always been at the forefront of academic debate and an important concern for the society, and the definition of schools has been transformed by the changing social, political, economic, and cultural perspectives in time. Although the common sense of “school” is the idea that it is the place which provides students with technical skills, a sense of civic responsibility, personal development, mental and physical health, cultural awareness, etc. (Austin et al., 2005), the meaning of school cannot be constructed before describing what is meant by “education.”
Although it is very hard to make a onefold definition for education due to its complexity in society, economy, and politics of the 21st century, in the literature, education is mentioned to have two main purposes. For example, Kemmis and Edwards-Groves (2018) state that education has a double purpose: (1) to form and develop individuals with the knowledge, capabilities, and character to live good lives, (2) to form and develop good societies, in which the good for humankind is the principal value. These purposes are also related to two Latin roots of the term “education”: educare and educere. Educare is designed to familiarize individuals with the existing system, and the basic requirement of the curriculum is to provide them with a diploma, certificate, or a degree so that they can perform a particular profession (Billington, 2003). Similarly, Bass and Good (2004) state that educare aims to make individuals a copy of their parents by using existing knowledge, to train rote learners and create good workers for the society they live in. Educere, on the other hand, aims to create a new generation who question, inquire, and create solutions to unknown problems and keep up with the changes and challenges to be faced in the future. In this approach, the individuals discover the world by developing new ideas and necessary skills, and they make this discovery not for any pragmatic reasons, but because they find these ideas and skills valuable (Billington, 2003).
The above-mentioned descriptions of education including the purposes within educare and educere reveal the fact that education is a complex term, and we should construct the meaning by considering social, economic, and political perspectives. In addition, we believe that education and its stated purposes requires a philosophical explanation in terms of schooling. To do this, we can start with the history of schooling. Although it is uncertain when the first schools were formed, we can state that they existed by about 600 BC in ancient Greece—more than 2700 years ago (Kemmis & Edwards-Groves, 2018).
Although schools came into existence to serve educational purposes for individuals and societies, they have also evolved through history serving different kinds of purposes for individuals and societies. Janak (2019) states that schooling had military, religious, philosophical, political, and social purposes. As can be seen in Table 1, schooling started with the aim of military education, and the Ancient Greek schools of philosophy were founded to raise intellectual society. In those years, education at schools were for the wealthy elite class; that is to say, the schools excluded the children of poor families (Kemmis & Edwards-Groves, 2018). With the rise of schools in towns, schools started to serve more people, and between the middle of the 19th century and its end, the schools turned into institutions to serve elementary education for all citizens. Considering all these purposes, we can state that schools are designed to transform individuals and societies. That is to say, it is clear that schools do not only serve educational values, but also, they are forced to serve other values imposed on them by the bureaucracy and those in power for policymaking. Another issue about schooling and education is the idea that the students do not need to be educated at schools physically as a consequence of the facilities provided by Internet and Communication Technologies (ICT). For example, some researchers argue that the schooling model has no future in the digital age as a result of the opportunities offered by digitalization, online learning, remote teaching, and other digital technologies (Tawil & Locatelli, 2015). Similarly, Nóvoa and Alvim (2020) state that the future of education and current school models should be rethought to respond the needs of the society as emerging trends in digitalization of education have led to personalization of learning especially after the pandemic and thus disintegration of the school. In this respect, it would be worth discussing the meaning of “school” again after the pandemic period. This paper aims to develop a measurement tool that will provide information about the meaning attributed to school by high school students and make comparisons on the basis of some sociodemographic variables using this tool. It should be noted that this scale will be the first measurement tool developed to investigate what meaning is attributed to school by high school students. Following are the research questions:
Some Stages in the History of Schooling.

Note. Reprinted from Understanding Education: History, Politics and Practice (p. 36), by Kemmis and Edwards-Groves (2018), Springer (https://doi.org/10.1007/978-981-10-6433-3).
What is the validity and reliability level of the “Meaning of Schools Scale (MoSS)” based on the Classical Test Theory (CTT) and Item Response Theory (IRT)?
What is the “meaning” attributed to the school by high school students within the framework of the data obtained from across Turkey?
Does the meaning of school differ according to their gender, grade, school type, fields of study/majors, parents’ education levels, and family income?
Method
Scale development is a complex and systematic process that requires theoretical and methodological rigor, and this process can be carried out in three basic steps (Morgado et al., 2017): (1) “item generation” to create an item pool, (2) “theoretical analysis,” in which the researcher assesses the content validity of the new scale, and (3) “psychometric analysis” in which the researcher assesses if the new scale has construct validity and reliability. Construct validity can be assessed with the use of EFA or CFA. Our study adopts a similar approach in designing the “Meaning of School Scale (MoSS).”
Measurement tools can be developed using different theories. CTT is one of the widely used test development theory across the world as it has the easiest and most practical process. Of course, CTT is not without any limitations. To illustrate, the psychometric properties of a tool developed based on CTT depend on the group which the tool is applied to. Furthermore, only one standard error value can be obtained for a whole group in the measurement tools developed using CTT. On the other hand, in IRT, item parameters are independent of the respondent group, and group characteristics are independent of the item sample (Embretson & Reise, 2000). Also, Hambleton et al. (1991) states that a unique standard error estimation is possible for each participant when IRT is used.
Participants
The study was carried out on a large scale. According to the publication entitled “National Education Statistics (2020-2021)” by the Ministry of National Education (MoNE) Turkey every year, the total number of high school students is 6,318,602 (3,316,001 (52%) male, 3,002,601 (48%) female) (Ministry of National Education [MoNE], 2021, p. 136). This includes both public and private schools, and all high school types.
This study was conducted with the approval of Çanakkale Onsekiz Mart University Scientific Research Ethics Committee (Date of Approval: 04.11.2021/No:19/29). And, to implement the measurement tool in all provinces of Turkey, the research application permission was obtained from Ministry of National Education, Directorate of Strategy Development (Date: 06.12.2021/No: E-49614598-605.01-38390991). The research was conducted with 6,453 high school students from 40 provinces. The majority of high school students are from greater cities (e.g., Istanbul, Ankara, Izmir, Bursa, Adana). These students constitute 74% of the total participants.
Some sociodemographic characteristics of the participants (gender, class, school type, and education area, etc.) were examined. The number of female student participants (60.3%) is higher than male students. While 48% of high school students in the Turkish population are female, 60.3% of the total participants in our study were female. In this sense, although the proportion of the population could not be fully achieved in the participants, a high number of participants were reached to represent the society. In Turkey, the participation of female students is higher in studies conducted with the principle of voluntary participation, especially at high school and university level (Bass & Good, 2004, p. 132). The highest participation rate was from 9th, 10th, and 11th grade students, and the majority of the students (73.7%) study at Anatolian High Schools. The majority of the participants’ fathers and mothers are primary school graduates (Mother (42.8%), Father (39.2%)). The family income of the students is mostly 5,000 TL and below.
The data of 6,453 high school students were split by random division method. Approximately 30% of the whole data (1,940 high school students) were taken by random division. This data set was used for exploratory factor analysis (EFA), Cronbach’s Alpha, McDonald’s reliability coefficient omega, IRT analysis. Approximately 30% of the whole data (data of 1,898 high school students) were obtained by random division. The second data set was also used for confirmatory factor analysis (CFA). As Hair et al. (2014) stated, EFA results should be validated in a split sample from the original dataset or in a separate sample obtained with a new application.
Comparative analyses of the meaning that high school students attribute to school according to their gender, grade, school type, field of study/major, mother and father’s level of education, and family income were carried out with the whole data set (6,453 high school students).
Preparing the Draft of “Meaning of School Scale (MoSS)” Before Implementation
The draft form of the “Meaning of School Scale (MoSS)” was prepared by following the steps:
Determine the purpose of the scale: The aim is to determine the meaning that high school students attribute to “school.”
Decide on the item type: 5-Point Likert type was used (strongly disagree, disagree, partially agree, agree, and strongly agree). There are studies which show that 5-point Likert structure works well (Aybek & Toraman, 2022).
Conduct a literature review, create an item pool: The school, the semantic change of the “school” over time, the school as a social institution in the sociology of education, the response of the school to the social expectations, the literature about the school from the perspectives of critical pedagogy and candidate items were constructed.
Get expert opinion on the candidate item pool: The scale candidate item pool was presented to two experts from the field of sociology of education and one expert from the field of measurement and evaluation. The items that the experts found appropriate were included in the trial form, and the items that were deemed unsuitable were removed from the form.
Make a redaction: Redaction was taken from an expert with expertise in Turkish Language to ensure language eligibility.
By following these steps, a draft form which consists of 25 items was obtained. In the draft form, there were five negative items about the meaning of school.
Procedure
The research was conducted through the following steps:
The draft form of the Meaning of School Scale (MoSS) was prepared.
The research application permission was obtained from Ministry of National Education, Directorate of Strategy Development (Date: 06.12.2021/No: E-49614598-605.01-38390991).
Consent forms for research participation and the scale was prepared on Google Forms to make the application hybrid (face-to-face and online). The researchers visited some of the cities in Turkey where the scale was applied face-to-face. In some other cities of Turkey, the scale was carried out online via Google Forms link which was sent to school administrators.
The data from online and face-to-face applications were combined.
The validity of the scale was tested with item-total correlations based on CTT, construct validity within the scope of factor analysis, and CFA. In addition, for validity, item discrimination and item difficulty level, item characteristic curves, item and test information functions were tested based on IRT.
Reliability of the scale was analyzed with Cronbach’s Alpha internal consistency coefficient, McDonald’s composite reliability coefficient, and Marginal Reliability coefficients.
Data Analysis
About 7125 high school students participated in the study. However, the data of 672 high school students was extracted from the data set as almost half of the items of the scale were not answered by the participants. The data of the remaining 6,453 high school students were transferred to JAMOVI and R statistical software. Multivariate normal distribution analysis was carried out using the “Henze-Zirkler,”“Mardia,” and “Doornik-Hansen” methods for 25 items with the R, “mvn” package (Korkmaz et al., 2014). In factor analysis, the Kaiser-Meyer-Olkin test (KMO) provides a measure of sampling adequacy by comparing the sizes of the correlation coefficients with the sizes of the partial correlation coefficients (Pett et al., 2003). An indicator of the strength of the relationship between the items is the partial correlation coefficient. Partial correlations represent the correlations between each pair of items after removing the linear effects of all other items (Hair et al., 2014; Pett et al., 2003). KMO value above 0.90 “excellent,” 0.80 to 0.90 “good,” 0.70 to 0.80 “acceptable,” 0.60 to 0.70 “moderate,” 0.50 to 0.60 “low level,” and below 0.50 is considered “unacceptable” (Kaiser & Rice, 1974). According to Field (2018), the KMO value should be at least 0.50. Otherwise, more data should be collected or which variables to include should be reconsidered. A correlation matrix with an identity matrix (the matrix with 1 diagonal and 0 other elements) is not preferred in factor analysis. In such a matrix, there is no reciprocal relationship between the items (all correlation coefficients are close to 0). It is the unit matrix of the data tested with Bartlett’s Test of Sphericity. In Bartlett’s test of sphericity, H0 hypothesis is tested to see whether the correlation matrix is a unit matrix (i.e., there is no relationship between the items). A significant Bartlett test result means the rejection of the H0 hypothesis (Field, 2018; Pett et al., 2003). However, the Bartlett test is highly affected by the sample size, and the “p” value in large samples is almost always significant (Field, 2018; Hair et al., 2014).
In this study, factor analysis was carried out using the “Principal Axis Factoring (PAF)” method. PAF performs the analysis by focusing on shared variance, not on sources of error specific to individual measurements. PAF, which is used more in social and behavioral science studies, models the shared variance in a series of X measures (Warner, 2013). The reference value of “Eigenvalue” was accepted as “1” in determining the number of EFA factors. Factors with eigenvalues greater than 1 are considered significant in determining latent roots. How much of the total variance of the feature desired to be measured is explained by means of the scale is an important in EFA. As a result of factor analysis, a structure is obtained. There are different views about how much of the variance of the factor structure should explain the feature of interest (the meaning of the school in this study). According to Hair et al. (2014), in social sciences where information is generally less certain, a solution that meets 60% (and in some cases even less) of the total variance is satisfactory. Similarly, Warner (2013) states that the acceptable limits should be between 40% and 70%. The minimum values expected for factor loading values in the interpretation of the factor structure are between ±0.30 and ±0.40. ±0.50 is a significant factor load value. ±0.70 and above is an indicator of a well-defined structure (Hair et al., 2014). Cronbach’s Alpha, McDonald’s Omega, and Marginal Confidence coefficients were used to determine the reliability level of the scale. According to Nunnally and Bernstein (1994), sufficient reliability should be at least 0.70 and above.
It is necessary to examine the assumptions of unidimensionality and local independence in validity and reliability test with IRT (Zhao, 2008). Unidimensionality requires that individuals have a characteristic (the related items of the assessment tool are for only one characteristic) that affect the performance of individuals in the assessment tool (Hambleton et al., 1991). Unidimensionality is tested using the item correlation matrix or EFA. In this study, unidimensionality was tested using EFA. As described in the Findings section, the “Meaning of School Scale (MoSS)” has three sub-dimensions according to EFA results. In this case, each factor was considered as a separate dimension and IRT analyses were performed in this way. The local independence assumption was tested using the Q3 statistic (Yen, 1993), and IRT calibrations were made with the multidimensional item response theory (Mirt) “Mirt v.1.30” (Chalmers, 2012) package program. In item response theory (IRT), the discrimination value of an ideal item (i.e., parameter “a”) should be between 0.5 and 2. In the literature, the range of this parameter between 0.75 and 2.50 indicates that it is acceptable (Flannery et al., 1995). The ideal (medium difficulty level) limits for item difficulty levels (i.e., the “b” parameter) are considered to be between −1.00 and 1.00 (Hambleton, 1994). In ability or achievement tests, items with a difficulty level less than −1.00 and the items over 1.00 are considered easy. The item information function is a graphical representation that shows the range of the characteristic (the characteristic to be measured in the scale) by which the item best distinguishes the individuals who the measurement tool is applied to (Edelen & Reeve, 2007). It shows the level of information about the characteristic of the test information function measurement tool as a whole (Hambleton et al., 1991).
In this study, comparative analyses were conducted regarding the meaning that students attribute to school according to their gender, grade, school type, field of study/major at high school, mother and father’s level of education, and family income. In these analyses, the normal distribution of the scores obtained from the scale and comparison analyses were conducted with parametric techniques without examining the homogeneity of variance as the data set is very large and data was obtained from high school students to represent Turkey. In large samples, the skewness does not deviate significantly from normal. Positive kurtosis starts to disappear in samples larger than 100 and negative kurtosis starts to disappear in samples larger than 200 (Tabachnick & Fidell, 2013). While interpreting the results of the comparison analysis, the effect size was calculated. The significant differences are affected by the amount of difference between the scores and the size of the group (n). Effect helps you to comment on the significant difference that occurs by considering the amount of difference and group size. In the interpretation of the significant difference, the limits suggested by Cohen (1988) for eta-square (η2) (small effect size ≥0.01; medium effect size ≥0.06; large effect size ≥0.14) were considered.
Results
CTT Validity Evidence of the “Meaning of School Scale (MoSS)”
The normal distribution of 25 items of the scale was examined in all data set of 6,453 high school students, EFA data set of 1,940 high school students and CFA data set of 1,898 high school students. As a result of multivariate normal distribution analysis with R, “mvn” package, “Henze-Zirkler,”“Mardia,” and “Doornik-Hansen” methods, multivariate normal distribution could not be obtained (p < .05).
The KMO value, which tests the convenience of the data set for factor analysis through the sizes of the partial correlation coefficients, was examined. The KMO value for the EFA data set consisting of 1,940 high school students’ data was found 0.95. Ba’tlett’s Test of Sphericity value, which examines whether the correlation matrix obtained in the factor analysis shows the unit matrix (identity matrix) characteristic, was 17,561, and the result was found to be significant (df = 120, p < .05). As explained in the data analysis section, the fact that the KMO value is above 0.90 indicates that the partial correlation coefficients regarding the inter-item correlation strength are at an excellent level. The partial correlation coefficients calculated between the item pairs by controlling the linear effects of the other items in the scale are at an excellent level. The fact that the Bartlett test result is a significant value as in our analysis shows that the data set we used in factor analysis does not form a unit matrix. The unit matrix is not a suitable matrix for factor analysis. According to the findings obtained, the data set is a suitable data set for factor analysis.
Principal axis factoring (PAF) is used for EFA factor analysis. In the EFA data set, item total correlation values and factor analysis initial load values were examined according to the data of 25 items. Nine items (1, 2, 8, 10, 12, 13, 22, 24, and 25) with initial, extraction, and item total correlation values below .30 were extracted from the scale. Initial, extraction, and item total correlation values of the remaining 16 items of the scale were found to be between .32 and .75. As mentioned in the data analysis section, these values are within the ranges suggested by the literature for “EFA.”“Eigenvalue” and Scree Plot analysis were performed to determine how many factorial structures the scale had with the remaining 16 items. It was determined that there were three factors with a value above 1 according to their eigenvalue values. Three factors together explain 57.8% of the characteristic of interest (meaning of school). As explained in the data analysis section, this value is a value accepted by the literature. The Scree Plot obtained from the MoSS in the analysis also confirms the three-factor structure (Figure 1).
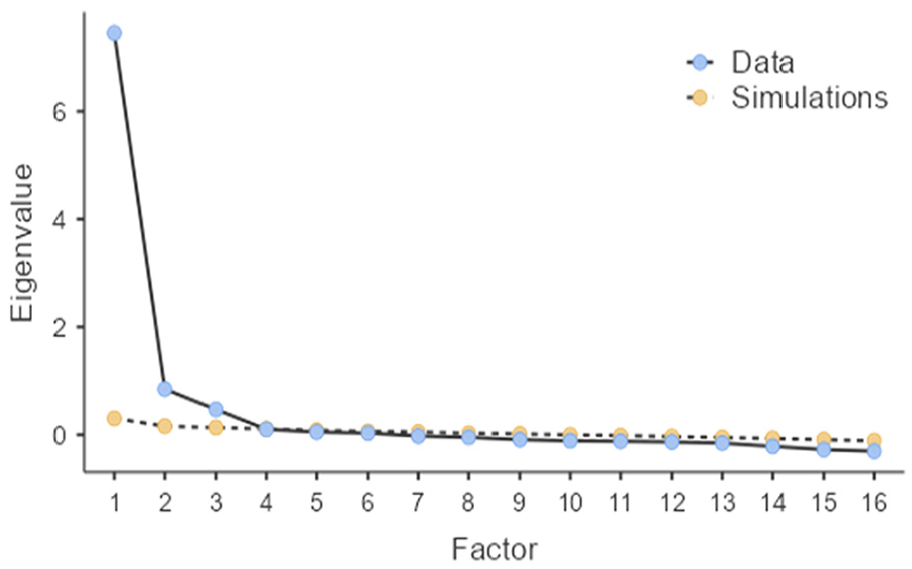
Scree plot obtained from MoSS data in EFA.
The scree plot reveals that MoSS has three factors (with three factors with eigenvalue above 1). In line with these results, it was determined that the scale has a three-factor structure. Axis rotation was performed to determine the factor in which the remaining 16 items in the MoSS were included. Since it was determined that the three factors were related to each other, Oblimin rotation, which is the oblique rotation method, was performed. As a result of the process, the items under the factors are shown in Table 2.
Factors After Oblimin Rotation and the Items in the Factors.

Reverse item.
It was determined that nine items were under factor 1, four items under factor 2, and three items under factor 3. It was also found that the factor loading values after rotation are between 0.39 and 0.77. The Pearson correlation coefficients between the remaining items in the scale and the three sub-factors of the scale are given in Table 3.
The Correlation Coefficients Between the Remaining Items in the Scale and the Three Sub-Factors of the Scale (Pearson Correlation).

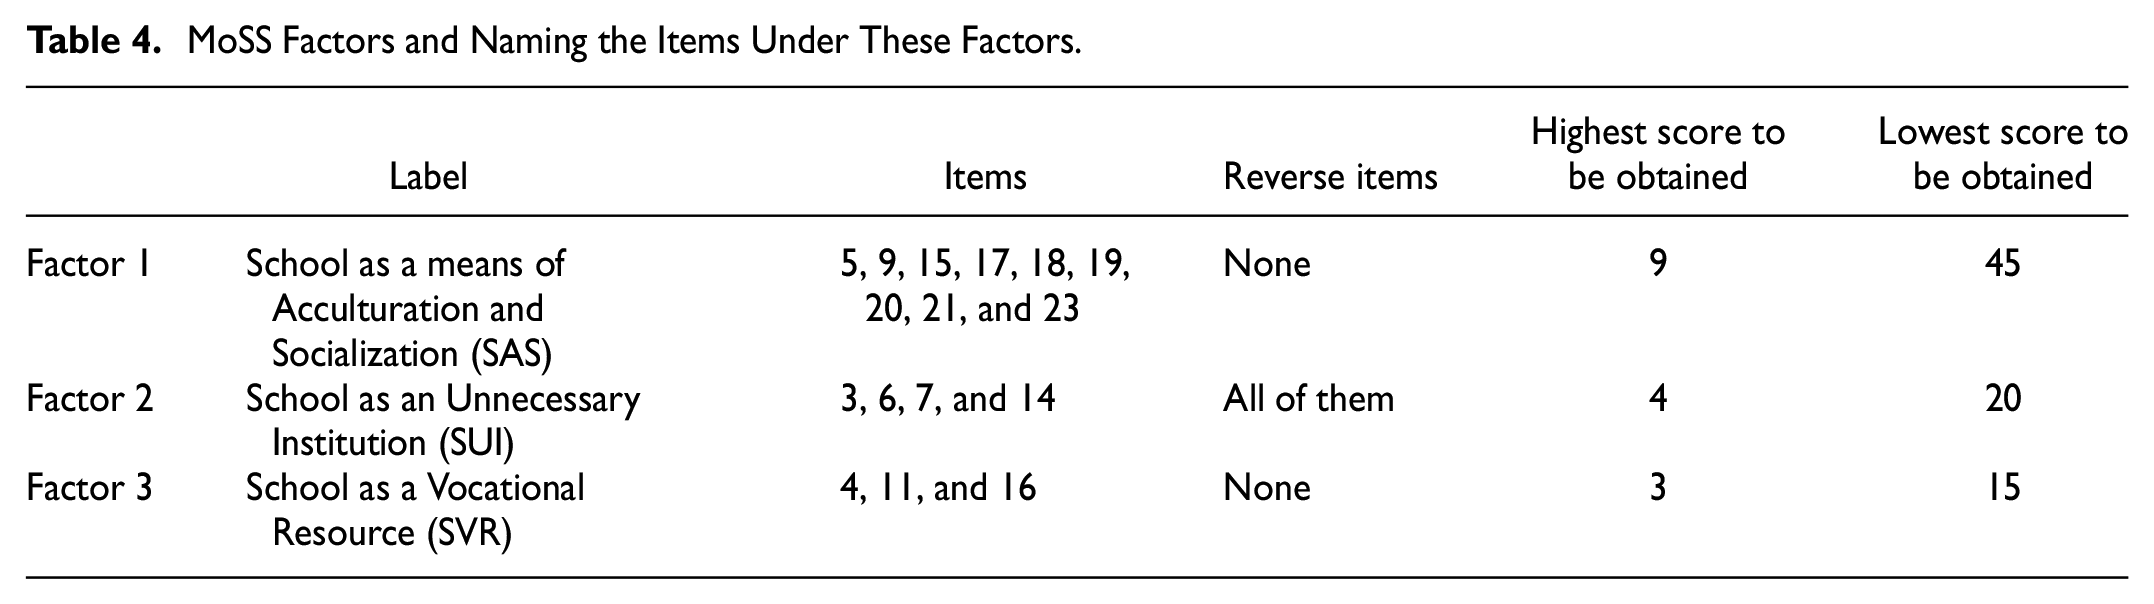
The inter-item correlation values in the SAS sub-factor were .389, the inter-item correlation values in the SUI sub-factor were .609, and the inter-item correlation values in the SVR sub-factor did not fall below .372. Correlation values between scale sub-factors did not fall below .510. While the correlation value between SAS and SVR sub-factors was positive, the correlation values between SAS and SUI, SVR and SUI showed negative correlation. The reason for this is that the items in the SUI sub-dimension have negative significance. Green and Salkind (2005), Pallant (2016), and Rumsey (2022) accept the correlation value between .300 and .490 as medium level correlation. The correlation values calculated between the scale items are the values corresponding to the medium and high correlation values. The items under the factors were examined and the factors were labeled (Table 4).
MoSS Factors and Naming the Items Under These Factors.
Confirmation of MoSS’s Factor Structure
As a result of the analyses so far, the three-factor structure of the MoSS, which consists of 16 items in the Likert type, was discovered. The confirmation of this structure was analyzed by CFA. The data set of 1,898 high school students were used for CFA analysis. As a result of CFA, fit indexes were found to be CFI = 0.96, TLI = 0.95, SRMR = 0.04, RMSEA = 0.06. As explained in the data analysis section, the three-factor structure obtained in the EFA was confirmed according to these values.
Reliability Level of the MoSS
MoSS’s reliability level was examined with Cronbach’s Alpha and McDonald’s Omega coefficients. Sixteen items were subjected to separate reliability analyses as a single factor scale and in the form of three factors (Table 5).
MoSS’s Cronbach’s Alpha and McDonald’s Omega Reliability Level.
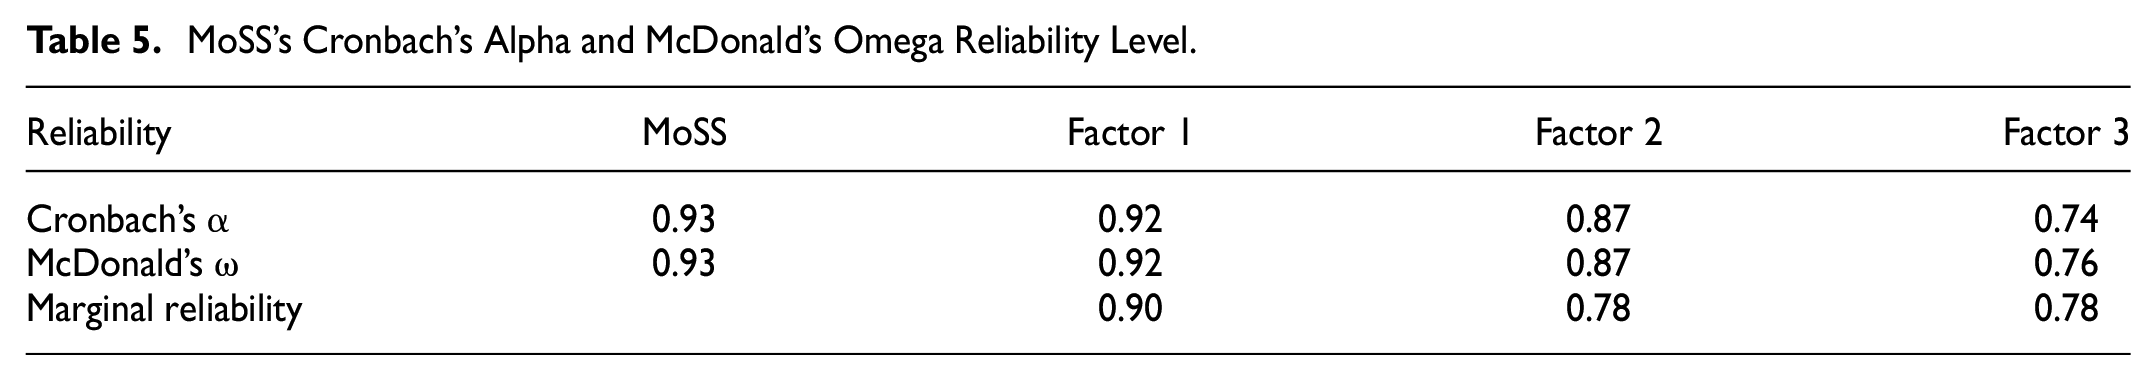
The values obtained as a result of the examinations of the MoSS’s reliability level are 0.70 and above. According to Nunnally and Bernstein (1994), satisfactory reliability should be at least 0.70 and above.
IRT Validity Evidence of the MoSS
IRT analyses were performed with the EFA data set of 1,940 high school students. Item calibrations in IRT were performed with the Generalized Partial Credit Model (GPCM). S_χ2, (degree of freedom), RMSEA, and level of significance statistics of the items according to GPCM were obtained.
The boundary value for RMSEA, which is one of the important fit indices in IRT, is 0.08, and six of this value indicates the concordance of items (Strout, 1990). According to the item concordance statistics the RMSEA values of all the items are less than 0.04 in SAS factor. Based on this result, it was determined that nine items of SAS provided model fit according to GPCM. The RMSEA values of all items are less than 0.06 in SUI factor. It was determined that four items of the School as an Unnecessary Institution (SUI) provided model fit according to the GPCM. The RMSEA values of all items are less than 0.05 in SVR factor. It was decided that three items of the SVR provided a model fit according to the GPCM.
An ideal scale item’s discrimination value (i.e., parameter “a”) in IRT should be between 0.5 and 2. It is stated in the literature that this parameter should be between 0.75 and 2.50. According to this information, almost all of the nine items of SAS are at the ideal level. The “a” parameter of nine items under the SAS factor ranged between 0.71 and 2.34. Estimates made according to the GPCM (LogLikelihood, p < .05) prove the concordance of the measurement tool items. All of the four items of the SUI are ideal in terms of discrimination level. The “a” parameter of the four items under the SUI factor ranged between 1.37 and 2.26. Estimates made according to the GPCM (LogLikelihood, p < .05) prove the consistency of the items in the measurement tool. Almost all three items of SVR are at the ideal discrimination level. The “a” parameter of the three items under the SVR factor varies between 0.80 and 3.02. Estimates made according to the GPCM (LogLikelihood, p < .05) prove the consistency of the items in the measurement tool. Item characteristic curves and item information functions of 16 items in MoSS are given in Supplemental Appendix 1.
For the SAS Factor
Item characteristic curves show that items 19, 20, 21, and 23 work well with their options in the response set. The “disagree” option in Items 5, 9, 15, and 17 did not work well. Item 18 worked in almost three options. The item information function is a graphical representation that shows the range of characteristics (the characteristics to be measured in the scale) by which the item best distinguishes the individuals (Edelen & Reeve, 2007). In the item information function, the higher the peak of the curve, the more informative the items are. When the item information functions of the SAS items are examined, the items that provide the most information are 17, 19, 20, 21, and 23. Compared to other items, the ones that inform less are 5, 9, 15, and 18. The least informative item is 18. The test information function is shown in Supplemental Appendices 1 and 2.
For the SUI Factor
Item characteristic curves reveal that the “disagree” option of items 3, 6, 7, and 14 does not work well. The items worked as if they had a four-choice response set. When the item information functions of the SUI items are examined, the most informative items are 6, 7, and 14. The item that gives relatively less information compared to other items is 3. The test information function is shown in Supplemental Appendices 1 and 2.
For the SVR Factor
The item characteristic curves show that only item 11 works ideally with its options. Items 4 and 16 worked like an item with a three-choice response set. When the item information functions of SVR are examined, the most informative items are 11. Items 4 and 16 are less informative than item 11. The test information function is shown in Supplemental Appendices 1 and 2.
The Meaning of School According to the Sociodemographic Variables of the Students
The validity and reliability analyses showed that “The Meaning of School Scale (MoSS)” has 3 factors and 16 items. After this stage, the whole data set (data of 6,453 high school students) was returned. In the data set, considering the 16 items of MoSS, total scores were obtained in three factors. On the basis of the sociodemographic variables of the students, the meaning they attribute to the school was compared. Since the amount of data in the data set is very high and as explained in the data analysis section, comparative analyses were performed with parametric techniques.
The Meaning of School to High School Students
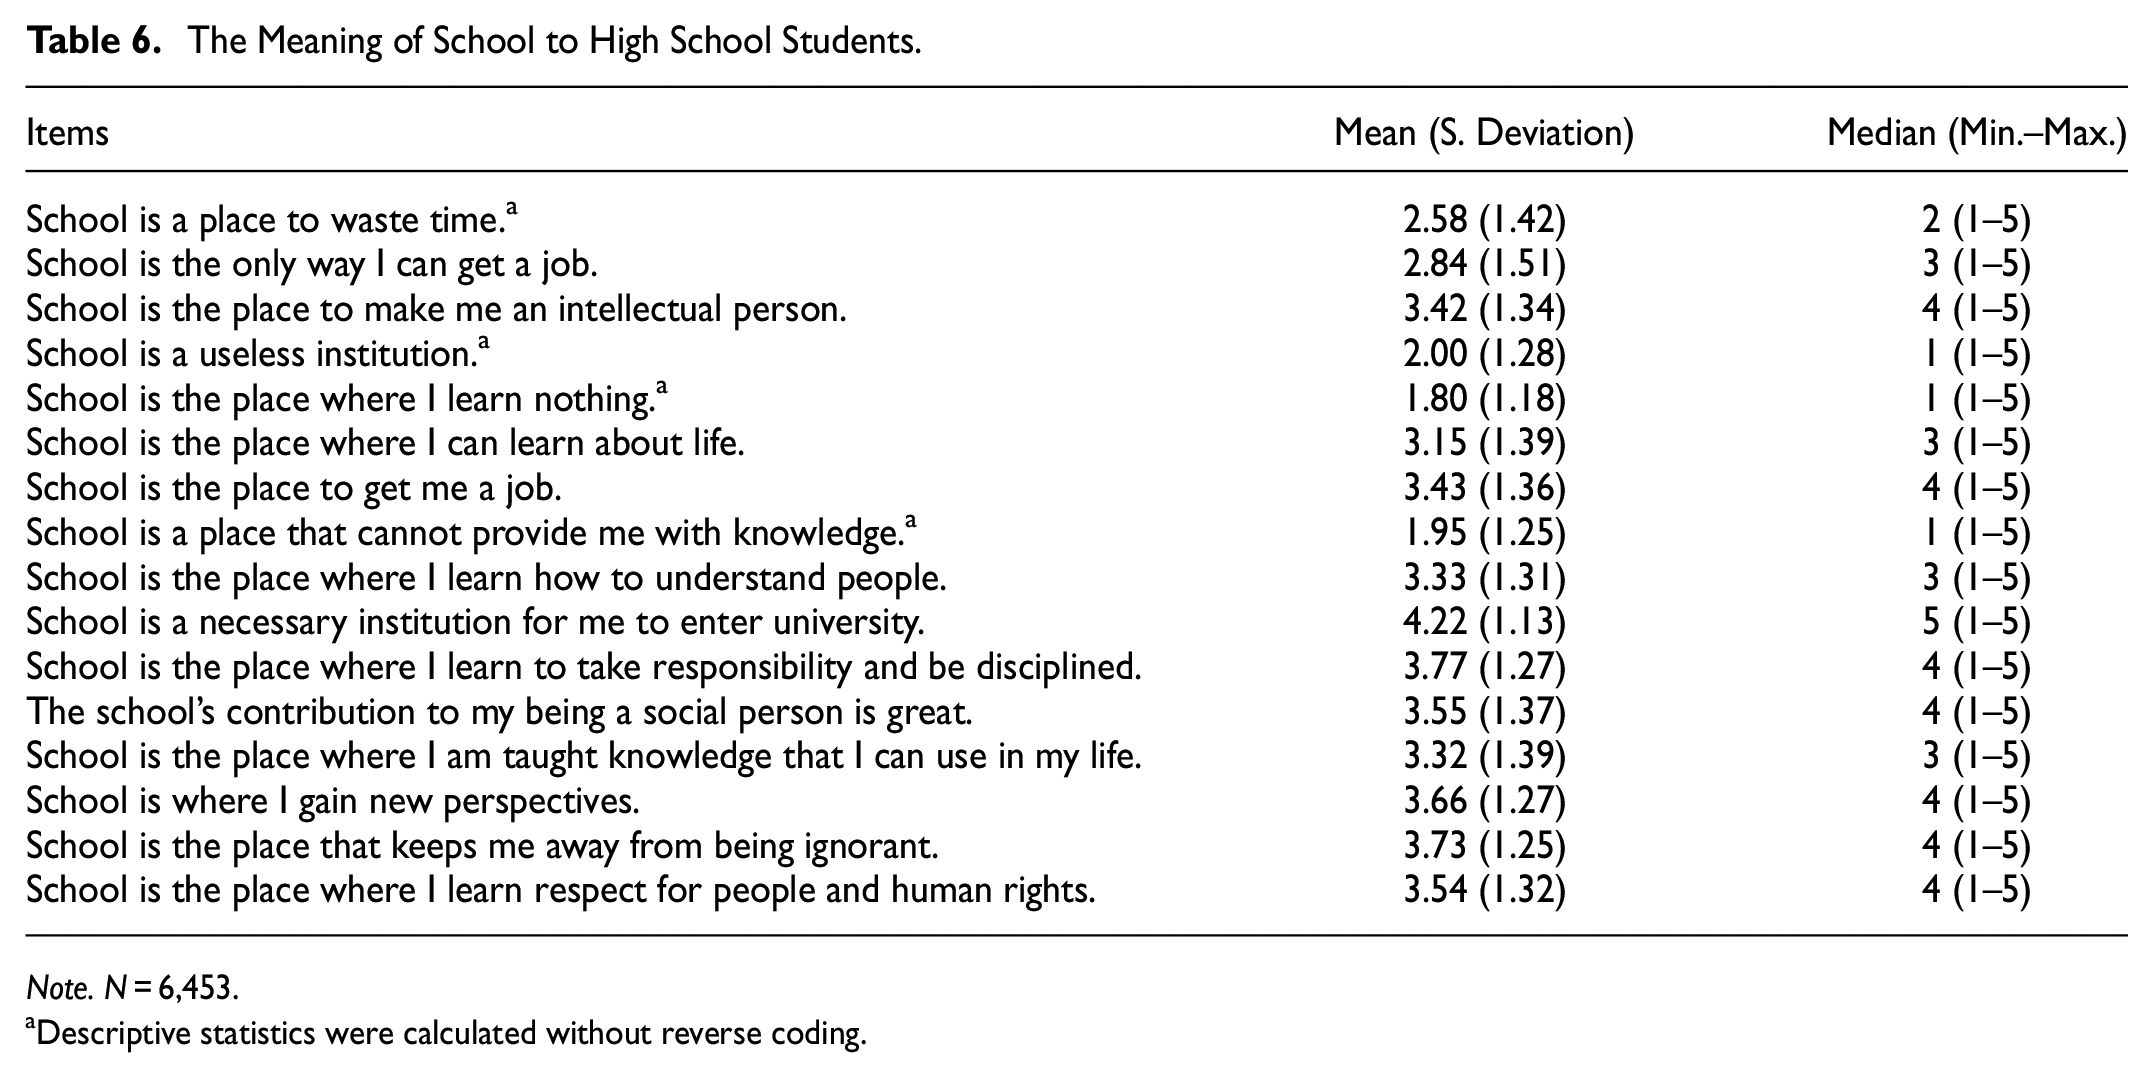
The participants’ responses to each item in the MoSS were analyzed through arithmetic mean, standard deviation, median, minimum, and maximum values. The results are given in Table 6.
The Meaning of School to High School Students.
Note. N = 6,453.
Descriptive statistics were calculated without reverse coding.
High school students’ responses to the items about the meaning of school, the items with high and low mean and median values were focused on. The items with the highest agreement rate are as follows:
School is the place to make me an intellectual person.
School is the place to get me a job.
The school is a necessary institution for me to enter university.
School is the place that teaches me to take responsibility and be disciplined.
The school’s contribution to my being a social person is great.
School is the place where I gain new perspectives.
School is the place that protects me from being ignorant.
School is where I learn respect for people and human rights.
Two of the items with the highest agreement rate are related to school, which is regarded as a means of getting a job, which shows that the school in Turkey is considered functional in acquiring a profession. However, the item “School is the only way for me to get a job,” which is the third item in factor 3 (School as a Vocational Resource-SVR), received a moderate level of participation. This may indicate that young people consider other ways to get a job. Other high-participation items are items related to school as a means of acculturation and socialization. Interestingly, the items related to learning about life through school received moderate participation. The responses given in relation to these may be related to the fact that the mission of the school to teach life is mostly at the basic education level. The items with the lowest response rate are as follows:
School is a place to waste time.
School is a useless institution.
School is the place where I learn nothing.
School is a place that cannot provide me with knowledge.
All of these items are related to the perspectives that regard the school as unnecessary and useless. Low participation in these items is essentially a positive thing. From these responses, it can be concluded that the schools in Turkey are not considered as unnecessary educational institutions and it has a function.
The Meaning of School to High School Students by Grade Levels
The comparison of the meaning attributed to school by high school students according to grade level was carried out with the ANOVA test. In the study, ANOVA was preferred in the comparison analysis since the grade level data formed five groups (preparatory, 9th, 10th, 11th, and 12th grade). The results are given in Table 7.
The Meaning Attributed to School by High School Students According to Grade Level.

The factor total score was obtained without reverse coding of SUI item 4.
Grand total was obtained after SUI item 4 was reverse coded.
A significant difference (p < .05) was found in the SAS, SUI, and SVR sub-factors and the total scale scores according to the “grade” of the students. These significant differences occurred at the small effect size level. The difference occurred between the groups according to “grade” variable can be seen in Table 7 under the column “Significance.”
The Meaning of School to High School Students by the Field of Study/Major
The comparison of the meaning attributed to school according to the field of study/major was carried out with the ANOVA test. Since the field data consisted of seven groups (1. Turkish & Mathematics, 2. Science, 3. Social Sciences, 4. Vocational, 5. No specific field/major, 6. Foreign Languages, 7. Other), ANOVA was preferred in the comparison analysis. The results are represented in Table 8.
The Comparison of the Meaning Attributed to School According to the Field of Study/Major.

The factor total score was obtained without reverse coding of SUI item 4.
Grand total was obtained after SUI item 4 was reverse coded.
A significant difference (p < .05) was found in the SAS, SUI, and SVR sub-factors and the total scale scores according to the “field of study/major” of the students. These significant differences occurred at the small effect size level. The difference occurred between the groups according to “field of study/major” variable can be seen in Table 8 under the column “Significance.”
The Meaning of School to High School Students According to Mother’s Level of Education
The comparison of the meaning attributed to school by high school students according to the mother’s education level was carried out with the ANOVA test. In the study, ANOVA was preferred in the comparison analysis since the data of the students’ maternal education level consisted of seven groups (1. Illiterate, 2. Literate, 3. Primary or Middle School Graduate, 4. High School Graduate, 5. University Graduate, 6. Master’s/PhD Graduate, 7. Rather not say/Prefer not to answer). The results are presented in Table 9.
The Comparison of the Meaning Attributed to School by High School Students According to the Mother’s Education Level.

The factor total score was obtained without reverse coding of SUI item 4.
Grand total was obtained after SUI item 4 was reverse coded.
A significant difference (p < .05) was found in the SAS, SUI, and SVR sub-factors and the total scale scores according to the “Mother’s Level of Education” of the students. These significant differences occurred at the small effect size level. The difference occurred between the groups according to “Mother’s Level of Education” variable can be seen in Table 9 under the column “Significance.”
The Meaning of School to High School Students According to Father’s Level of Education
The comparison of the meaning attributed to school by high school students according to the father’s education level was carried out with the ANOVA test. In the study, ANOVA was preferred in the comparison analysis since the father’s level of education data consisted of seven groups (1. Illiterate, 2. Literate, 3. Primary or Middle School Graduate, 4. High School Graduate, 5. University Graduate, 6. Master’s/PhD Graduate, 7. Rather not say/Prefer not to answer). The results are given in Table 10.
The Comparison of the Meaning Attributed to School by High School Students According to the Father’s Education Level.

The factor total score was obtained without reverse coding of SUI item 4.
Grand total was obtained after SUI item 4 was reverse coded.
A significant difference (p < .05) was found in the SAS, SUI, and SVR sub-factors and the total scale scores according to the “Father’s Level of Education” of the students. These significant differences occurred at the small effect size level. The difference occurred between the groups according to “Father’s Level of Education” variable can be seen in Table 10 under the column “Significance.”
The Meaning of School to High School Students According to Their Family Income
The comparison of the meaning attributed to school by high school students according to the family income was carried out with the ANOVA. In the study, ANOVA was preferred in the comparison analysis since the family income data consisted of five groups (0–5,000 TL, 5,001–10,000 TL, 10,001–15,000 TL, 15,001 TL and above and those who prefer not to answer). The results are given in Table 11.
The Comparison of the Meaning Attributed to School by High School Students According to the Family Income.

The factor total score was obtained without reverse coding of SUI item 4.
Grand total was obtained after SUI item 4 was reverse coded.
A significant difference (p < .05) was found in the SAS, SUI, and SVR sub-factors and the total scale scores according to the “family income” of the students. These significant differences occurred at the small effect size level. The difference occurred between the groups according to “family income” variable can be seen in Table 11 under the column “Significance.”
Discussion and Conclusions
This study introduced the first measurement tool for the meaning of school from high school students perspectives and made comparisons on the basis of some sociodemographic variables using this tool. Therefore, it provides evidence for the current understanding of schooling among high school students in Turkey and provides insights for the future of education.
In the measurement tool developed to investigate the meaning of school for high school students, it was found that the items with the highest agreement rate are positive items that describe the school as a place to create intellectual person, a place to get a job, to enter university, a place that teaches the person how to take responsibility and be self-disciplined, a place that contributes to the socialization of the person, a place where they gain new perspectives and where they become aware of the life, learn to show respect for people and human rights. On the other hand, the items with the lowest response rate describe that the school is a place to waste time, a useless institution where nothing is learned and a place that cannot provide them with necessary knowledge. These results reveal that most of the students attribute positive meaning to school and this can be explained through the comparisons made in terms of the students’ sociodemographic characteristics.
Given the sociodemographic variables (gender, grade, school type and field of study, father’s and mother’s level of education, family income), we can conclude that students’ gender and their families’ level of income has a great impact on students’ attribution to the meaning of school. In other words, positive attributions associated with school are given mostly by the students whose family income is lower, which shows the meaning of school is closely related to the economic situation of the family. We believe that the students feel obliged to see the school as a place to guarantee their future through getting a job after graduating from university. This finding is in line with the research conducted by Pifer (2000) in that education at school make future employment opportunities possible. Similarly, Kromydas (2017) states that students have a more pragmatic and instrumental understanding of school, considering it a place that paves the way for a better-paid and high-quality jobs in the future. However, they should also think that getting a diploma or graduating from a school may not guarantee a good job in the future. In addition, the present state and the future potentials of diplomas may not be the same. Similarly, the students who just began high school attribute more positive meaning to school. This may be due to the fact that they have higher expectations from school in the early years, but it gradually disappears. Similarly, as they have to study for the university entrance exam (based on standardized testing with multiple choice questions) at the end of the 12th grade rather than focusing on school lessons, they may see private course centers/institutions more important than the school. This may also be associated with motivation loss as they progress from preparatory to 12th grade. The findings of the study conducted by Kavalić et al. (2021) are in line with this finding as the age of the respondents greatly influences the positive perceptions toward school. Similarly, if they are not successful enough, if they do not have quality education in science and math, if their parents’ education level is low, they have a more positive attitude toward school. This may be because they feel insufficient or unsuccessful at school, or they do not want to be in the same situation as their parents in the future.
The results of this study have raised a few more questions, many of which can only be investigated by conducting further research. Future studies may focus on investigating the meaning of school to students analyzing different factors such as curriculum, teacher support, teaching methods and techniques teachers use, school’s physical environment and facilities, classroom practice, learning sources, school management etc. may provide interesting results for educational policy makers, administrators, teachers, and parents. To illustrate, further research regarding the curriculum effectiveness should be regularly conducted in every school context to analyze its role in making schools meaningful for the students. Because the school is not only a place that helps students gain academic knowledge, skills, and attitudes for their future profession, but also a place for socialization. This requires teachers to have curriculum literacy to enhance learning and student happiness. Another interesting study may focus on teachers’ professional learning needs about the meaning attributed to the school by high school students. This is of great importance as these students are in an adolescence period which is a transition from childhood to adulthood that includes rapid changes in their body and brain. This type of study may increase teachers’ awareness about these students’ psychology and how they think.
Limitations
This study has the following limitations. First, the study was carried out with a large number of participants (6,453 high school students) in different cities, Turkey, and the researchers could not implement the measurement tool by visiting all these cities. Therefore, not all implementations were able to be controlled by the researchers. Second, this measurement tool was developed to be used with high school students only. Thus, the researchers who would like to carry out similar research has to be aware of this. Despite these limitations, the current study presents significant results and some useful knowledge regarding the meaning of school attributed by high school students.
Supplemental Material
sj-docx-1-sgo-10.1177_21582440231199054 – Supplemental material for What is the “Meaning of School” to High School Students? A Scale Development and Implementation Study Based on IRT and CTT
Supplemental material, sj-docx-1-sgo-10.1177_21582440231199054 for What is the “Meaning of School” to High School Students? A Scale Development and Implementation Study Based on IRT and CTT by Çetin Toraman and Güneş Korkmaz in SAGE Open
Supplemental Material
sj-docx-2-sgo-10.1177_21582440231199054 – Supplemental material for What is the “Meaning of School” to High School Students? A Scale Development and Implementation Study Based on IRT and CTT
Supplemental material, sj-docx-2-sgo-10.1177_21582440231199054 for What is the “Meaning of School” to High School Students? A Scale Development and Implementation Study Based on IRT and CTT by Çetin Toraman and Güneş Korkmaz in SAGE Open
Footnotes
Acknowledgements
The authors gratefully acknowledge Turkish Ministry of National Education, school administrators and those high school students who voluntarily participated in the research.
Declaration of Conflicting Interests
The author(s) declared no potential conflicts of interest with respect to the research, authorship, and/or publication of this article.
Funding
The author(s) disclosed receipt of the following financial support for the research, authorship, and/or publication of this article: This study was not funded by our universities or other organizations.
Ethics Statement (Including the Committee Approval Number)
This study was approved by Çanakkale Onsekiz Mart University Scientific Research Ethics Committee (Date of Approval: 04.11.2021/No:19/29). All participants of the study gave their written consent for participation. And, to implement the measurement tool in all provinces of Turkey, the research application permission was obtained from Ministry of National Education, Directorate of Strategy Development (Date: 06.12.2021/No: E-49614598-605.01-38390991).
Supplemental Material
Supplemental material for this article is available online.
References
Supplementary Material
Please find the following supplemental material available below.
For Open Access articles published under a Creative Commons License, all supplemental material carries the same license as the article it is associated with.
For non-Open Access articles published, all supplemental material carries a non-exclusive license, and permission requests for re-use of supplemental material or any part of supplemental material shall be sent directly to the copyright owner as specified in the copyright notice associated with the article.