
Abstract
Keywords
Introduction
Food security exists when all individuals have a consistent physical, social and economic access to safe, adequate, affordable, and nutritious foods that meet their dietary needs including caloric/energy needs at all times; without compromising their food choices for dignified, healthier, and productive lives (FAO, 2022; von Braun et al., 2023). With or without considering food safety, quantity, and nutritional quality, food insecurity happen when individuals have limited access to food (Burlingame & Dernini, 2018; Lopes et al., 2023). Individuals experiencing food insecurity tend to drift into hunger, which is an uncomfortable or painful physical sensation caused by inadequate intake of dietary energy (Lee, 2022).
Four main food security pillars consist of availability, accessibility, utilization, and the stability of the first three pillars (Berry et al., 2015; Jacobi et al., 2020; Peng & Berry, 2019). The high-level panel of experts on food security and nutrition have proposed that agency and sustainability must be added to the food security framework (Clapp et al., 2022; HLPE, 2020). Agency and sustainability when added to the four main pillars now constitute a six-dimensional food security concept. The high-level panel of experts proposed that sustainability and agency is very crucial in order to meet food security and nutrition targets (HLPE, 2021; Whittall et al., 2023). The shift from a four-dimensional framework poses a measurement challenge for a six-dimensional food security concept (Burchi & De Muro, 2016).
The measurement of food insecurity is complex and there is no single instrument capturing all of the dimensions of food security (Manikas et al., 2023). Instruments such as the household food security survey module (HFSSM), household hunger scale (HHS), household food insecurity experience scale (FIES), and among others are validated to measure food insecurity at household level (Cafiero et al., 2018; Pérez-Escamilla, 2012); and often measure the food accessibility dimension (Anderson, 2018a, 2018b). To extend the measurement of food insecurity beyond capturing only the four domains of food insecurity; that is, worries and anxieties over foods, inadequate quality of foods, insufficient quality of foods, and obtaining foods through socially unacceptable means. A new instrument called the day scholars food insecurity experience scale-survey module (DSFIES-SM); in addition to the domains captured by other instruments also captures the consequences of food insecurity among schoolchildren.
Food insecurity of children could be measured from various settings, that is, in homes and in schools. Existing reliable food insecurity instruments often rely on parents/guardians’ reports of child food insecurity. Child food insecurity, therefore, often requires that household members report the level of food insecurity experienced by their children who are always in schools during the survey periods. Self-reports of lived experiences obtained from children in schools is vital to accurate measurement of food insecurity. Thus, the DSFIES-SM is a food insecurity measure that captures food insecurity in the schools settings rather than in households. To emphasize, the DSFIES-SM is a school instrument capturing the lived experiences of food insecurity and/or hunger among children while at school. Therefore, the DSFIES-SM must not be administered to children who are not within the schools; in these circumstances, instruments discussed by Frongillo and colleagues in a commissioned paper should be used (Fram et al., 2015).
Food insecurity measured from the “schools context” is a more objective indicator for monitoring and tracking the progress toward achieving universal coverage of school feeding programs. School food insecurity refers to the state of food insecurity among children whilst residing in schools. Measuring school food insecurity using the DSFIES-SM confers an opportunity to children to self-report their lived school experiences of food security as they are often left out when such programs are evaluated. This unlocks the potential that schoolchildren’s voices, the primary beneficiaries of school feeding programs are heard in the event that school feeding is evaluated.
Analyzing the estimates of school food insecurity allows the possibility for the ordinal ordering/ ranking of schools nationally or regionally. Schools with the highest share of food insecure and/ or hungry children would be prioritized for the implementation of support programs over schools with good food security scenarios.
This paper describes the methodological approach to the development of the DSFIES-SM as an instrument for the measurement of school food insecurity, and its psychometric properties. It tests whether it is methodologically feasible to assess food insecurity in schools.
Literature Review
The main phases of scale development have been considered during the construction of the DSFIES-SM. Boateng et al. (2018) and Tay and Jebb (2017) state that the identification of domain(s) and item generation should occur in the item development phase, followed by the assessment of content validity.
Two approaches were used during the DSFIES-SM item development phase. Thirty-six items were generated deductively based on the available scholarly work conducted in developed countries on child food insecurity experiences. The deductive approach focused on an already-formed conceptualization of food insecurity construct in the context of the developed countries. Because there are less studies on food insecurity experiences conducted in developing countries especially Sub-Saharan Africa (SSA).
Deductively generated items (Supplemental File 1) were derived from a thorough scrutiny of 36 publications (Arteaga & Heflin, 2014; Ashiabi, 2005; Ballard et al., 2013; Bartfeld & Ahn, 2011; Bartfeld & Ryu, 2011; Bartfeld et al., 2009; Benn & Carlsson, 2014; Bernal et al., 2012, 2014; Bernal, Frongillo, & Jaffe, 2016; Bernal, Frongillo, Herrera, & Rivera, 2016; Coates et al., 2003, 2007; Coates, Frongillo, et al., 2006; Coates, Wilde, et al., 2006; Condon et al., 2009; Fletcher & Frisvold, 2017; Food and Agriculture Organization of the United Nations [FAO], 2013; Fox, 2018; Fram et al., 2013, 2015; Frongillo & Nanama, 2006; Gillespie et al., 2003; Gundersen et al., 2012; Huang & Barnidge, 2016; Huang et al., 2015; Melgar-Quinonez, 2004; Melgar-Quinonez et al., 2006; Nord, 2012; Nord et al., 2002; Nord & Romig, 2006; Pérez-Escamilla et al., 2004; Radimer et al., 1990, 1992; Wolfe & Frongillo, 2001).
The inductive approach was also used because there was much uncertainty in the dimensionality of the construct in the context of schools in SSA. The 36 items generated deductively were administered to students who had studied within the local context of schooling to critique, appraise, and provide feedback on each item. Feedback from students was used to inductively modify the items put forward for the next phase of the DSFIES-SM development to reflect the school context base of items.
Inductively fine-tuned items were subjected to the assessment of face validity to consider how suitable each phrased item that fitted into the model visually seemed to be on the DSFIES-SM under development. IK interacted with 12 teachers who were overly competent in setting exams and evaluating the learners across village schools. The more informal and subjective assessment of each provisional item was accomplished via direct telephoning of these primary school teachers to endorse each item’s suitability and suggest adjustments or amendments required for further fine-tuning. These teachers responded to each item based on their perception that every village day-scholar could either or not understand, comprehend, and respond to every DSFIES-SM item correctly if the question is presented to them individually as part of a survey questionnaire. Face validation was performed in accordance with what Boateng et al. (2018) had previously suggested.
Twelve DSFIESM-SM items (Supplemental File 2) which had passed face validity were then subjected to content validation as recommended (DeVellis, 2012; Morgado et al., 2018; McPhail, 2007) in the second step of the first phase of DSFIES-SM development. During the check for content validity, five conditions as stated by Guion (1977) were highly prioritized.
Six expert judges were asked whether, (i) the school food insecurity domain (s) were unambiguously defined (paying special attention to the context), (ii) the behavioral content of school food insecurity experiences had a holistically accepted meaning (within school context), (iii) there is an agreement that the school food insecurity domain (s) were sufficiently sampled (from day-scholars) based on consensus, (iv) the response content (i.e. yes, no, I don’t know or I have refused) can be reliably observed and evaluated after survey administration and, (v) the content domain (s) were relevant to the purpose of measuring the school food insecurity experiences. These conditions were closely emphasized throughout the process of content validity assessment to ensure that content relevance, representativeness, and technical quality are achieved. Content validity indices generated during this step are attached as Supplemental File 3.
DSFIES-SM items that had passed content validity were then administered to 30 day-scholars from one village school and one town school. Cognitive testing involved the use of the Delphi method. Questions that had previously been check for content validity were read repeatedly while checking the understanding of the children for each item under question. Items that were interpreted differently by the children were further fine-tuned to reflect the understanding of the children whilst capturing the exact subdomain of the school food insecurity construct the item intended to capture.
Cognitive interviews were conducted during the third step of the second phase of DSFIES-SM development in accordance with Alaimo et al. (1999) example and Beatty and Willis (2007) approach. Cognitive interviews helped to (i) determine whether the question (s) were generating the information that we intended to collect from day-scholars within school environments, (ii) ensure that day-scholars (both village and town learners) understand questions to the authors’ satisfaction, and (iii) understand if day-scholars from both towns and villages can answer each item in a manner that reflects their own food insecurity experience at schools. A graphical representation of how well day school children understood each item is attached as Supplemental File 4.
This paper focuses on the DSFIES-SM development and evaluation phases, which included sampling and survey administration, item reduction and extraction of factors, tests of dimensionality, reliability, and validity. Considering the word count limit set by the publisher, the paper does not discuss the information regarding the initial steps of the DSFIES-SM development, but rather concentrates on exploring later phases to determine if it is methodologically feasible to construct a reliable and valid measure of school food insecurity.
Methods
Study Area
This study was conducted between August 2020 and September 2022 in Rakai, a southeastern district in the central province of Uganda. Rakai town is about 199 km, by road, south-west of Kampala, Uganda’s capital and largest city. Similarly, Rakai is located approximately 48 km, by road, north-west of the international border with Tanzania at Mutukula and about 66.5 km, by road, south-west of Masaka, the nearest large city. Rakai district was chosen because it is historically known to have been severely affected by the widely spread HIV epidemic that started in 1986. This epidemic continues to be a public health threat, which leaves many children born to HIV infected parents orphaned (Mafigiri et al., 2017). Therefore, children are particularly vulnerable to food insecurity because parental deaths attributed to the Acquired Immuno-Deficiency Syndrome (AIDS) and other diseases jeopardizes their ability to maintain a consistent access to food. A map showing the study area is attached as Supplemental File 5.
Participants and Sample Size
Two-stage sampling method was used in this study. Of the 157 schools located in Rakai district, those most vulnerable to food insecurity were chosen based on a predefined criteria in the first stage of sampling. These included the schools being government funded, not having mandatory feeding programs, and teaching primarily day-scholars (Figure 1). One hundred twenty-eight (128) “day scholars” who are children leaving home for school were randomly selected in the second stage of sampling (Figure 1) to participate in the DSFIES-SM study. Study participants were aged 9 to 17 years old, and were all recruited from village schools were meals were optional or not mandatory. Most of the children (85.2%) were aged between 9 and 13 years old. The mean (SD) age of the sample was 10.5 (1.58) years old.
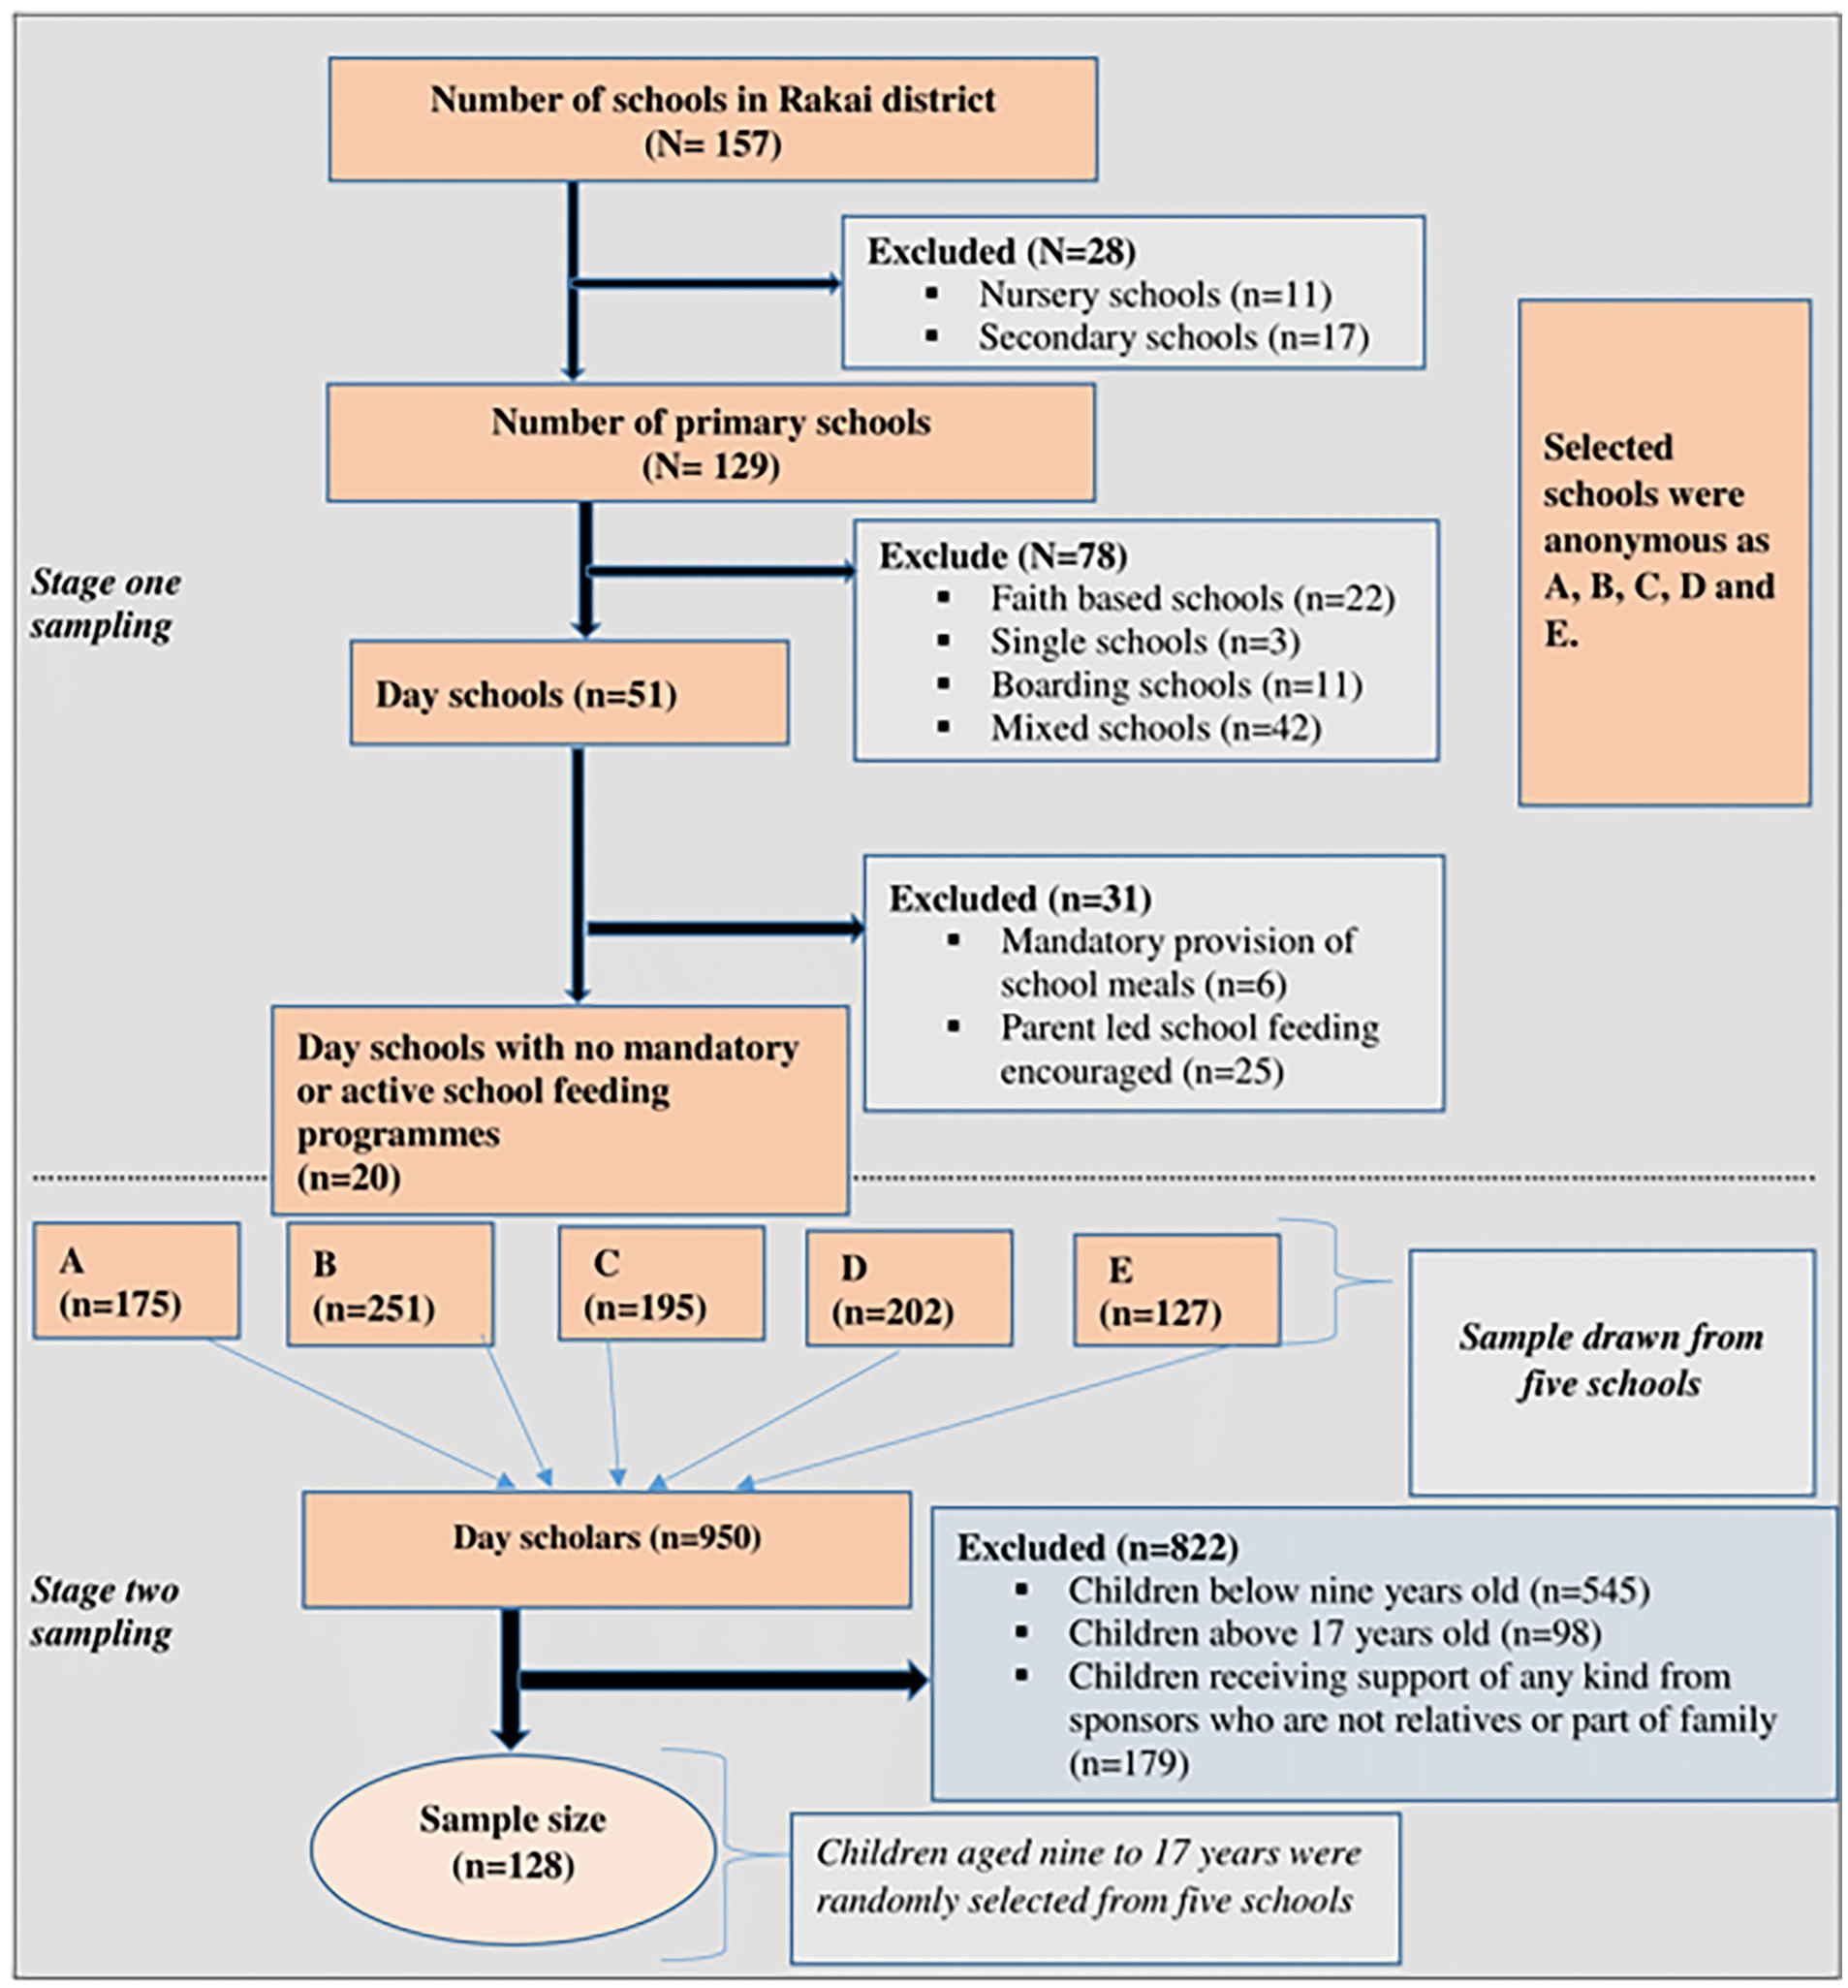
Two-stage sampling framework.
The analysis of variance test for normality, that is, the Shapiro Wilk test for normality (p > .05) showed that data was obtained from a normally distributed population. In addition, the sample was heterogeneous in nature, as it reflected and captured a range of lived food insecurity experiences at varying degrees, among children whose schools did not have functional school feeding programs.
The sample was determined a priori to meet the sample size requirements for psychometric analysis. The sample size was dependent on several aspects of the DSFIES-SM study, which included the degree of variation between the variables (for both persons and items) and the level of over-determination (i.e., the ratio of variables to several factors) of the factors (Memon et al., 2020). The sample to variable ratio was 10:1 and this ratio is the minimum recommended by Nunnally since 1978. Guadagnoli and Velicer had suggested that a minimum sample of 300 to 450 is sufficient for acceptable comparability of patterns (i.e., for factor analysis), but obtaining such a large sample was not possible because scale development is always not funded and study recruitment happened during the COVID 19 pandemic. Power analysis was determined using G*Power 3.1 (Faul et al., 2007). The actual power was greater than 95%. Statistical significance level was set at .05.
Survey Administration
Survey data were collected using the paper and pen/pencil interviewing (PAPI) technique. DSFIES-SM items were translated and administered to children in Luganda; the most widely spoken local language in southeastern Uganda. Survey data demanded paper and pen/pencil interviewing since villages in the Rakai district had unstable internet connections and frequent power blackouts. The paper and pen/pencil interviewing technique resulted in a lower response rate and some enumerator errors. Paper and pen/pencil interviews permitted getting real-time instant feedback and increased the ability to obtain more data that are confidential from children. The survey questionnaire is attached as Supplemental File 2.
Psychometric Analysis
Survey administration received an insignificant number of missing cases of approximately 2%. Missing data points were dealt with using item-level multiple imputation in IBM SPSS version 28. Item level imputation generated more efficient estimates of full information maximum likelihoods that were exported from SPSS to WINSTEPS version 5.1.4 for the computation of fit statistics. Full information maximum likelihood ratios were used in place of raw data, for Rasch measurements in IBM SPSS version 28.
Two theories, Item Response Theory (IRT) and Classical Test Theory (CTT) were used simultaneously in the psychometric analysis of the DSFIES-SM. CTT complemented IRT when generating internally consistent, parsimonious, and fully functional items of the DSFIES-SM. These theories functioned to produce the latent construct of school food insecurity that the DSFIES-SM presumed to measure DSFIES-SM items correlated with each other and they discriminated between individual cases to contribute significantly to the school food insecurity construct.
Generated item difficulty and discrimination indices were based on CTT, which assumed that the model formed a food insecurity construct based on observations and true scores on every domain of interest, that is, uncertainty, worry, inadequate quality and quantity, and socially unacceptable behavior. CTT also accounted for their accompanying random errors. IRT was used to determine the effect of deleting a given survey item or a set of survey items when examining the item information and the standard error (SE) functions for the DSFIES-SM.
Inter-item and item-total correlations, estimated biserial correlations, reliability statistics for item response parameters (i.e., Cronbach’s alpha, spearman-brown, Guttmann half-split) were generated from the model using SPSS version 28.0. Separation coefficients and fit statistics (In fit and Outfit mean squares) were generated by WINSTEPS software during Rasch measurement. The subject-to-item ratio was sufficient to conduct factor analysis in SPSS version 28. Factors were extracted to determine the optimal number of the domains that fit a set of survey items (and their patterns in each model) for the development of a measure of school food insecurity.
Measures
The psychometric measure of school food insecurity captures six sub-domains of the food insecurity construct which day scholars were able to report; (i) Feelings of uncertainty or anxiety over food (i.e., as depicted from items Q1 and Q2); (ii) Perceptions that food is of insufficient quantity (i.e., as depicted from items Q3, Q4, Q5, Q6, and Q7); (iii) Perceptions that food is of insufficient quality (i.e., as depicted from items Q4, Q5, Q6, and Q7); (iv) Reported reductions of food intake (i.e., as depicted from item Q6); (v) Feelings of shame for resorting to socially unacceptable ways (i.e., as depicted from items Q8, Q9, and Q10); and (vi) Reported consequences of reduced food intake (i.e., as depicted from items Q11 and Q12). The school food insecurity construct and its domains are summarized (Figure 2).

Items of the DSFIES-SM and the domains of the school food insecurity measure.
Items of the DSFIES-SM
DSFIES-SM item (Q1) captures the aspect of “uncertainty” within the school context. Unlike item (s) that captures household uncertainty among family members, day scholars were asked if they want or expect to eat, but their schools do not provide food. Item (Q1) differs from the items that capture household uncertainty because day scholars are socially dependent upon the school provided, they leave home for school. The schools, governments, or local authorities, entirely determine whether children should have access to meals when at school. Unless if parent led school feeding is possible, households do send children to school with food, but this is not always the case in low-income countries. Many households do not have the surplus to provide children with while going to school. Even when children do not have financial resources especially money, they can be sure that they will eat provided school feeding is actively being implemented by schools that do get support from the governments and development agencies or if parents/guardians to pay money for school food.
DSFIES-SM item (Q2) captures the aspect of “worries” among day scholars within the school context. Unlike items that capture household worries among family members, worrying among day scholars reflects a more severe state of food insecurity in the households that send these children to schools. Those responsible for school feeding first experience worries. Later on, children worry once they notice that the school is not capable of maintaining a consistent access to school meals at either breakfast, lunch, and or/supper. Day scholars worry about food running out of their homes before it runs out of their schools. If households are food secure, day scholars may not worry too much at school because they will go home to eat. If schools are food secure, day scholars may not worry too much because they lack food at home as they will go to school and have access to a lunch, though not enough for survival. Therefore, worrying that schools will run out of food is more pronounced if the children come from food-insecure households.
DSFIES-SM item (Q3) captures the “affordability” aspect of school meals. Unlike equivalent items that constitute the household food insecurity-experience scales which ask about “… not having money to buy or purchase food.” In the context of schools, parents, guardians or caretakers are responsible for paying for school meals if schools do not receive support from development agencies, humanitarian organizations or their local and central governments. In the parent led school feeding model, the responsibility of feeding schoolchildren lies in the hands the parents, guardians, and caregivers by offering support either in-kind or food itself. Parents, guardians or caregivers within food-insecure households or household heads at risk of food hardship cannot afford to pay for school food. Therefore, children stay hungry without the period they are at school, and end up experiencing “hunger” within both their schools and their households.
DSFIES-SM items (Q4, Q5, Q6, and Q7) captures the aspect of “inadequate quality.” Items (Q4, Q5, and Q6) reflected a worse state of food insecurity in schools than in households. Item (Q7) reflected a worse state of food insecurity in households than in schools. Item (Q7) asks if the day scholars wait for school food because there is no food at home. Day-scholars prefer not to eat “bad or poor quality food” or “school food not served on time” if the households are food secure. Children from extremely food-insecure households wait for school food even if it is of poor quality unless if eating it leads to food poisoning or associated illnesses. For those from food insecure households, their food preferences are always compromised due to school food insecurity.
DSFIES-SM items (Q8 and Q9) capture the aspect of obtaining foods through socially unacceptable means. Item (Q9) reflects a more severe state of school food insecurity than item (Q8). Day-scholars who begged fellow pupils reported not having money to buy breakfast or lunch foods within the schools. At first the children will beg their peers but as the experiences become even more life threatening, children may steal or get involved in child labor. Day scholars who stole food from other schoolchildren reported having not eaten at home before school hours because the households lacked food.
DSFIES-SM items (Q10, Q11, and Q12) captured both the aspects of “hunger and starvation” in the schools’ context. Item (Q10) reflected a severer state of food insecurity in households than in schools. Day scholars shared some food they received at school with family members because they were already starving at home. Item (Q11 and Q12) captured the consequences of hunger and starvation among children when in schools. Item (Q11) reflected the poor grades or class repetitions because of chronic starvation at school. (Q12) reflected the physiological consequence of hunger within the schools. These items (Q10, Q11, and Q12) captured the severest degree of school food insecurity. The stability of food security in schools and households is equally important.
Ethical Considerations
Three months prior to the start of the study, school representatives were briefed about the potential benefits and risks of getting involved in this study. Social, psychological, physical, and all other types of harm were kept to an absolute minimum, for example, the study was conducted in accordance with the preventive measures to contain the Covid-19 pandemic. As such, Covid-19 affected none of the participants during the data collection period. Written informed consent was obtained from the parent of each of the 128 children who participated in the study. Participants were informed about their right to voluntarily get involved and their freedom to opt out of the study or decline to participate at any time. All data collected during the interviews was anonymized. Responses provided by the children and or/ schools remained confidential. Researchers ensured that the work is free of research misconduct and plagiarism. The Research Ethics Board of McGill University and that of Clarke International University in Uganda approved the study protocol. Approval Reference Number: CLARKE-2021-121: A.
Results
Item Measures
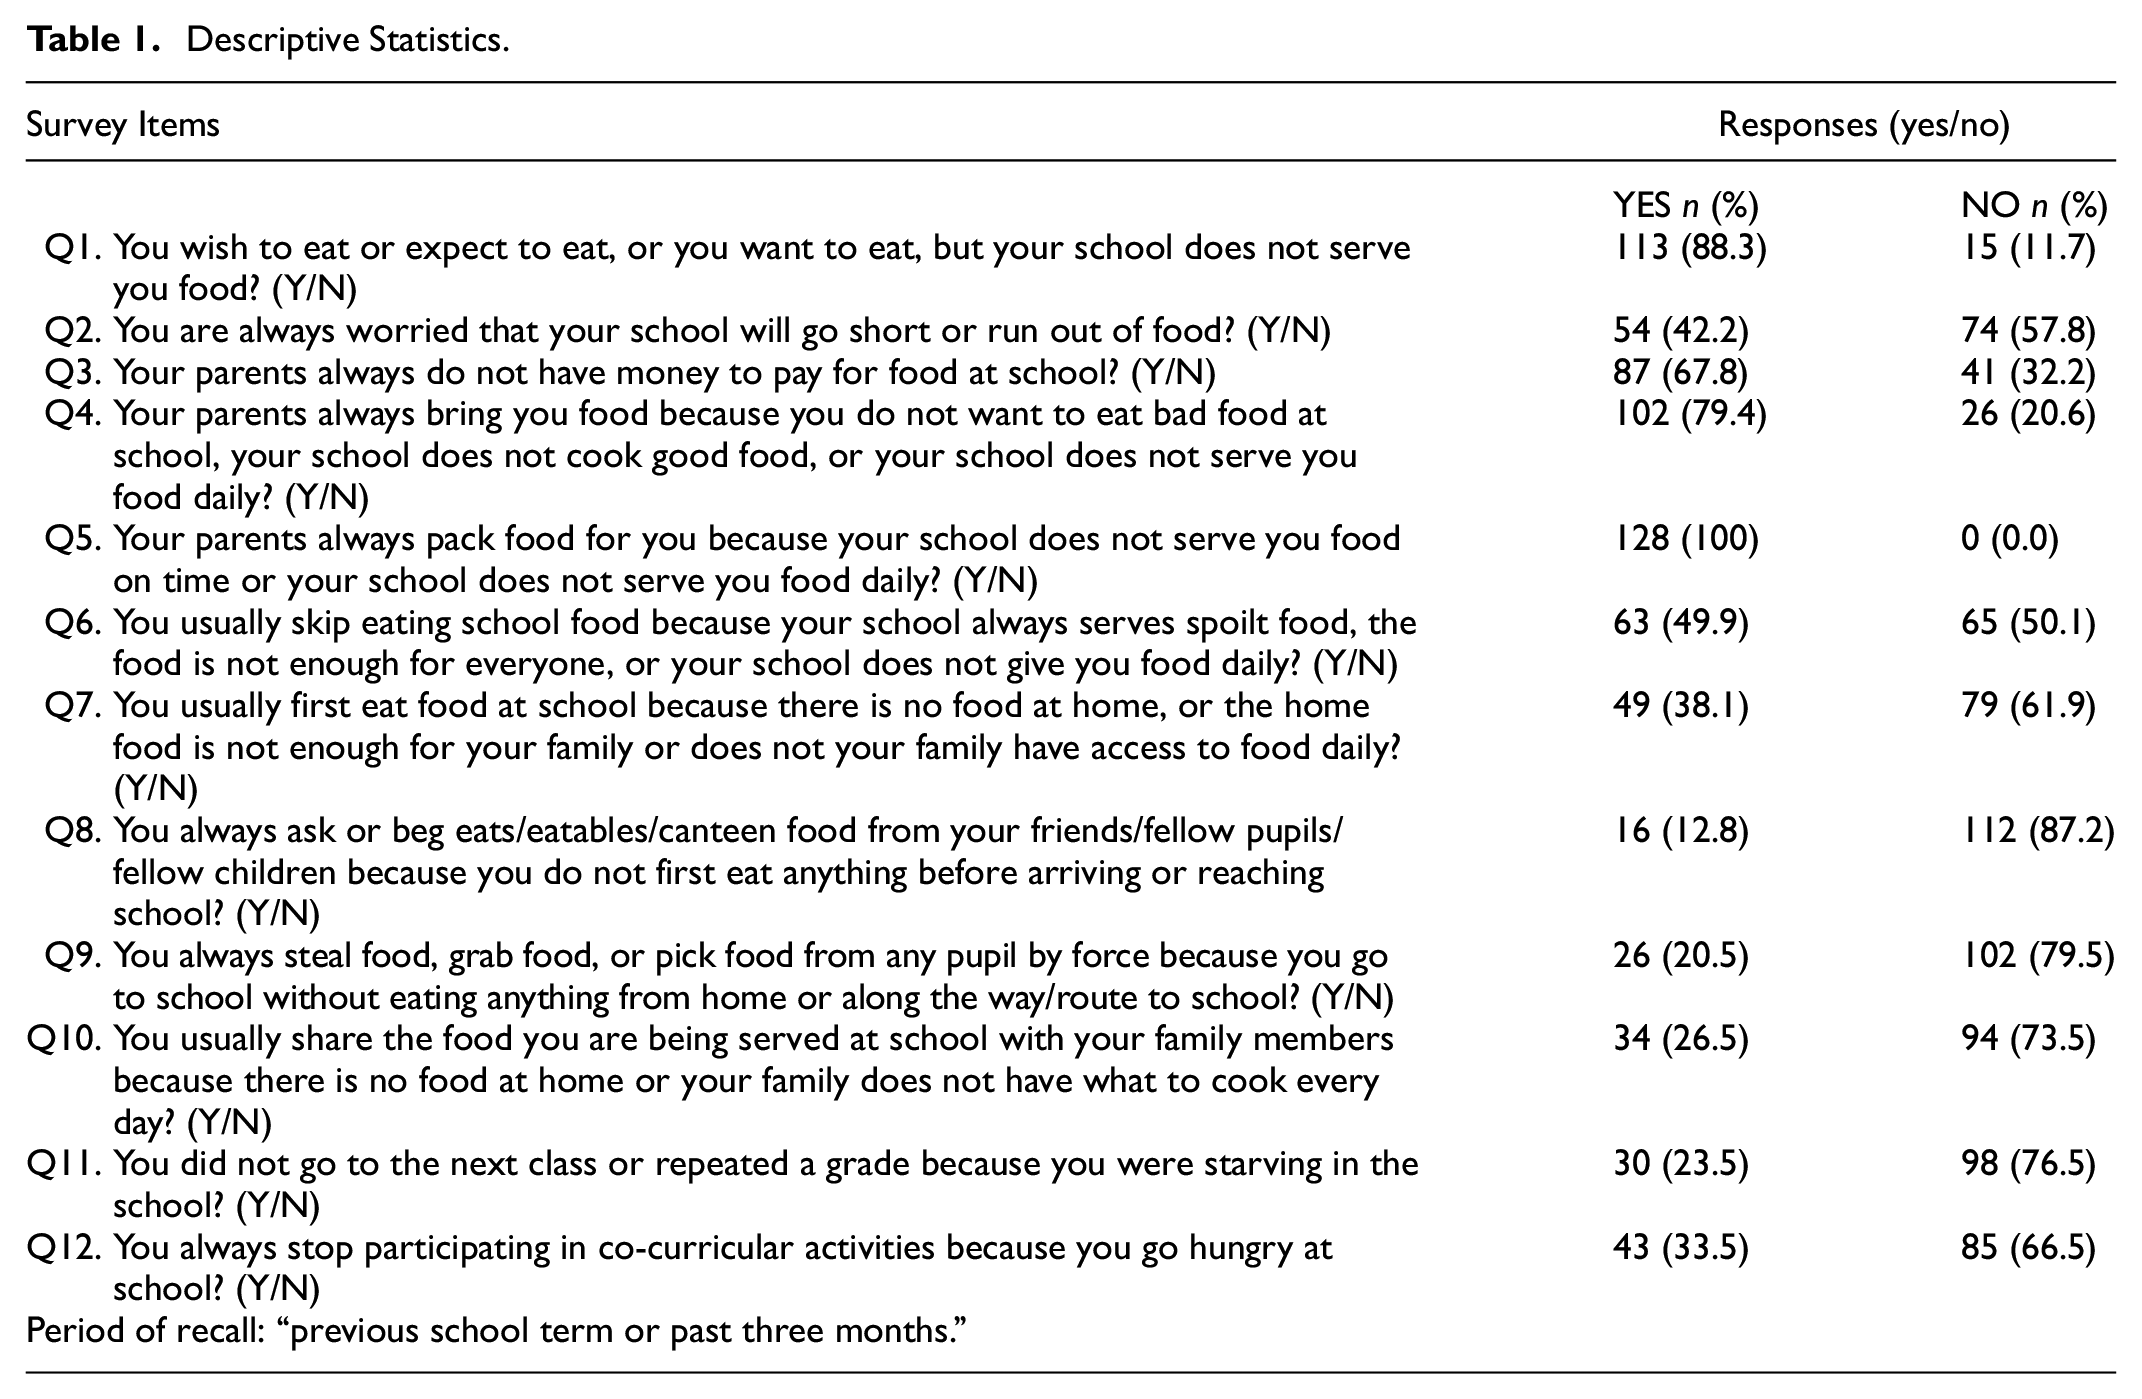
Descriptive statistics (Table 1) for items of the DSFIES-SM. Fit statistics are presented in Table 2. Fifty-eight percent (n = 7) (Q11, Q9, Q8, Q10, Q7, Q12, and Q2) had positive measure values. Forty-two percent (n = 5) (Q1, Q3, Q4, Q5, and Q6) had negative measure values. Nearly 17% (n = 2) (Q5 and Q7) were misfits (MNSQ values were not within the 0.7 and 1.30 range); and about 33% (n = 4) (Q5, Q7, Q8, and Q4) were sensitive to outliers. About 17% (n = 8) (Q6, Q1, Q10, Q2, Q11, Q12, Q9, and Q3) fitted the model.
Descriptive Statistics.
Item Measures and Fit Statistics.

Note. MNSQ = fit statistic mean squares; ZSTD = fit statistic standardized as Z-score.
Items Correlations
Correlations between the observations of the DSFIES-SM items are presented as observed and expected point-measure correlations or corrected item-total corrections. DSFIES-SM items had acceptable corrected item-total correlations between .3 and .6 (Table 3). Standardized correlation coefficients of unobserved (latent) variables of the school food insecurity construct (Figure 3) were modeled during path analysis (Figure 4).
Item Correlation Coefficients.


Path diagram (based on standardized estimates).

Scree plot of eigenvalues.
Reliability
Reliability of each of the items that constitute the DSFIES-SM was assessed. Reliability coefficients are presented in Table 4. Coefficient alpha (Cronbach’s α) and coefficient omega (McDonald’s ω) values reflect the reliability of individual DSFIES-SM items. DSFIES-SM generated an acceptable coefficient alpha (Cronbach’s α = .78) and an acceptable coefficient omega (McDonald’s ω = .78). Guttmann split-half coefficient and the Spearman-Brown coefficient of equal and unequal length were at .77 and .78, respectively, for the DSFIES-SM. Under parallel model assumption, the test for model goodness of fit that all components of the DSFIES-SM operated independently of one another, as far as internal consistency reliability is concerned, was statistically significant (χ2 [76, 128] = 141.1, p = .84).
Item Reliability Coefficients.

Note. SD = standard deviation.
Extraction of Factors
Principle Component Analysis
Dimension reduction by principal component analysis (PCA) (Table 5) resulted in the extraction of three principal components from the dataset. The first, second and third components accounted for 19.2%, 35.6%, and 49% of the total variance for each DSFIES-SM item loading on the principle component, respectively. About 33% (n = 4) (Q1, Q2, Q4, and Q9) loaded on more than one principle component. Approximately 33% (n = 4) (Q1, Q2, Q4, and Q9) also loaded on more than one component extracted by PCA. The overall Kaiser-Meyer-Olkin (KMO) measure of sampling adequacy was 0.81.
Principal Component Loadings.

Note. “varimax” rotation was used.
Exploratory Factor Analysis
Extraction of factors by exploratory factor analysis (EFA) (Table 6) resulted in loading all DSFIES-SM item variables on only one factor via parallel analysis. Factor loadings in EFA were generally acceptable and ranged between .3 and .9. EFA accounted for 23.2% of the total variance resulting from all DSFIES-SM item variables loading on the first Factor. Bartlett’s test of sphericity was statistically significant (χ2 [66, 128] = 268, p = .16). Root mean square error of approximation (RMSEA) was <0.005; the Tucker-Lewis index (TLI) was .94; these indices suggested that the model was a good fit for EFA at a significance level of .05.
Exploratory Factor Loadings.
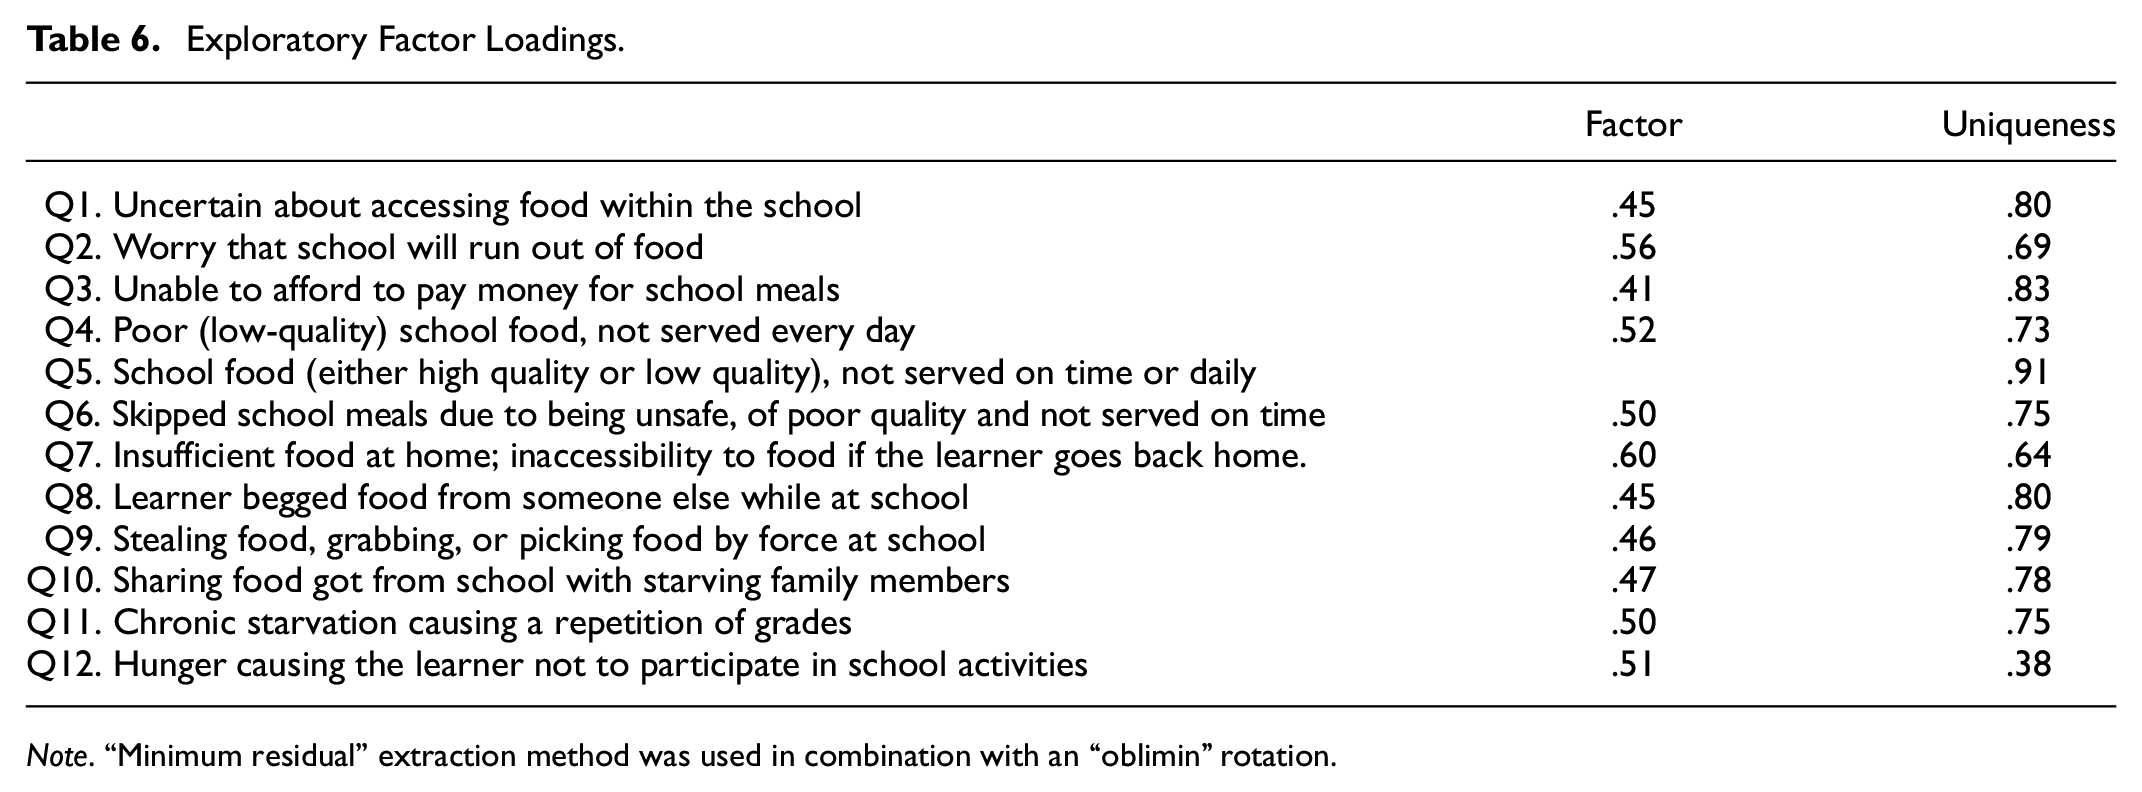
Note. “Minimum residual” extraction method was used in combination with an “oblimin” rotation.
Confirmatory Factor Analysis
Confirmatory factor analysis (CFA) at 95%CI (Table 7). Seven indicators (observed or manifest variables) of the latent construct of school food insecurity in first factor had statistically significant association (p < .05) within the three-factor CFA model. Four indicators (manifest variables) of the school food insecurity construct in second factor had statistically significant association (p < .05) within the three- CFA model. Two indicators (observed variables) in third factor had statistically significant association (p < .05) within the three-factor CFA model. The association of DSFIES-SM item variable (Q4) in the first factor of the three-factor CFA was not statistically significant (p = .14). The associations for Q1 and Q9 item variables in third factor of the CFA model were not statistically significant (p = .18, p = .07), respectively.
Confirmatory Factor Loadings.

The three-factor CFA model showed positive covariance (Table 8). The covariance estimates between first factor’s fixed- parameter and the second factor was 0.54, and the association was statistically significant (p < .001). The covariance estimate (.32) between first factor and the third factor was not statistically significant (p = .16). The covariance estimate between second factor’s fixed parameter and the third factor was statistically significant (Estimate = .53, p = .002). CFA revealed that items loaded at three factors with factor loadings ranging from .3 to .7. Covariates of unobserved (latent) variables of the school food insecurity construct (Figure 5) were modeled during path analysis of the CFA model. Parameter estimates for unobserved variables are presented (Table 9) and were statistically significant at p < .0001. Fit-measure values were at <0.001 for RMSEA at 95% CI; 1.00 for comparative fit index (CFI); 1.06 for TLI; and 0.04 for standard root mean square residual (SRMR). Tests of model fit demonstrated a perfect fit between the data and the three-factor CFA model (χ2 [47, 128] = 37.2, p = .85).
Factor Covariance Estimates.

Fixed parameter.

Path diagram (based on unstandardized estimates).
Skewness, Kurtosis, and Average Variance Extracted Composite Reliability.

Note. AVE C.R = average variance extracted composite reliability.
p < .0001.
Discussion
Items
DSFIES-SM items were pretested on children who had attended either government, private or religious-based schools in which breakfast and lunch meals are non-mandatory to them. Day-scholars were staying at schools for 8 to 10 instructional hours before going back home. DSFIES-SM items generated measures ranging from −2.58 to 2.07. DSFIES-SM items with negative measure values were more straightforward than those with positive values.
Intra- item correlations were generally acceptable. DSFIES-SM items were not strongly correlated with each other (Figure 4). Based on the inter-class correlations, the school food insecurity measure captured the domain the DSFIES-SM presumed to measure. Based on IRT and CTT theories, the DSFIES-SM items do not measure the same nuance that contributes to the measurement of the school food insecurity construct as observed from their corrected inter and intra-item corrections that ranged between 0.3 and 0.6.
Items which were most frequently responded too with a “yes” reflected the least severity of school food insecurity. These items were Q1, Q2 and Q3, thus if these items receive a “yes” response from the participants, then they are mildly food insecure. As such, items Q1, Q2, and Q3 capture mild school food insecurity. If day scholars respond with a “yes” to items Q4, Q5,Q6, Q7, Q8, Q9, in addition to Q1, Q2, and Q3, and respond with a “no” to items Q10, Q11, and Q12, then they are experiencing moderate school food insecurity. Items Q4, Q5, Q6, Q7, Q8, and Q9 capture moderate school food insecurity. “Yes” responses to items Q10, Q11, and Q12 were the least prevalent. As such, day scholars who respond with a “yes” to items Q1, Q2, Q3, Q4, Q5, Q6, Q7, Q8, Q9, and in addition to any of the items Q10, Q11, and Q12 are experiencing severe school food insecurity with hunger.
Children in households and in schools experience food insecurity in different ways; there is an added layer of uncertainties, worries, and anxieties if the households and the schools lack access to food at the same time. Findings of this study are consistent with the published research findings on self-reports of child food insecurity or food insecurity of children being reported by adult members of the household. These publications include: Wolfe and Frongillo (2001), Nord et al. (2002), Coates et al. (2003), Gillespie et al. (2003), Pérez-Escamilla et al. (2004), Ashiabi (2005), Frongillo and Nanama (2006), Melgar-Quinonez et al. (2006), Coates, Frongillo, et al. (2006), Coates, Wilde, et al. (2006), Nord and Romig (2006), Coates et al. (2007), Bartfeld et al. (2009), Condon et al. (2009), Bartfeld and Ahn (2011), Bartfeld and Ryu (2011), Nord (2012), Bernal et al. (2012), Gundersen et al. (2012), FAO (2013), Fram et al. (2013), Ballard et al. (2013, 2014), Benn and Carlsson, 2014), Arteaga and Heflin (2014), Huang et al. (2015), Fram et al. (2015), Huang and Barnidge (2016), Bernal, Frongillo, Herrera, and Rivera (2016), Bernal, Frongillo, and Jaffe (2016), Fox (2018), Fletcher and Frisvold (2017).
Reliability and Validity
Dropping DSFIES-SM item misfits (Q4, Q5, Q7, and Q8) decreased the internal consistency (Cronbach’s α = .70, McDonald’s ω = .70) so they were retained in the model to constitute the school food insecurity measure. Dropping survey items (Q1, Q3, Q4, Q5, and Q6) that generated negative measures slightly reduced the internal consistency of the DSFIES-SM even though coefficient values (Cronbach’s α = .71, McDonald’s ω = .72) remained acceptable. Dropping survey items (Q2, Q7, Q8, Q9, Q10, Q11, and Q12) that generated positive measures drastically reduced the internal consistency of the DSFIES-SM (Cronbach’s α = .58, McDonald’s ω = .58). Twelve items constitute the measure of school food insecurity.
Comparing the DSFIES-SM with the Community Childhood Hunger Identification Project (CCHIP) tool (Jimenez-Cruz et al., 2003), a categorical- three-point scale classifying respondents as “not hungry” (score = 0), “at risk of hunger” (score =1–4) or “hungry” (score = 5), both possessed the same reliability (Cronbach’s α = .77). Comparing the DSFIES-SM with the Townsend Food Behaviour Checklist (Cronbach’s α = .68), the reliability of the DSFIES-SM was higher (Townsend et al., 2003). The reliability of the DSFIES-SM was higher than that of the Girard four-point tool (Cronbach’s α = .72) (Girard & Sercia, 2013).
On the other hand, the reliability of the Radimer/Cornell tool (Cronbach’s α = .94) (Gollub & Weddle, 2004) and that of Household Food Insecurity Access Scale (Cronbach’s α = .94) (Jimenez-Cruz et al., 2003; Weiser et al., 2013) were significantly high. Reliability coefficients for the Kuyper past food insecurity instrument (Cronbach’s α = .84) (Kuyper et al., 2006, 2009), the Hager two-item screen instrument (Cronbach’s α = .82) (Hager et al., 2010; Swindle et al., 2013), and the Cornell Child Food Security Measure (Cronbach’s α = .81) (Sharkey et al., 2012) were slightly higher than that of the DSFIES-SM.
The average variance extracted (AVE) of 0.77 is greater than 0.05 and the square root of AVE is higher than inter-construct correlation which reflects that the DSFIES-SM has good convergent and discriminant validity. These values meet the recommendations of Fornell and Larcker (1981) for structural models with unobserved variables and measurement error.
Components in factor analysis were generally acceptable and ranged between 0.3 and 0.9 for total variance in second component and 49% for the total variance in third component. Model fit indices justified that the sample was sufficient to provide meaningful statistically significant results from all tests of reliability, un-dimensionality, and validity. Model fit indices reached a threshold acceptable for good model fit, as par the recommendations of Goretzko et al. (2023).
Recommendation
Both qualitative and quantitative (Rasch) approaches were utilized. However, the Rasch Differential Item Functioning (DFI) procedure was not carried out. The next step would be to assess DIF of the DSFIES-SM items. The DIF procedure was not done because it demanded a sufficiently large sample, divided or segregated into subgroups. Due to COVID-19 pandemic, the DSFIES-SM study could not sample heterogeneous population groups drawn from different geographies. Therefore, items that constitute the DSFIES-SM were not retained nor discarded based on the Rasch DIF technique. Investigations are required to determine if DSFIES-SM item meanings remain similar across all geographical regions. Further investigations are needed to manipulate longitudinal data drawn from sufficiently large samples (>400 persons) to assess test-retest reliability, criterion validity, other forms of construct validity, and to reveal if these findings are reproducible and valid across all low-income countries.
Conclusion
DSFIES-SM study remains inadequate to base decisions on, and much more investigations are required, considering that these study findings provide a foundational understanding for the school food insecurity measure. DSFIES-SM proves to be a robust instrument that can be used to evaluate school feeding programs. School food insecurity construct is a direct indicator that would help track and monitor the progress of school feeding in the context of low-income countries.
Supplemental Material
sj-docx-1-sgo-10.1177_21582440231212757 – Supplemental material for Day Scholars Food Insecurity Experience Scale-Survey Module (DSFIES-SM): Psychometric Analysis
Supplemental material, sj-docx-1-sgo-10.1177_21582440231212757 for Day Scholars Food Insecurity Experience Scale-Survey Module (DSFIES-SM): Psychometric Analysis by Ibrahim Kasujja, Hugo Melgar-Quinonez and Joweria Nambooze in SAGE Open
Supplemental Material
sj-docx-2-sgo-10.1177_21582440231212757 – Supplemental material for Day Scholars Food Insecurity Experience Scale-Survey Module (DSFIES-SM): Psychometric Analysis
Supplemental material, sj-docx-2-sgo-10.1177_21582440231212757 for Day Scholars Food Insecurity Experience Scale-Survey Module (DSFIES-SM): Psychometric Analysis by Ibrahim Kasujja, Hugo Melgar-Quinonez and Joweria Nambooze in SAGE Open
Supplemental Material
sj-docx-3-sgo-10.1177_21582440231212757 – Supplemental material for Day Scholars Food Insecurity Experience Scale-Survey Module (DSFIES-SM): Psychometric Analysis
Supplemental material, sj-docx-3-sgo-10.1177_21582440231212757 for Day Scholars Food Insecurity Experience Scale-Survey Module (DSFIES-SM): Psychometric Analysis by Ibrahim Kasujja, Hugo Melgar-Quinonez and Joweria Nambooze in SAGE Open
Supplemental Material
sj-docx-4-sgo-10.1177_21582440231212757 – Supplemental material for Day Scholars Food Insecurity Experience Scale-Survey Module (DSFIES-SM): Psychometric Analysis
Supplemental material, sj-docx-4-sgo-10.1177_21582440231212757 for Day Scholars Food Insecurity Experience Scale-Survey Module (DSFIES-SM): Psychometric Analysis by Ibrahim Kasujja, Hugo Melgar-Quinonez and Joweria Nambooze in SAGE Open
Supplemental Material
sj-docx-5-sgo-10.1177_21582440231212757 – Supplemental material for Day Scholars Food Insecurity Experience Scale-Survey Module (DSFIES-SM): Psychometric Analysis
Supplemental material, sj-docx-5-sgo-10.1177_21582440231212757 for Day Scholars Food Insecurity Experience Scale-Survey Module (DSFIES-SM): Psychometric Analysis by Ibrahim Kasujja, Hugo Melgar-Quinonez and Joweria Nambooze in SAGE Open
Footnotes
Acknowledgements
IK extends his sincerest gratitude to HMQ, the Margaret A. Gilliam Faculty Scholar in Global Food Security, for his consistent support as the primary academic supervisor of the DSFIES-SM study at McGill University. IK also thanks JN, the lecturer of food security at Kyambogo University, for her dedication and commitment toward seeking ethics approval for the DSFIES-SM study in Uganda.
Declaration of Conflicting Interests
The author(s) declared no potential conflicts of interest with respect to the research, authorship, and/or publication of this article.
Funding
The author(s) received no financial support for the research, authorship, and/or publication of this article.
Ethics Statement
Research Ethics Board (REB) office of McGill University approved the DSFIES-SM study to happen outside of Canada. McGill Abroad Committee granted acceptance to conduct the DSFIES-SM study as an international research activity. Under reference number: CLARKE-2021-121: A, the Clarke International University Research Ethics Committee in Uganda approved the DSFIES-SM study prior to data collection.
Data Availability Statement
Supplemental Material
Supplemental material for this article is available online.
References
Supplementary Material
Please find the following supplemental material available below.
For Open Access articles published under a Creative Commons License, all supplemental material carries the same license as the article it is associated with.
For non-Open Access articles published, all supplemental material carries a non-exclusive license, and permission requests for re-use of supplemental material or any part of supplemental material shall be sent directly to the copyright owner as specified in the copyright notice associated with the article.