
Abstract
The Zimbardo Time Perspective Inventory (ZTPI) has been extensively used, with more than 1,400 citations in Scopus alone. After identifying psychometric problems however, several authors have attempted to overcome limitations by shortening the scale. As such, there now exist multiple. shortened versions of the ZTPI, all using some of the original 56 items. Although each shorter version reports various broadly acceptable validity parameters using the group with which it was developed, these are often sample specific and at the cost of reliability, generalizability, and ability to detect individual differences in the construct. To examine this more closely, we reviewed the psychometric properties of the ZTPI and some of its derivatives, and found that data-driven approaches to creating these shortened versions of the scale prioritized improved model fit over internal reliability and sensitivity. In conclusion, we suggest that it is time for a new collaborative strategy to address conceptual and measurement concerns with the ZTPI, and discourage data-driven and sample-specific solutions to the psychometric concerns of the scale’s scores. More broadly, we recommend that researchers consider the impact on reliability, generalizability, and ability to detect individual differences when developing short psychometric scales.
The psychological construct broadly known as time perspective has been defined as “the often nonconscious process whereby the continual flows of personal and social experiences are assigned to temporal categories, or time frames, that help give order, coherence, and meaning to those events” (Zimbardo & Boyd, 1999, p. 1271). It is an area of psychology that has grown rapidly in recent years, and with more than 1,400 citations in Scopus, the Zimbardo Time Perspective Inventory (ZTPI; Zimbardo & Boyd, 1999) has become an important assessment tool for the construct. The ZTPI was developed to assess time perspective in five dimensions, namely, (a) past negative (PN), which assesses a general sense of pessimism toward past events; (b) past positive (PP), which assesses warmth and happiness about past events; (c) present hedonistic (PH), which relates to pleasure, risk taking, and enjoyment of one’s current life; (d) present fatalistic (PF), characterized by a sense of powerlessness over life, and the fact that fate is determined by forces beyond our control; and (e) future (F), which focuses on planning to achieve long-term goals and outcomes. The multiplicity of studies using the ZTPI is welcome, and collectively, these can provide insight into the way in which time perspective relates to a range of human behaviors, provided that the scale used is psychometrically robust and internally consistent.
Using the ZTPI, researchers have reported significant and meaningful relationships between time perspective and a range of constructs including, but not limited to, aggression (Zimbardo & Boyd, 1999), psychopathology (McKay et al., 2016; Zimbardo & Boyd, 1999), life satisfaction (Zhang, Howell, & Stolarski, 2013), and substance use (Keough et al., 1999; McKay et al., 2014). Concurrent with the rise in the number of studies using the ZTPI overall, the number of studies querying the psychometric properties of the ZTPI have also increased (e.g., Davis & Cernas-Ortiz, 2017; Sircova et al., 2014; Worrell et al., 2018). Although a number of other temporal psychology measures are available (e.g., the Temporal Focus Scale [Shipp et al., 2009] or the Adolescent and Adult Time Inventory–Time Attitudes Scale [Mello et al., 2016; Mello & Worrell, 2007]), these are more narrowly focused instruments (exclusively assessing cognitions and affect, respectively), whereas the ZTPI was purposively designed to examine cognition, affect, and behavior.
The response of some researchers to the ongoing psychometric issues associated with the ZTPI (Zimbardo & Boyd, 1999) detailed elsewhere (e.g., Crockett et al., 2009; Sircova et al., 2014; Worrell & Mello, 2007) has been the development of shortened forms of the scale. At least six research teams have recently produced short forms of the scale (Košt’ál et al., 2015; Laghi et al., 2013; Orkibi, 2015; Orosz et al., 2015; Sircova et al., 2014; Zhang, Howell, & Bowerman, 2013) and a full list of each item in these six versions is contained in the appendix. However, the psychometric validity and reliability of scores on these versions has not been replicated in multiple samples from different cultural contexts (Worrell et al., 2018; Temple et al., 2019). Indeed, this plethora of ZTPI versions is fracturing an already complicated literature.
Additional to the psychometric concerns surrounding these new scales is their practical utility. Accordingly, the present study sought to examine the practicalities of creating and using such scales. Although participant completion time is significantly reduced with the use of short forms of scales, we believe that there are two additional practical questions in using shortened versions: (a) Do they provide substantively different findings from the longer versions and (b) are they able to detect change as well as the longer versions? With regard to the first question, the shortened versions have been created to overcome factorial validity issues with the original 56-item ZTPI by selecting only the items with the highest factor loadings and reducing the number of estimated parameters. If researchers are claiming that the original measure does not accurately measure time perspective, then it is logical to assume that newer versions, if they are more accurately measuring the construct, will yield substantively different results. With regard to the second question, we consider the extent to which score distribution is affected by the final number of items in each factor. Shorter scales are inherently less sensitive in their distribution than longer scales due to a reduction of possible outcome scores. For example, based on a 5-point response scale, a three-item scale has 13 possible total scores, and each interval increases by 0.333. A five-item scale has 24 possible scores with intervals of 0.200, and an eight-item scale has 33 possible scores with intervals of 0.125. Shortened scales, therefore, reduce sensitivity by having fewer intervals and are, therefore, less likely to detect differences between samples. To illustrate this, consider the impact of a respondent completing the scale on two occasions, and on the second occasion marking just one item 1 point higher. On the three-item scale, this is a change of 10%. On the five-item scale, it represents a change of 6.25%, and on the eight-item scale, it represents a change of just 4%. This means that our eight-item scale can detect a 4% change, whereas the three-item scale would not. This is particularly relevant when trying to determine the effectiveness of an intervention.
The present study examined the psychometric validity, internal consistency, and mean scores of a series of versions of the ZTPI, and, where possible, examined the practical utility (relative to the original version) using scores on criterion variables. This represents a secondary analysis of existing data, and the study is constrained by data already gathered.
Method
Participants
Secondary analyses were undertaken on data from five samples in four countries. American participants were 816 academically talented adolescents (aged 11–18 years; 46.6% male) who had been attending a summer research program at a university in California. Acceptance criteria onto the summer program included school achievement, recommendation by teachers, and evidence of competent academic work to date. Participants were mostly in seventh through 11th grades.
A general population sample of N = 667 participants were recruited in Australia (aged 17–70 years, M = 29.45 years; 67.8% female). Participants were recruited online through a variety of social media platforms (e.g., Facebook, forums). This was done by means of email snowballing, and through advertisements on university portal systems (e.g., Moodle, Blackboard).
Participants in the British adolescent sample were 913 school children (aged 12–16 years; 49.8% male) who were attending 10 high schools in Northern Ireland. Although a total of 943 participants were recruited, 30 were excluded because questionnaires were only partially completed (participants arrived late) or deliberately spoiled.
Participants in the British university were 455 undergraduates (aged 18–25 years; 49.7% male) recruited through opportunistic and snowball sampling by students attending university in the north west of England.
Participants in the Slovenian study were a mixture of adolescents and young adults (N = 425; aged 15–29 years, 70.4% female). Participants in this study completed the questionnaire online accessed via email or social media platforms (e.g., Facebook).
Measures
The entire, original 56-item ZTPI (Zimbardo & Boyd, 1999) was administered to each of the samples in their respective studies following ethical approval from a host institution in each country. Additional to examining the full version, a total of six short forms of the ZTPI were analyzed by selecting the necessary items from the full data set, all of which purportedly retain the five-factor structure of the original ZTPI. Each version of the ZTPI has been presented with psychometric properties justifying its validity and internal consistency.
The ZTPI-36 (Sircova et al., 2014) was developed after testing in a 24-country sample study and is comprised of 36 items. The authors reported the following model fit indices for the scale: comparative fit index (CFI) = 0.860, standardized root mean square residual (SRMR) = 0.062, root mean square error of approximation (RMSEA) = 0.057, and internal consistency estimates of mean Cronbach’s alpha, PP = .70, PN = .81, PH = .78, PF = .69, F = .74.
The ZTPI-25 (Laghi et al., 2013) is comprised of 25 items. The authors did not report any model fit indices for the scale but did report internal consistency estimates (α): PP = .83, PN = .82, PH = .84, PF = .85, F = .81.
The ZTPI-20 (Orkibi, 2015) is comprised of 20 items. In the development of the scale, fit indices in the poor to acceptable range were reported: CFI = 0.895; Tucker–Lewis index (TLI) = 0.912, RMSEA = 0.054. Three of the internal consistency estimates (Cronbach’s α) were acceptable, with two, those for past positive and present fatalistic, suboptimal: PP = .69, PN = .80, PH = .73, PF = .65, F = .70.
The ZTPI-17 (Orosz et al., 2015) is comprised of 17 items. The authors reported the following model fit indices for their 17-item version: CFI = 0.953, TLI = 0.941, RMSEA = 0.040, and internal consistency estimates of alpha, PP = .68, PN = .84, PH = .73, PF = .69, F = .70.
The short ZTPII (SZTPI-15) (Zhang, Howell, & Bowerman, 2013) is comprised of 15 items. The authors did not report any model fit indices or internal consistency estimates for the scale, but did report convergent validity correlations between SZTPI-15 subscales and ZPTI subscales ranging from .67 to .81, and discriminant validity (off-diagonal) correlations ranging from −.04 to .36.
The ZTPI-short (Košt’ál et al., 2015) is comprised of 15 items. Given that this was a secondary analysis of existing data, we were not able to test their hypothesized six-factor scale. Instead, we used their five-factor version for which they had reported acceptable model fit indices: CFI = 0.944, TLI = 0.921, RMSEA = 0.047, and Cronbach’s α = .65 to .78.
Participants in the U.K. adolescent sample variously completed a number of additional scales and these were included in these analyses to enable us to assess whether the ZTPI versions demonstrate differential associations to other constructs (there was insufficient time for all participants to complete all scales; see Table 4).
The Aggression Questionnaire (AQ; Buss & Perry, 1992) is a 29-item scale assessing aggression in four domains: verbal aggression, physical aggression, anger, and hostility. Responses for all items were used herein to yield an overall aggression score. Responses are given on a 5-point Likert-type scale from 1 (very unlike me) to 5 (very like me). Internal consistency in the present study was acceptable for an overall aggression score (α = .79).
The Rosenberg Self-Esteem Scale (RSES; Rosenberg, 1989) measures self-esteem using 10 items, five of which are reverse scored. Responses are given on a 4-point Likert-type scale from 1 (strongly disagree) to 4 (strongly agree). Scores on the RSES in the present study were shown to be internally consistent (α = .82).
The Parents Scale of the Inventory of Parent and Peer Attachment–Revised (IPPA-R; Gullone & Robinson, 2005) was used to measure parental attachment, or perceived parental security. The scale assesses this in three domains: trust, communication, and alienation. Responses are on a 5-point Likert-type scale from 1 (almost never true) to 5 (almost always true). Scores on all the parental items were used to indicate an overall attachment or security score, rather than domain-specific ones (α = .77).
The Academic Self-Efficacy subscale of the Self-Efficacy Questionnaire for Children (SEQ-C; Muris, 2001) was used. This contains seven items that assess the degree to which individuals feel that they are competent academically. Responses are given on a 5-point Likert-type scale (1 = not at all, 5 = very well). Internal consistency was acceptable in the present study (α = .84).
The Adolescent Alcohol Involvement Scale (AAIS; Mayer & Filstead, 1979) was used to indicate individuals’ overall relationship with alcohol. The 14-item self-report screening measure helps identify problematic levels of adolescent alcohol use. Responses are given on a 5-point Likert-type scale, allowing for a highest possible score of 79. Internal consistency in the present study was acceptable (α = .73).
In terms of rationale for using these measures, self-esteem and aggression were both used by Zimbardo and Boyd (1999) in the ZTPI validation study, and additionally, these authors examined convergent validity of ZTPI scores against alcohol use in that same period (Keough et al., 1999).
Statistical Analyses
To determine the similarity of the different versions, two main questions were addressed: To what extent do these scales share variance and to what extent are they substantively different? To examine the extent to which variance is shared, Pearson’s bivariate correlations between all factors across the seven versions in the five samples were examined. To test the extent to which versions are substantively different, Cohen’s d was calculated based on mean and standard deviation values.
Due to the relatively large sample sizes, p values were not relevant. Rather, we chose to report the effect size to guide conclusions. Results were interpreted in accordance to Ferguson’s (2009) recommendations on effect sizes. Specifically, for correlation coefficients, r values greater than .2 were considered as the recommended minimum practically significant effect size (RMPE), .5 was considered as moderate, and .8 and above was a strong effect. Consistent and very strong effects reflect large shared variance and, therefore, indicate that little unique variance is explained. RMPE for Cohen’s d was .41, as per Ferguson’s recommendation.
To examine the impact of scale length on factorial validity, we conducted confirmatory factor analysis (CFA) and exploratory structural equation modeling (ESEM) on each scale in each sample. 1 As with most CFA models, and how the ZTPI measurement model is exclusively presented, we tested this as an independent cluster model (ICM), in which each item loads onto its intended factor only and all cross loadings are constrained to zero. This can sometimes lead to model misfit, particularly in longer scales, as negligible cross-loadings contribute to weaker model fit (Perry et al., 2015). ESEM (Asparouhov & Muthén, 2009) allows all items to be freely estimated on all factors, such as in exploratory factor analysis, but retains the a priori model and examines on the same fit indices as CFA, this being the main benefit over CFA models, as nonsignificant cross-loadings do not present as misspecifications. Model fit was interpreted by broadly using Hu and Bentler’s (1999) guidelines for fit indices of CFI and TLI values close to 0.95 representing good fit, and RMSEA and SRMR values close to 0.05 and 0.08, respectively, representing good model fit. However, as complex models rarely meet these criteria (Perry et al., 2015), such values were not considered as golden rules (Marsh et al., 2004).
We next examined measurement invariance for each ZTPI version using each sample in a multigroup CFA (total n = 3,260). This process followed four sequential steps. First, configural invariance was tested by replicating the model across all five samples. If this achieved an arguably satisfactory fit, we progressed to test metric invariance by constraining factors. Third, in the event that metric invariance were supported, scalar invariance (by means of constraining factors and intercepts) would be examined. Finally, in the event that scalar invariance were also supported, tests of residual invariance would be undertaken, by constraining factors, item intercepts, and factor means. Support for measurement invariance would be observed in the event of there being little change in the fit of the increasingly constrained models. As an indication of invariance, we adopted Cheung and Rensvold’s (2002) suggestion of ΔCFI ≤ 0.01.
The most commonly used assessment of internal consistency is Cronbach’s alpha (Cronbach, 1951). This coefficient is related to the number of test items as well as the average intercorrelation among the items. Therefore, high internal consistency is governed by how closely the items are related and how many items there are in total. Although placing such importance on the number of items in a scale is likely detrimental to short versions, it probably reduces error in a scale, as the effect of one item on an aggregate subscale score is less, and, as a result, the subscale score becomes less sensitive. For each scale’s scores, we calculated alpha coefficients, employing the commonly accepted criterion of .70 as supporting internal consistency (Nunnally, 1978). To remove the reliance on the number of items, we also calculated mean interitem correlations (MICs). A good MIC is relative to the number of items, as a short scale requires a much higher MIC relative to a longer scale to be considered reliable. A simple example of this is presented by Cortina (1993), who noted that to achieve α = .80, a hypothetical three-item scale requires an MIC of .57, whereas a hypothetical 10-item scale would only require an MIC of .28.
To examine the potential for each scale to detect differences, we charted the distribution on subscale scores in each sample and inspected them visually. A sharper peak means that a second set of data, such as that from a retest after intervention or different group, would be less likely to overlap and, therefore, increase the researcher’s ability to detect statistically significant differences.
Finally, to examine the degree (if at all) to which scores on the various shortened forms correlated substantively with construct validators (and to what degree those correlations differed by ZTPI version), we identified the highest and lowest correlates of the shortened versions of the ZTPI with associated constructs and performed a Fisher’s r to z transformation to examine the extent to which correlation coefficients were significantly different.
Results
Similarity/Difference of Scores
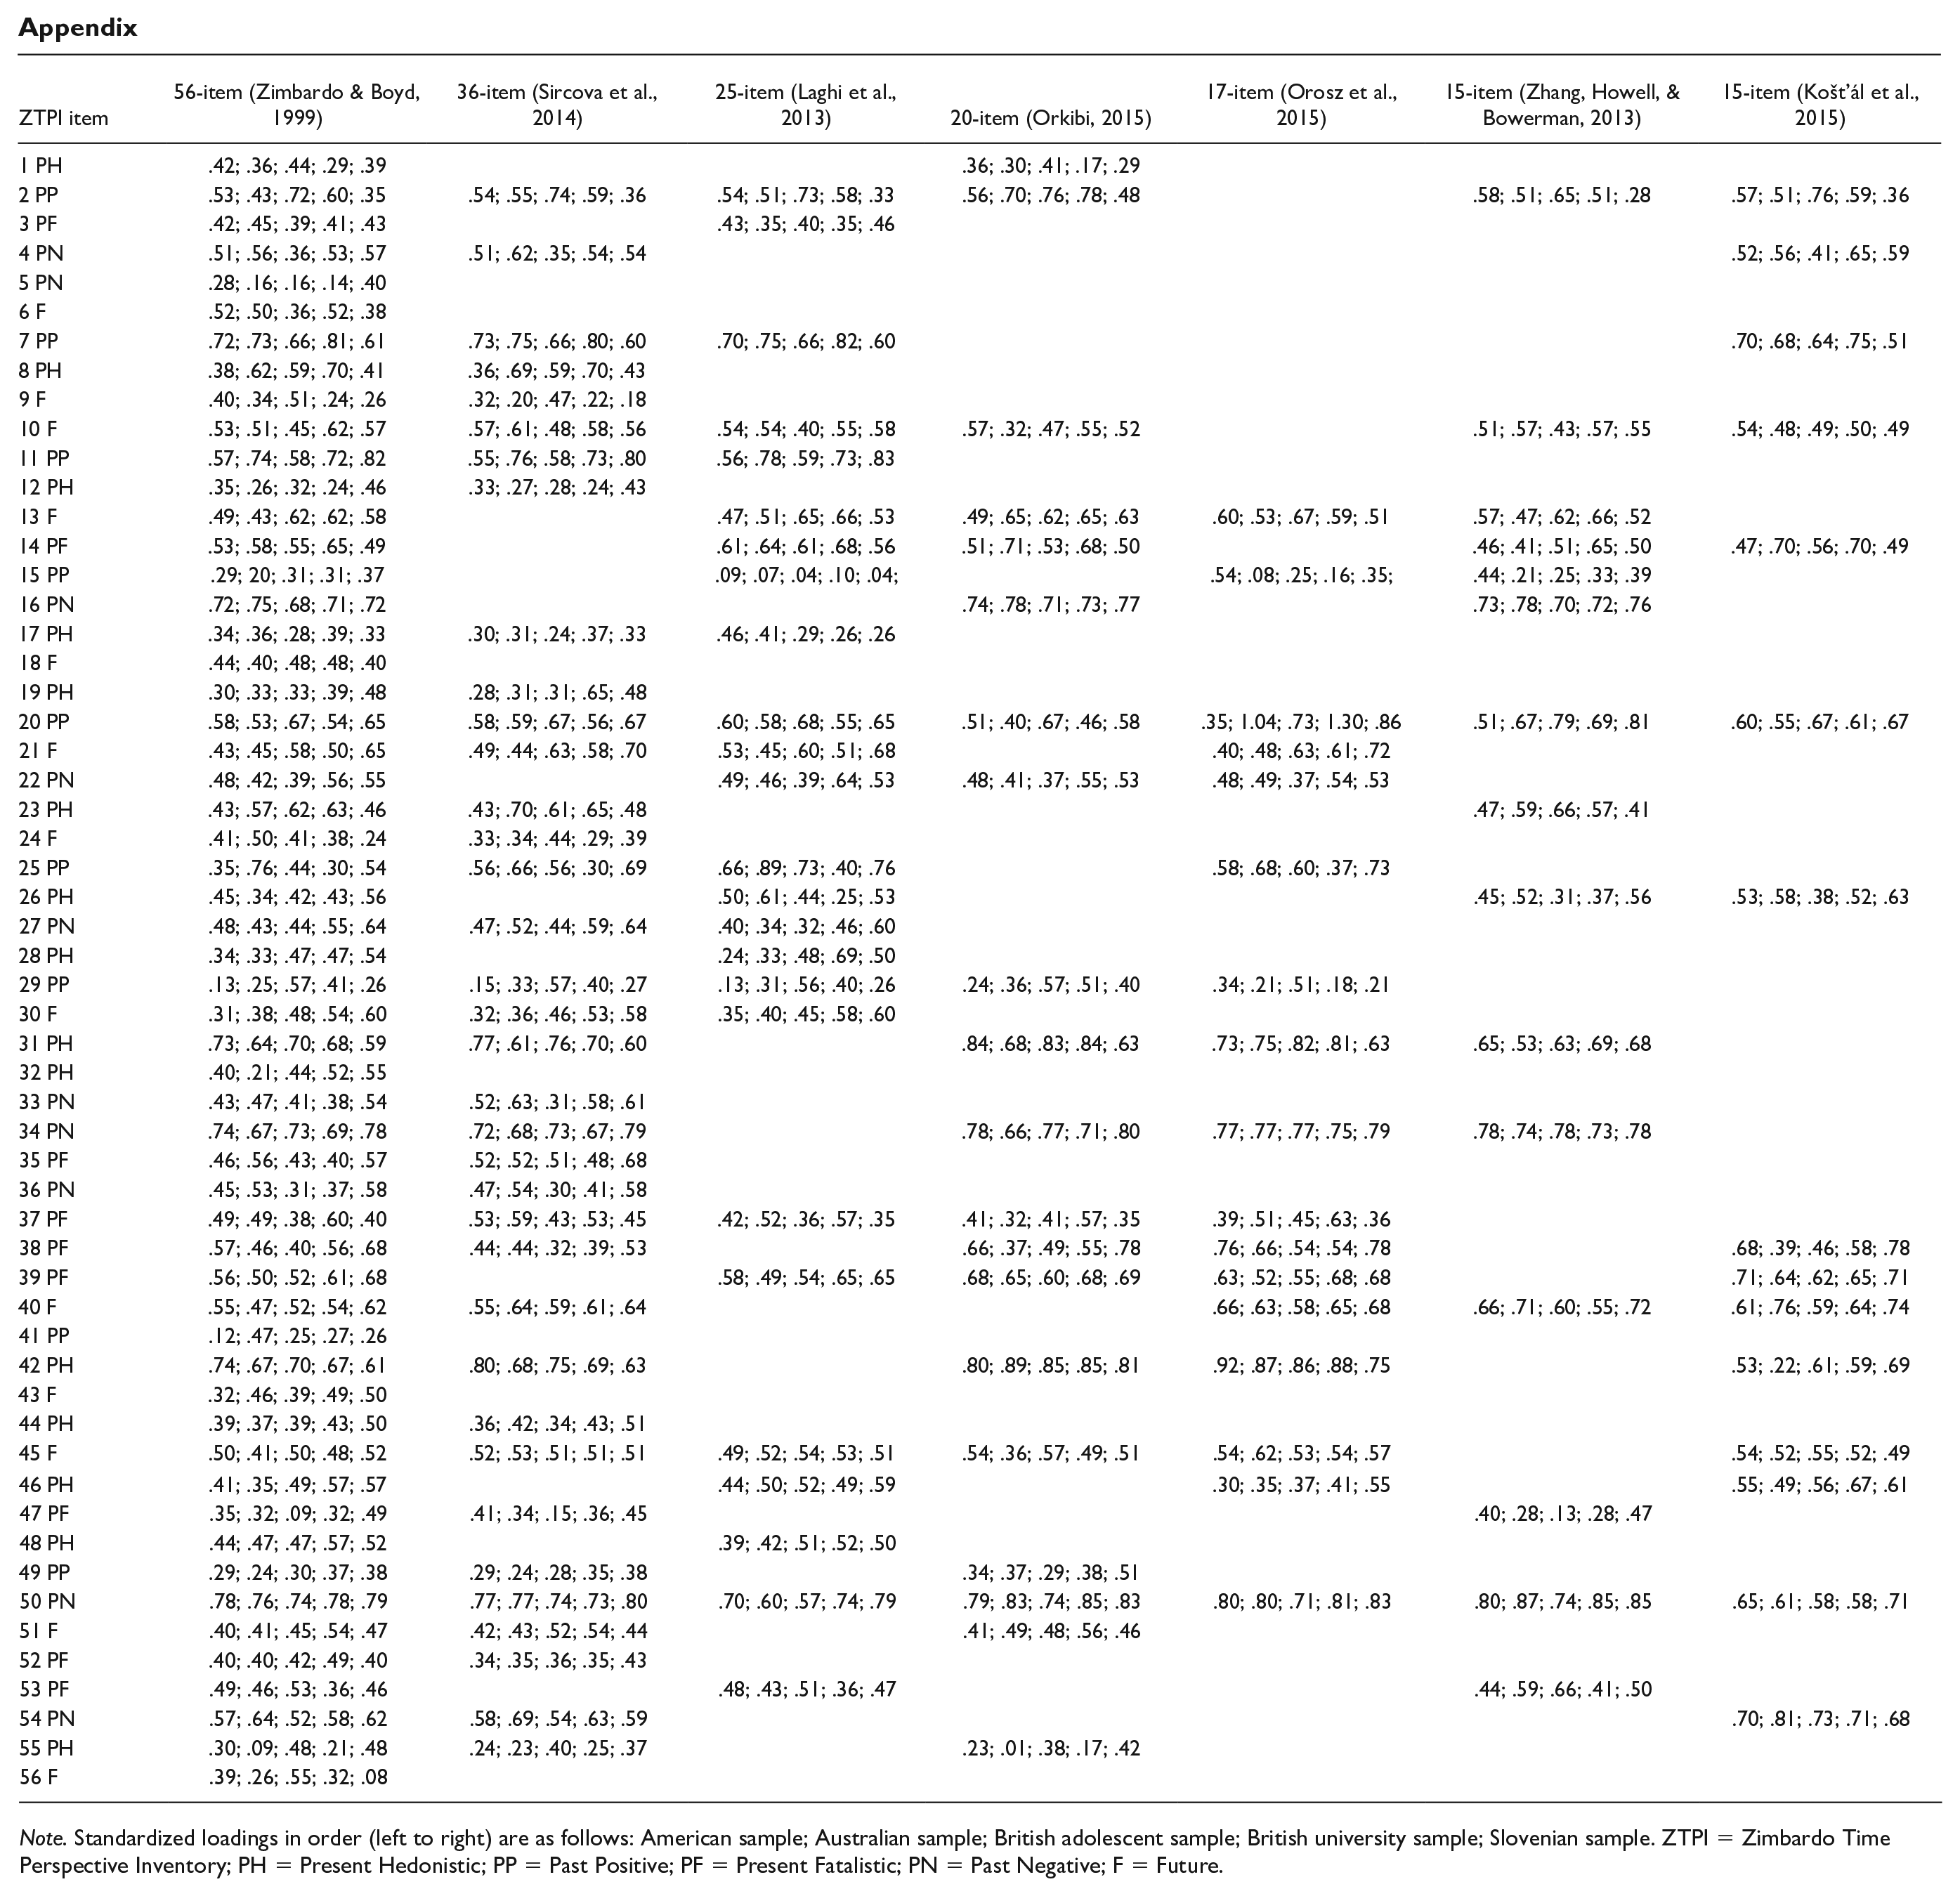
The standardized loadings for each of the items in all five samples are displayed for information in the appendix. Mean, standard deviation, and normality statistics are presented in Table 1. On first inspection, mean scores appear to remain relatively stable in each scale across the different samples although the standard deviation typically increases in the shorter scales. All skewness (<2) and kurtosis (<2) statistics supported univariate normality. Next, we examined the extent to which each scale in each sample was similar or different compared with each version of the ZTPI. These results are tabulated in the supplemental material by subscale (Tables A–E). Specifically, statistics above the diagonal in each table indicate similarity (Pearson’s product coefficient [r]), whereas statistics below the diagonal represent the extent to which each scale generates a different score (Cohen’s d).
Mean, Standard Deviation, and Normality Statistics for Each Version in Each Sample.
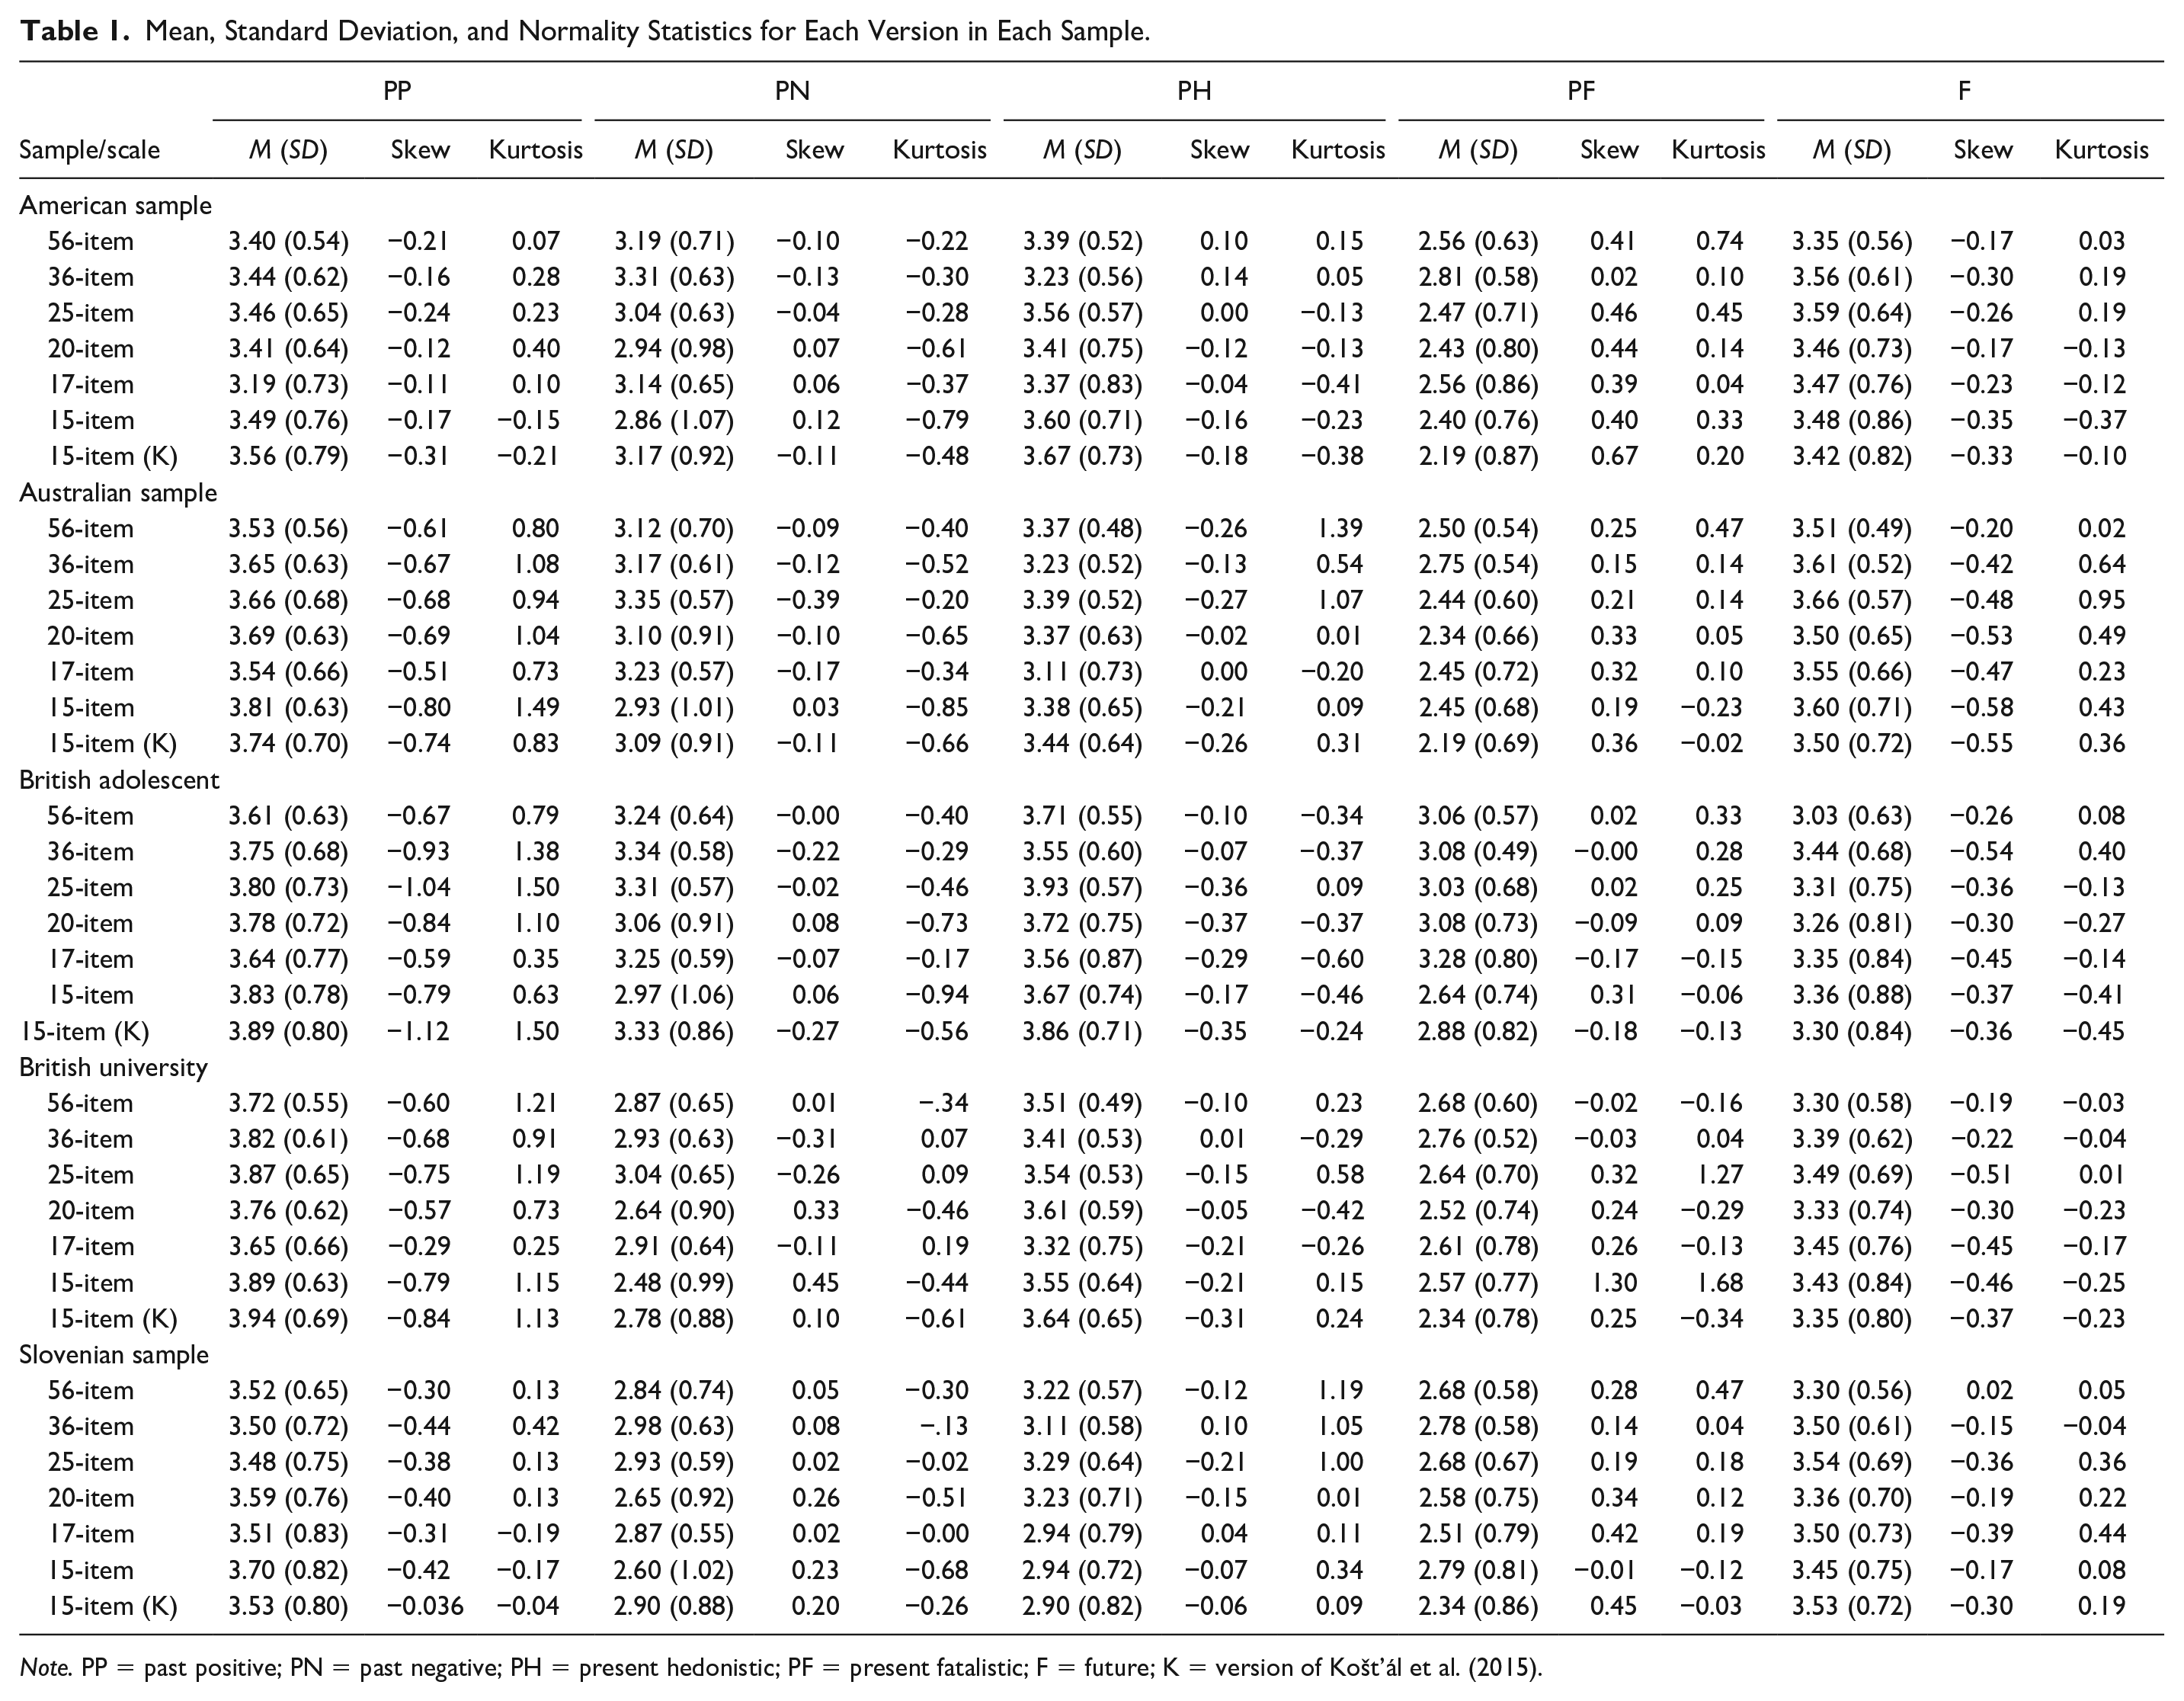
Note. PP = past positive; PN = past negative; PH = present hedonistic; PF = present fatalistic; F = future; K = version of Košt’ál et al. (2015).
In total, each comparison of the ZTPI versions, measuring the same dimension within each sample, generates 20 (Cohen’s d) effect sizes and, therefore, with five samples, 100 effect sizes per scale and 500 effect sizes overall. With reference to substantive difference (d ≥ .41), 61 (12.2%) comparisons can be considered different. Notably, 49 of the 61 came from the present dimensions of the ZTPI (hedonistic = 21, fatalist = 28). Across the 300 comparisons made (Supplemental Tables A–E) on the past and future scales, only 12 (4%) were substantively different. Relative to the original 56-item ZTPI, 150 comparisons were made in total. The PP scale yielded only one substantive difference (15 items in Australian sample), the PN scale had one (17 items in Australian sample), PH had five (all from the three shortest scales and three from the Slovenian sample), PF had seven, and the F scale had four (all from British adolescent sample) substantively different mean scores.
The PP scale (Supplemental Table A) presented very high similarity across versions, as mean correlations ranged from r = .79 (American sample) to r = .85 (Slovenian sample). The 56-, 36-, and 25-item scales presented extremely high similarity across samples: between the 56 and 36 (r = .89–.94), the 56 and 25 (r = .87–.91), and the 36 to 25 (r = .96–.97). In terms of difference, no effect sizes indicated RMPE ≥ .41 in two samples (British adolescent and Slovenian), only one d ≥ 0.41 was observed in the American and British university samples, and d ≥ 0.41 on two occasions in the Australian sample. The PN scale (Supplemental Table B) did not present any substantive differences between versions among any samples (d = 0.08–0.39). In fact, only one effect size was > .30. Average correlations ranged from r = .73 to .85 (Supplemental Tables A–E).
For the PH scale (Supplemental Table C), the only substantive difference (d ≥ 0.41) was evident between the 56-item and 36-item scales in the American sample. However, this scale presented some minor differences, as 15 of the 25 average effect sizes across the five samples exceeded .20. This finding was also reflected in slightly smaller average correlations (r = .66–.83) than for the other scales. The most substantial differences were observed in the PF scale (Supplemental Table D). In particular, the 36-item and 15-item versions yielded substantively different mean effect sizes compared with the other scales in all samples. Overall, seven of the 25 average effect sizes exceeded .40. In terms of similarity, correlations ranged from moderate (r = .53) to large (r = .84). The F scale (Supplemental Table E) presented no substantive difference between any scale in any sample with the exception of the British adolescent sample (d = 0.09–0.29; British adolescent 56-item average d = 0.43). Regarding similarity, the versions presented remarkably similar mean scores, with all average correlations equal or greater than .80 (r = .80–.87).
Structural Validity and Internal Consistency
Table 2 presents model fit results for CFAs and ESEMs of all ZTPI versions in the current samples. Clearly, there is a trend for model fit to improve as the scale is shortened. However, this is often at the cost of internal consistency. Internal consistency estimates are presented in Table 3 for both Cronbach’s alpha and MIC. The original 56-item ZTPI met the .70 criteria on all subscales in all samples with the exception of PP (twice) and PF (once). That equates to meeting the threshold 22 of the 25 times (88%). The 36-item version met the threshold on nine occasions (36%), the 25-item achieved this 10 times (40%), and the 20-item managed seven (28%). Of the shortest scales, the 17-item met the .70 threshold 8 times (32%), the Zhang, Howell, and Bowerman (2013) 15-item 5 times (20%), and the Košt’ál et al. (2015) 15-item 4 times (16%). It is worth noting that the PN scale accounted for 27 of the 43 (63%) consistencies greater than .70 among all shortened versions. In contrast, the PF scale only accounted for one (2%). Moreover, although there is a pattern for the MIC to increase in shorter scales, the increases are not great enough to yield acceptable internal consistency estimates.
Model Fit for CFA and ESEM on All ZTPI Versions.

Note. CFA = confirmatory factor analysis; ESEM = exploratory structural equation modeling; ZTPI = Zimbardo Time Perspective Inventory; χ2s-b = Satorra–Bentler adjusted chi-square; df = degrees of freedom; CFI = comparative fit index; TLI = Tucker–Lewis index; SRMR = standardized root measure square residual; RMSEA = root mean square error of approximation; CI = confidence interval; PP = past positive; PN = past negative; PH = present hedonistic; PF = present fatalistic; F = future; K = version of Košt’ál et al. (2015).
Cronbach’s Alpha and MIC Estimates for All ZTPI Versions in Each Sample.

Note. MIC = mean interitem correlation; ZTPI = Zimbardo Time Perspective Inventory; K = version of Košt’ál et al. (2015).
To determine whether there were any other consequences of the length of scale, we graphed the distribution of ZTPI dimensions for each scale, using data from the five samples (Supplemental Figures 1–5). The PP distributions (Supplemental Figure 1) indicate almost identical results from each scale. For all other dimensions, there is a consistent trend across samples for shorter versions to generate broader distribution within a sample, as indicated by the flatter curves (Supplemental Figures 2–5). This creates a lower ceiling and higher floor for the within-sample distributions, thereby reducing the potential for shorter versions to capture the full spectrum of individual differences within each affected dimension.
Invariance testing found that no ZTPI version presented strong invariance (Table 4). Configural models could not be adequately fitted on the 56-item and 36-item versions. The 25-item version failed to converge. The 17-item and Zhang et al.’s 15-item versions failed metric invariance. Although metric invariance was supported by the 20-item and Košt’ál et al.’s 15-item versions, scalar invariance was not. Consequently, residual invariance was not tested on any version of the scale.
Measurement Invariance Across Samples.

Note. CFI = comparative fit index; TLI = Tucker–Lewis index; SRMR = standardized root mean square residual; RMSEA = root mean square error of approximation; CI = confidence interval.
Finally, Table 5 displays the correlation coefficients for scores on the full ZTPI and scores on concurrent validators. In addition, the range of coefficients for scores on the shortened versions are also displayed. For the majority of correlations (13/25), Fisher’s z scores indicated that there was no significant difference in the size of the correlations between scores on different short forms and scores on concurrent validators. When the lowest coefficient was removed (thus comparing the largest with the second lowest), a further seven became nonsignificant, giving a total of 20 out of 25, where it could not be claimed that substantial differences exist in how scores on the shortened forms relate to concurrent validators. Furthermore, even those that are noted as statistically significantly different would still derive the same conclusion. For example, that self-esteem relationships with past positive time perspective ranged from .07 to .19 (p = .01) means that all such interpretations would be that there is no substantive relationship.
Correlation Coefficients in British Adolescent Sample for Full, 56-Item ZTPI, and the Six Shortened Versions.
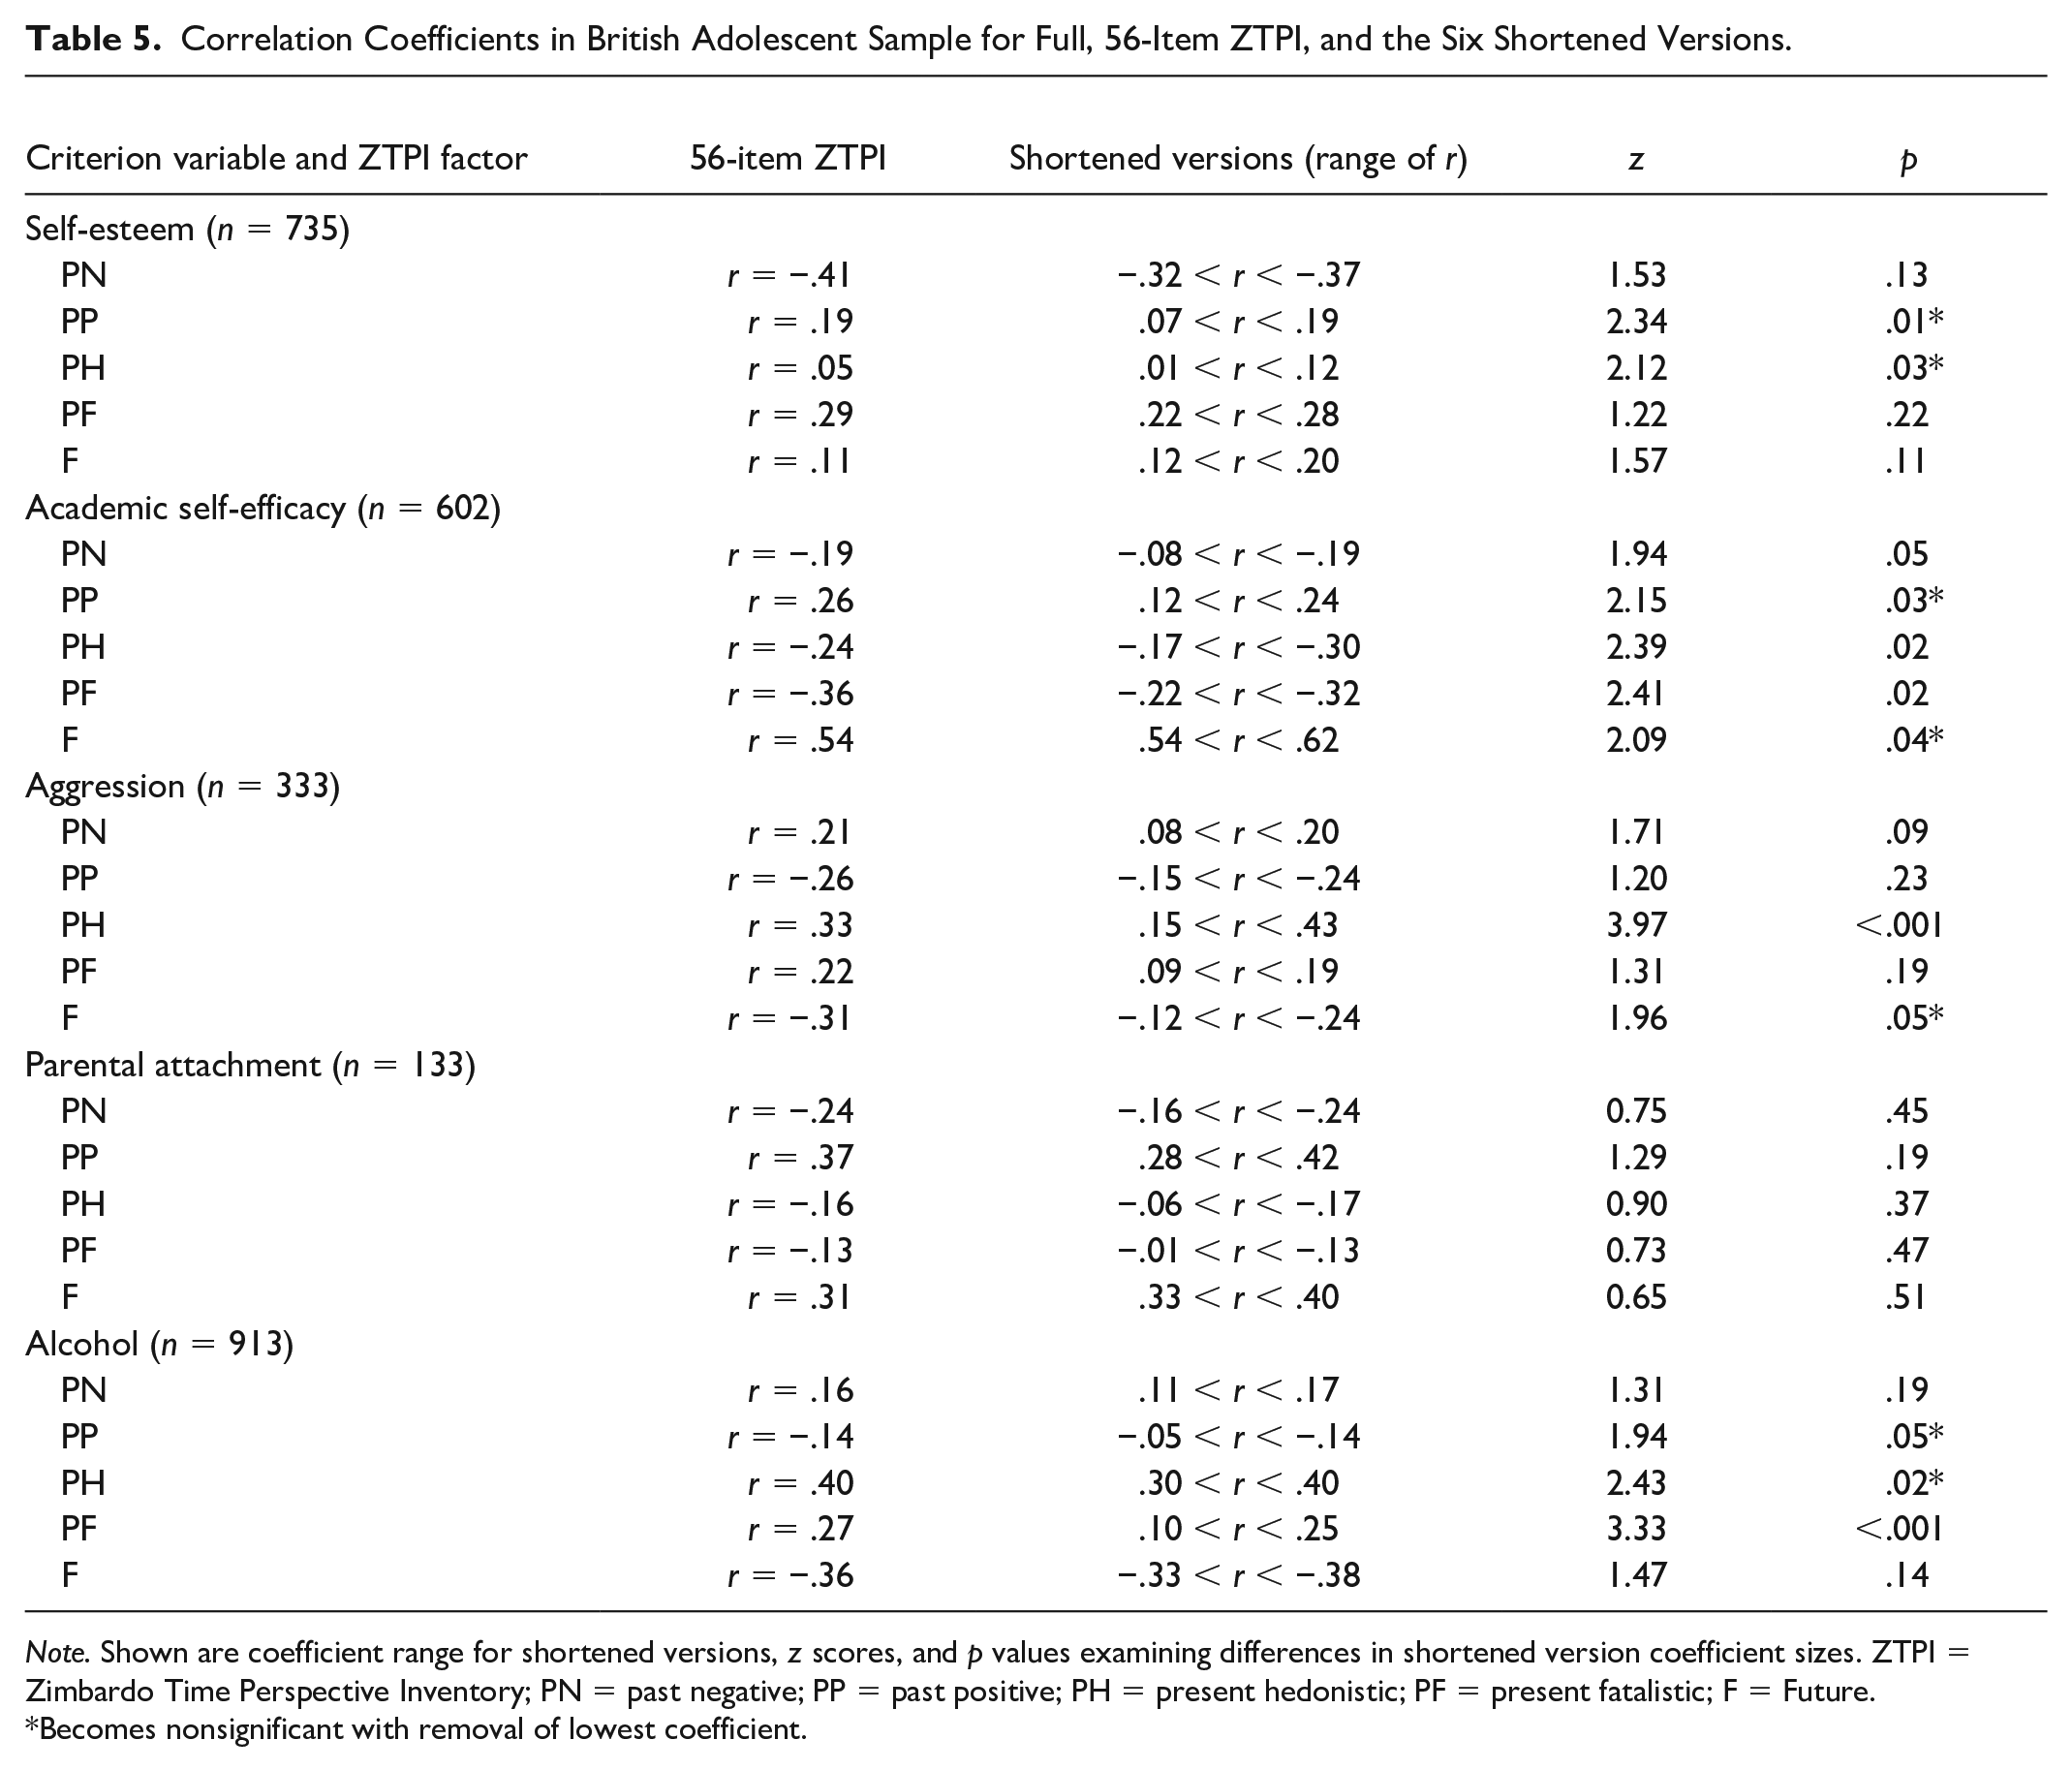
Note. Shown are coefficient range for shortened versions, z scores, and p values examining differences in shortened version coefficient sizes. ZTPI = Zimbardo Time Perspective Inventory; PN = past negative; PP = past positive; PH = present hedonistic; PF = present fatalistic; F = Future.
Becomes nonsignificant with removal of lowest coefficient.
Discussion
In this study, we aimed to examine the extent to which shortened versions generate substantively different subscale scores than the original ZTPI and to determine the effect that shortening a scale has on sample distribution and our ability to detect individual or group differences. Structural validity fit indices for the three longest versions were generally poor, and the fit indices of the short versions fluctuated by sample and could not demonstrate sufficient measurement invariance. However, examination of mean scores generated by the different versions indicates that for the PP, PN, and F dimensions, there are no meaningful differences among versions of the ZTPI. One might argue that broadly identifying the same outcomes and improved incremental model fit on a shorter scale offers a more parsimonious measure. However, given the sacrifice of reliability to achieve this, the shortened versions offer the same result without the stability of the original version. Substantively different scores are identified for the PH and PF scales, however. That is not to say that any one version produces the “correct” scores, but that scores on the shorter versions are often different from those generated from the original ZTPI. Perhaps not surprisingly, the scores on these subscales also yield the weakest reliability estimates. Furthermore, alpha values for past positive in the present study were notably poor across samples, mirroring the findings of Davis and Cernas-Ortiz (2017).
Regarding reliability and validity, Widaman et al. (2011) reminded us that reliability is a prerequisite for validity and, although aware of its limitations, recommended that researchers interested in creating short forms of scales might select items with the highest MIC to preserve reliability. This is inherently problematic when trying to achieve a good model fit however, because high levels of internal consistency in anything other than very lengthy scales are created by a high MIC. However, in a structural equation model, this will likely mean that the error terms of such items will have a high covariance, which is constrained to zero in ICMs such as traditional CFA. Thus, modification indices are high for the association between items. If the researchers’ only interest is to raise the CFI by virtue of a reduced chi-square statistic, the removal of such items will aid them to achieve their goal. This is literally an example of reducing internal consistency in favor of improving model fit. This practice is evident in several of the papers detailing the creation of the shorter versions explored here.
The significant overlap in sample distribution is also an indicator that there is little substantive difference among most versions of the ZTPI. In a practical sense, however, it is evident that four of the five dimensions (excluding PP) consistently present more platykurtic sample distributions in shorter versions. This finding makes detecting a statistically significant difference between groups less likely. In short, although they save on participant time and present higher incremental fit indices, shortened scales are less sensitive and, therefore, of less practical use, particularly if one were to aim to evaluate the effectiveness of an intervention. Given the reduced score intervals available in short versions, it is effectively like choosing to measure height in centimeters rather than millimeters.
The broader implications of the study relate to the creation of short psychometric scales generally. Noting the prevalence of short forms, Widaman et al. (2011) perhaps disparagingly, referred to this as “something of a cottage industry for many practicing scientists” (p. 39). Although the focus here was to examine the versions of the ZTPI, it is recommended that researchers considering modifying other scales also consider the impact on internal consistency and distribution on the capacity to satisfactorily detect differences. It sometimes seems that methods of achieving psychometric validity or reliability are arbitrarily given more credibility than others without a rationale being provided. For example, in terms of factorial validity, the absolute fit indices (SRMR and RMSEA) for the ZTPI are generally acceptable. The impact of shortening the scale is largely on the incremental fit indices (CFI and TLI); yet, there is no rationale provided as to why any fit indices should take precedence over others and simple reliability coefficients, which are clearly sacrificed.
As noted, the original ZTPI and subsequent versions have psychometric problems, and addressing these concerns could make a significant and positive contribution to our assessment of time perspective and our understanding of temporal psychology. Simply removing items to create a shorter version of the scale, however, is not the appropriate approach. Rather, researchers should adopt a theoretically driven, empirically tested approach to find solutions. Such an approach was recently advocated by Worrell et al. (2018). These authors recommended that the ZTPI be culled of non–time-specific items (i.e., items that did not explicitly use words such as “past,” “future,” “tomorrow”), for example, “it upsets me to be late for appointments” or “I do things impulsively.” Worrell et al. reported that including only explicit temporally phrased items resulted in a scale with better psychometric validity and internal consistency than for original ZTPI scores. However, they also reported ongoing problems with the PF and PH factors, specifically their factor loading coefficients and reliability estimates, although they did conclude that their new theoretically driven ZTPI could be a useful starting point (in terms of specific items) for a more psychometrically valid version of the ZTPI. This stands in contrast to the multiplicity of data-driven solutions currently being provided. Linking this to the issues previously discussed regarding the alpha values for past positive, it is interesting that four out of nine past positive items cryptically refer to things such as “the way things used to be” or “good times.” Furthermore, two discuss “childhood,” with only three items (7, 11, and 25) explicitly mentioning “the past.”
There is one important limitation with respect to the present study, namely, that analyses on the psychometric properties of each of the small scales were performed using participant responses to the whole ZTPI. Assessing “short forms” of scales where items were originally administered in a longer scale version (in short, extracting item responses to assess a short form, post hoc) can be problematic (Knowles & Condon, 2000), in particular the fact that responses to items on scales often involves more than responding to the semantic content of the item. Respondents interpret the items within a context. As the context for an item changes, even as its position in the test changes, the meaning of the item may shift. (p. 250)
Although the present results need to be understood in that context, we conclude that the multiplicity of shortened versions of the ZTPI serves neither a conceptual nor a methodological purpose other than to further fracture an already disjointed literature. Moreover, we implore researchers in all areas of psychology developing shortened scales to carefully consider the impact on internal consistency and the capacity to satisfactorily detect differences.
Relevance of the Article to the United Nations Sustainable Development Goals
Time perspective has been found to be closely related to both health and well-being, and to the way in which individuals consider environmental issues. To further explore these relationships, it is important that the way in which time perspective is measured is both accurate and reliable. The present article raises some important questions about the ZTPI, and suggests that simply creating shortened versions of the scale may not be helping to yield more valid and reliable scores.
Supplemental Material
Sage_Open_Supplementary – Supplemental material for Different Version, Similar Result? A Critical Analysis of the Multiplicity of Shortened Versions of the Zimbardo Time Perspective Inventory
Supplemental material, Sage_Open_Supplementary for Different Version, Similar Result? A Critical Analysis of the Multiplicity of Shortened Versions of the Zimbardo Time Perspective Inventory by John L. Perry, Elizabeth C. Temple, Frank C. Worrell, Urška Zivkovic, Zena R. Mello, Bojan Musil, Jon C. Cole and Michael T. McKay in SAGE Open
Footnotes
Appendix
| ZTPI item | 56-item (Zimbardo & Boyd, 1999) | 36-item (Sircova et al., 2014) | 25-item (Laghi et al., 2013) | 20-item (Orkibi, 2015) | 17-item (Orosz et al., 2015) | 15-item (Zhang, Howell, & Bowerman, 2013) | 15-item (Košt’ál et al., 2015) |
|---|---|---|---|---|---|---|---|
| 1 PH | .42; .36; .44; .29; .39 | .36; .30; .41; .17; .29 | |||||
| 2 PP | .53; .43; .72; .60; .35 | .54; .55; .74; .59; .36 | .54; .51; .73; .58; .33 | .56; .70; .76; .78; .48 | .58; .51; .65; .51; .28 | .57; .51; .76; .59; .36 | |
| 3 PF | .42; .45; .39; .41; .43 | .43; .35; .40; .35; .46 | |||||
| 4 PN | .51; .56; .36; .53; .57 | .51; .62; .35; .54; .54 | .52; .56; .41; .65; .59 | ||||
| 5 PN | .28; .16; .16; .14; .40 | ||||||
| 6 F | .52; .50; .36; .52; .38 | ||||||
| 7 PP | .72; .73; .66; .81; .61 | .73; .75; .66; .80; .60 | .70; .75; .66; .82; .60 | .70; .68; .64; .75; .51 | |||
| 8 PH | .38; .62; .59; .70; .41 | .36; .69; .59; .70; .43 | |||||
| 9 F | .40; .34; .51; .24; .26 | .32; .20; .47; .22; .18 | |||||
| 10 F | .53; .51; .45; .62; .57 | .57; .61; .48; .58; .56 | .54; .54; .40; .55; .58 | .57; .32; .47; .55; .52 | .51; .57; .43; .57; .55 | .54; .48; .49; .50; .49 | |
| 11 PP | .57; .74; .58; .72; .82 | .55; .76; .58; .73; .80 | .56; .78; .59; .73; .83 | ||||
| 12 PH | .35; .26; .32; .24; .46 | .33; .27; .28; .24; .43 | |||||
| 13 F | .49; .43; .62; .62; .58 | .47; .51; .65; .66; .53 | .49; .65; .62; .65; .63 | .60; .53; .67; .59; .51 | .57; .47; .62; .66; .52 | ||
| 14 PF | .53; .58; .55; .65; .49 | .61; .64; .61; .68; .56 | .51; .71; .53; .68; .50 | .46; .41; .51; .65; .50 | .47; .70; .56; .70; .49 | ||
| 15 PP | .29; 20; .31; .31; .37 | .09; .07; .04; .10; .04; | .54; .08; .25; .16; .35; | .44; .21; .25; .33; .39 | |||
| 16 PN | .72; .75; .68; .71; .72 | .74; .78; .71; .73; .77 | .73; .78; .70; .72; .76 | ||||
| 17 PH | .34; .36; .28; .39; .33 | .30; .31; .24; .37; .33 | .46; .41; .29; .26; .26 | ||||
| 18 F | .44; .40; .48; .48; .40 | ||||||
| 19 PH | .30; .33; .33; .39; .48 | .28; .31; .31; .65; .48 | |||||
| 20 PP | .58; .53; .67; .54; .65 | .58; .59; .67; .56; .67 | .60; .58; .68; .55; .65 | .51; .40; .67; .46; .58 | .35; 1.04; .73; 1.30; .86 | .51; .67; .79; .69; .81 | .60; .55; .67; .61; .67 |
| 21 F | .43; .45; .58; .50; .65 | .49; .44; .63; .58; .70 | .53; .45; .60; .51; .68 | .40; .48; .63; .61; .72 | |||
| 22 PN | .48; .42; .39; .56; .55 | .49; .46; .39; .64; .53 | .48; .41; .37; .55; .53 | .48; .49; .37; .54; .53 | |||
| 23 PH | .43; .57; .62; .63; .46 | .43; .70; .61; .65; .48 | .47; .59; .66; .57; .41 | ||||
| 24 F | .41; .50; .41; .38; .24 | .33; .34; .44; .29; .39 | |||||
| 25 PP | .35; .76; .44; .30; .54 | .56; .66; .56; .30; .69 | .66; .89; .73; .40; .76 | .58; .68; .60; .37; .73 | |||
| 26 PH | .45; .34; .42; .43; .56 | .50; .61; .44; .25; .53 | .45; .52; .31; .37; .56 | .53; .58; .38; .52; .63 | |||
| 27 PN | .48; .43; .44; .55; .64 | .47; .52; .44; .59; .64 | .40; .34; .32; .46; .60 | ||||
| 28 PH | .34; .33; .47; .47; .54 | .24; .33; .48; .69; .50 | |||||
| 29 PP | .13; .25; .57; .41; .26 | .15; .33; .57; .40; .27 | .13; .31; .56; .40; .26 | .24; .36; .57; .51; .40 | .34; .21; .51; .18; .21 | ||
| 30 F | .31; .38; .48; .54; .60 | .32; .36; .46; .53; .58 | .35; .40; .45; .58; .60 | ||||
| 31 PH | .73; .64; .70; .68; .59 | .77; .61; .76; .70; .60 | .84; .68; .83; .84; .63 | .73; .75; .82; .81; .63 | .65; .53; .63; .69; .68 | ||
| 32 PH | .40; .21; .44; .52; .55 | ||||||
| 33 PN | .43; .47; .41; .38; .54 | .52; .63; .31; .58; .61 | |||||
| 34 PN | .74; .67; .73; .69; .78 | .72; .68; .73; .67; .79 | .78; .66; .77; .71; .80 | .77; .77; .77; .75; .79 | .78; .74; .78; .73; .78 | ||
| 35 PF | .46; .56; .43; .40; .57 | .52; .52; .51; .48; .68 | |||||
| 36 PN | .45; .53; .31; .37; .58 | .47; .54; .30; .41; .58 | |||||
| 37 PF | .49; .49; .38; .60; .40 | .53; .59; .43; .53; .45 | .42; .52; .36; .57; .35 | .41; .32; .41; .57; .35 | .39; .51; .45; .63; .36 | ||
| 38 PF | .57; .46; .40; .56; .68 | .44; .44; .32; .39; .53 | .66; .37; .49; .55; .78 | .76; .66; .54; .54; .78 | .68; .39; .46; .58; .78 | ||
| 39 PF | .56; .50; .52; .61; .68 | .58; .49; .54; .65; .65 | .68; .65; .60; .68; .69 | .63; .52; .55; .68; .68 | .71; .64; .62; .65; .71 | ||
| 40 F | .55; .47; .52; .54; .62 | .55; .64; .59; .61; .64 | .66; .63; .58; .65; .68 | .66; .71; .60; .55; .72 | .61; .76; .59; .64; .74 | ||
| 41 PP | .12; .47; .25; .27; .26 | ||||||
| 42 PH | .74; .67; .70; .67; .61 | .80; .68; .75; .69; .63 | .80; .89; .85; .85; .81 | .92; .87; .86; .88; .75 | .53; .22; .61; .59; .69 | ||
| 43 F | .32; .46; .39; .49; .50 | ||||||
| 44 PH | .39; .37; .39; .43; .50 | .36; .42; .34; .43; .51 | |||||
| 45 F | .50; .41; .50; .48; .52 | .52; .53; .51; .51; .51 | .49; .52; .54; .53; .51 | .54; .36; .57; .49; .51 | .54; .62; .53; .54; .57 | .54; .52; .55; .52; .49 | |
| 46 PH | .41; .35; .49; .57; .57 | .44; .50; .52; .49; .59 | .30; .35; .37; .41; .55 | .55; .49; .56; .67; .61 | |||
| 47 PF | .35; .32; .09; .32; .49 | .41; .34; .15; .36; .45 | .40; .28; .13; .28; .47 | ||||
| 48 PH | .44; .47; .47; .57; .52 | .39; .42; .51; .52; .50 | |||||
| 49 PP | .29; .24; .30; .37; .38 | .29; .24; .28; .35; .38 | .34; .37; .29; .38; .51 | ||||
| 50 PN | .78; .76; .74; .78; .79 | .77; .77; .74; .73; .80 | .70; .60; .57; .74; .79 | .79; .83; .74; .85; .83 | .80; .80; .71; .81; .83 | .80; .87; .74; .85; .85 | .65; .61; .58; .58; .71 |
| 51 F | .40; .41; .45; .54; .47 | .42; .43; .52; .54; .44 | .41; .49; .48; .56; .46 | ||||
| 52 PF | .40; .40; .42; .49; .40 | .34; .35; .36; .35; .43 | |||||
| 53 PF | .49; .46; .53; .36; .46 | .48; .43; .51; .36; .47 | .44; .59; .66; .41; .50 | ||||
| 54 PN | .57; .64; .52; .58; .62 | .58; .69; .54; .63; .59 | .70; .81; .73; .71; .68 | ||||
| 55 PH | .30; .09; .48; .21; .48 | .24; .23; .40; .25; .37 | .23; .01; .38; .17; .42 | ||||
| 56 F | .39; .26; .55; .32; .08 |
Note. Standardized loadings in order (left to right) are as follows: American sample; Australian sample; British adolescent sample; British university sample; Slovenian sample. ZTPI = Zimbardo Time Perspective Inventory; PH = Present Hedonistic; PP = Past Positive; PF = Present Fatalistic; PN = Past Negative; F = Future.
Author Note
Elizabeth C. Temple is now affiliated to the University of New England, Armidale, NSW, Australia.
Declaration of Conflicting Interests
The author(s) declared no potential conflicts of interest with respect to the research, authorship, and/or publication of this article.
Funding
The author(s) received no financial support for the research, authorship, and/or publication of this article.
Supplemental Material
Supplemental material for this article is available online.
Notes
References
Supplementary Material
Please find the following supplemental material available below.
For Open Access articles published under a Creative Commons License, all supplemental material carries the same license as the article it is associated with.
For non-Open Access articles published, all supplemental material carries a non-exclusive license, and permission requests for re-use of supplemental material or any part of supplemental material shall be sent directly to the copyright owner as specified in the copyright notice associated with the article.